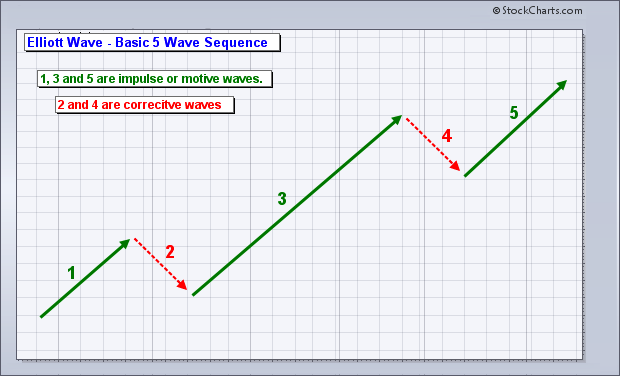
SPX - Sell after an EW 5-Wave Advance Trader53's - Trading / Investment Philosophy https://investorshub.advfn.com/uicon/155361.png?cb=636145175889330000 _______________________________________________________________ * You can't know where you're going, unless you know where you've been ! _______________________________________________________________ * Buy on Capitulation , Sell on the CELEBRATION ! * Buy the Dump , Sell on the PUMP ! * Buy on Rumor , Sell on NEWS ! * Buy on Fear , Sell on the CHEER ! * Trade well , trade often ! ______________________________________________________________ Sell after an Elliott Wave 5-Wave Advance https://investorshub.advfn.com/boards/read_msg.aspx?message_id=147897822 https://investorshub.advfn.com/uimage/uploads/2018/1/20/fofsgElliott_Wave_Basic_5_Wave_Sequence.png https://investorshub.advfn.com/uimage/uploads/2019/3/27/orjmdElliott_Wave_Example_2_with_Wave_Count_shown.png _________________________________________________________________ https://investorshub.advfn.com/uimage/uploads/2020/5/8/tefpzSPX_May_7_Chart_Minutes.png https://investorshub.advfn.com/uimage/uploads/2020/5/8/mogxnSPX_May_7_Chart_Short_term.png investorshub.advfn.com/uimage/uploads/2020/4/29/bqiinSPX_Apr_29_Annotated_Chart_Showing_5_Waves_Up.PNG https://finviz.com/fut_chart.ashx?t=ES&cot=138741,13874A&p=d1&rev=635706094042193689 _________________________________________________________________ investorshub.advfn.com/uimage/uploads/2020/4/29/jnjzuSPX_Apr_29_Annotated_Chart_Showing_5_Wave_Advance.PNG https://www.stockscores.com/chart.asp?TickerSymbol=$SPX&TimeRange=180&Interval=d&Volume=1&ChartType=OHLC&Stockscores=1&ChartWidth=1100&ChartHeight=480&LogScale=None&Band=None&avgType1=SMA&movAvg1=8&avgType2=SMA&movAvg2=34&Indicator1=RSI&Indicator2=PPO&Indicator3=AccDist&Indicator4=MFI&endDate=&CompareWith=&entryPrice=&stopLossPrice= https://finviz.com/fut_chart.ashx?t=ES&cot=138741,13874A&p=d1&rev=635706094042193689 https://www.stockscores.com/chart.asp?TickerSymbol=$SPX&TimeRange=365&Interval=d&Volume=1&ChartType=OHLC&Stockscores=1&ChartWidth=1100&ChartHeight=480&LogScale=None&Band=None&avgType1=SMA&movAvg1=8&avgType2=SMA&movAvg2=34&Indicator1=RSI&Indicator2=PPO&Indicator3=AccDist&Indicator4=MFI&endDate=&CompareWith=&entryPrice=&stopLossPrice= https://www.stockscores.com/chart.asp?TickerSymbol=$SPX&TimeRange=720&Interval=120&Volume=1&ChartType=OHLC&Stockscores=1&ChartWidth=1100&ChartHeight=480&LogScale=None&Band=None&avgType1=SMA&movAvg1=8&avgType2=SMA&movAvg2=34&Indicator1=RSI&Indicator2=PPO&Indicator3=AccDist&Indicator4=MFI&endDate=&CompareWith=&entryPrice=&stopLossPrice= https://www.stockscores.com/chart.asp?TickerSymbol=$SPX&TimeRange=720&Interval=w&Volume=1&ChartType=OHLC&Stockscores=1&ChartWidth=1100&ChartHeight=480&LogScale=None&Band=None&avgType1=SMA&movAvg1=8&avgType2=SMA&movAvg2=34&Indicator1=RSI&Indicator2=PPO&Indicator3=AccDist&Indicator4=MFI&endDate=&CompareWith=&entryPrice=&stopLossPrice= https://www.stockscores.com/chart.asp?TickerSymbol=$SPX&TimeRange=1095&Interval=w&Volume=1&ChartType=OHLC&Stockscores=1&ChartWidth=1100&ChartHeight=480&LogScale=None&Band=None&avgType1=SMA&movAvg1=8&avgType2=SMA&movAvg2=34&Indicator1=RSI&Indicator2=PPO&Indicator3=AccDist&Indicator4=MFI&endDate=&CompareWith=&entryPrice=&stopLossPrice= https://finviz.com/fut_chart.ashx?t=ES&cot=138741,13874A&p=w1&rev=637188845040627269 https://www.stockscores.com/chart.asp?TickerSymbol=$SPX&TimeRange=1825&Interval=w&Volume=1&ChartType=OHLC&Stockscores=1&ChartWidth=1100&ChartHeight=480&LogScale=None&Band=None&avgType1=SMA&movAvg1=8&avgType2=SMA&movAvg2=34&Indicator1=RSI&Indicator2=PPO&Indicator3=AccDist&Indicator4=MFI&endDate=&CompareWith=&entryPrice=&stopLossPrice= https://www.stockscores.com/chart.asp?TickerSymbol=$SPX&TimeRange=3650&Interval=w&Volume=1&ChartType=OHLC&Stockscores=1&ChartWidth=1100&ChartHeight=480&LogScale=None&Band=None&avgType1=SMA&movAvg1=8&avgType2=SMA&movAvg2=34&Indicator1=RSI&Indicator2=PPO&Indicator3=AccDist&Indicator4=MFI&endDate=&CompareWith=&entryPrice=&stopLossPrice= https://www.stockscores.com/chart.asp?TickerSymbol=$SPX&TimeRange=3650&Interval=m&Volume=1&ChartType=OHLC&Stockscores=1&ChartWidth=1100&ChartHeight=480&LogScale=None&Band=None&avgType1=SMA&movAvg1=8&avgType2=SMA&movAvg2=34&Indicator1=RSI&Indicator2=PPO&Indicator3=AccDist&Indicator4=MFI&endDate=&CompareWith=&entryPrice=&stopLossPrice= https://finviz.com/fut_chart.ashx?t=ES&cot=138741,13874A&p=m1&rev=636365517037664961 https://www.stockscores.com/chart.asp?TickerSymbol=$SPX&TimeRange=7300&Interval=m&Volume=1&ChartType=OHLC&Stockscores=1&ChartWidth=1100&ChartHeight=480&LogScale=None&Band=None&avgType1=SMA&movAvg1=8&avgType2=SMA&movAvg2=34&Indicator1=RSI&Indicator2=PPO&Indicator3=AccDist&Indicator4=MFI&endDate=&CompareWith=&entryPrice=&stopLossPrice= https://www.stockscores.com/chart.asp?TickerSymbol=$SPX&TimeRange=7300&Interval=w&Volume=1&ChartType=OHLC&Stockscores=1&ChartWidth=1100&ChartHeight=480&LogScale=None&Band=None&avgType1=SMA&movAvg1=8&avgType2=SMA&movAvg2=34&Indicator1=RSI&Indicator2=PPO&Indicator3=AccDist&Indicator4=MFI&endDate=&CompareWith=&entryPrice=&stopLossPrice= https://www.stockscores.com/chart.asp?TickerSymbol=$SPX&TimeRange=18250&Interval=w&Volume=1&ChartType=OHLC&Stockscores=1&ChartWidth=1100&ChartHeight=480&LogScale=None&Band=None&avgType1=SMA&movAvg1=8&avgType2=SMA&movAvg2=34&Indicator1=RSI&Indicator2=PPO&Indicator3=AccDist&Indicator4=MFI&endDate=&CompareWith=&entryPrice=&stopLossPrice= https://www.stockscores.com/chart.asp?TickerSymbol=$SPX&TimeRange=18250&Interval=m&Volume=1&ChartType=OHLC&Stockscores=1&ChartWidth=1100&ChartHeight=480&LogScale=None&Band=None&avgType1=SMA&movAvg1=8&avgType2=SMA&movAvg2=34&Indicator1=RSI&Indicator2=PPO&Indicator3=AccDist&Indicator4=MFI&endDate=&CompareWith=&entryPrice=&stopLossPrice= https://investorshub.advfn.com/uicon/155361.png?cb=636360310707230000 https://investorshub.advfn.com/uimage/uploads/2013/8/15/erfjyBig_Wave.jpg
 Market Data
  Markets