


Sunday, April 26, 2020 10:02:08 AM
PCTL - DOLV - Chart Comparison Analysis
PCTL - Targets $0.10 / $0.12 / $0.18

________________________________________________________________
PCTL Security Details
Share Structure
Market Value1...........$3,754,596 a/o Jan 03, 2020
Authorized Shares..1,000,000,000 a/o Dec 17, 2019
Outstanding Shares...475,265,300 a/o Dec 17, 2019
Restricted............35,139,690 a/o Dec 17, 2019
Unrestricted.........440,125,610 a/o Dec 17, 2019
Float..............Not Available
Par Value 0.001
https://www.otcmarkets.com/stock/PCTL/security
_________________________________________________________________
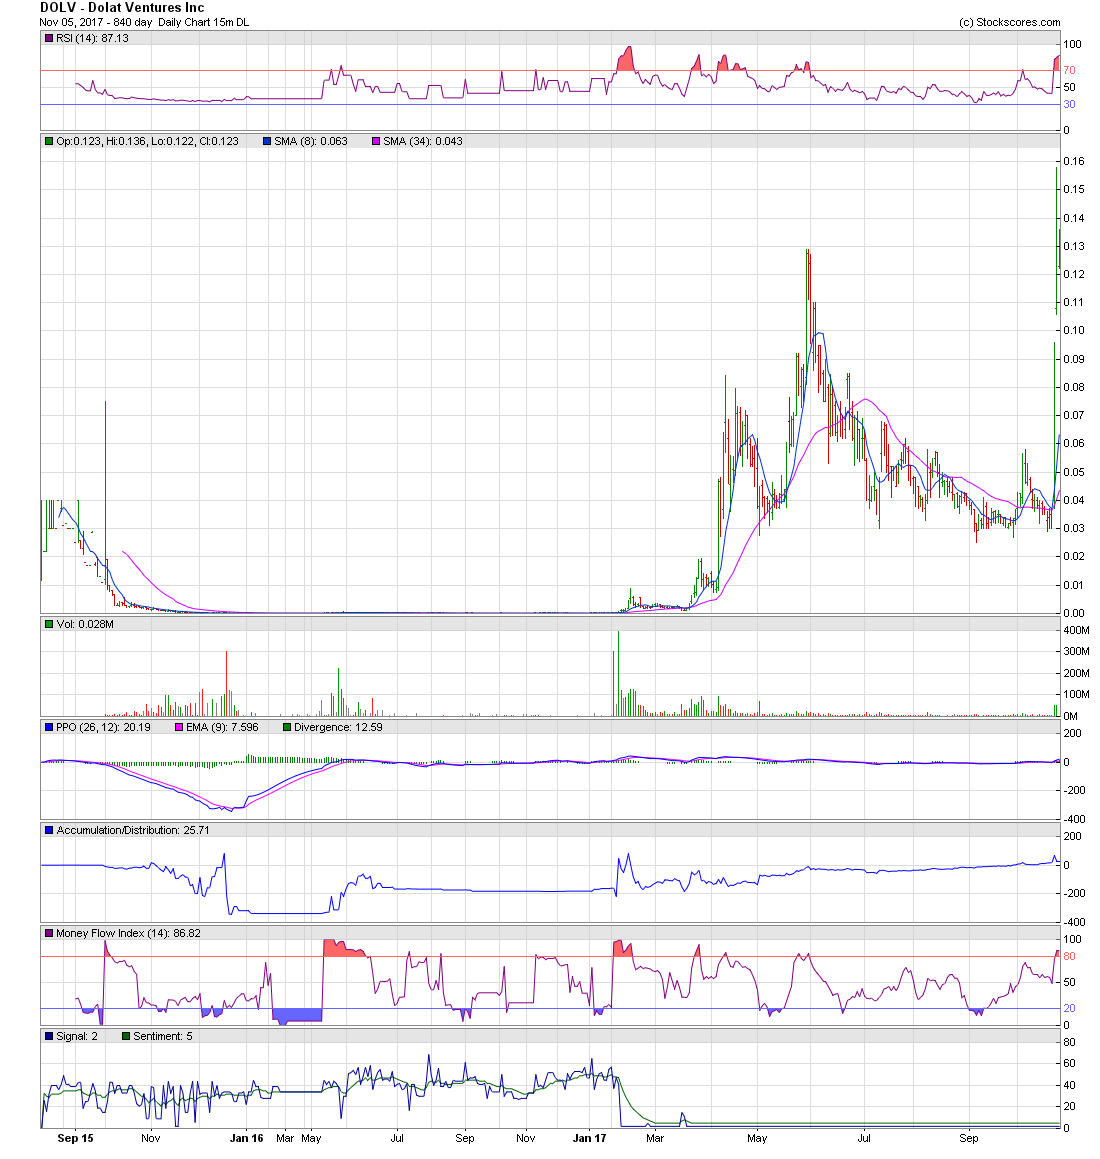
DOLV Security Details
Share Structure
Market Value1.........$2,938,706 a/o Feb 13, 2017
Authorized Shares 1,000,000,000 a/o Dec 30, 2016
Outstanding Shares..699,691,800 a/o Dec 30, 2016
Float...............643,163,847 a/o Apr 05, 2016
Par Value 0.001
_________________________________________________________________
DOLV - Alerted at 0.0002
Climbs to $0.158
https://investorshub.advfn.com/boards/read_msg.aspx?message_id=143163040
https://investorshub.advfn.com/boards/read_msg.aspx?message_id=143131413
https://investorshub.advfn.com/boards/read_msg.aspx?message_id=136148662
https://investorshub.advfn.com/boards/read_msg.aspx?message_id=135667977
https://investorshub.advfn.com/boards/read_msg.aspx?message_id=135667740
https://investorshub.advfn.com/boards/read_msg.aspx?message_id=133937728
https://investorshub.advfn.com/boards/read_msg.aspx?message_id=133937736
https://investorshub.advfn.com/boards/read_msg.aspx?message_id=133392965
https://investorshub.advfn.com/boards/read_msg.aspx?message_id=133335752
https://investorshub.advfn.com/boards/read_msg.aspx?message_id=133335779
https://investorshub.advfn.com/boards/read_msg.aspx?message_id=131775192
https://investorshub.advfn.com/boards/read_msg.aspx?message_id=131775206
https://investorshub.advfn.com/boards/read_msg.aspx?message_id=130987399
http://investorshub.advfn.com/boards/read_msg.aspx?message_id=129862971
http://investorshub.advfn.com/boards/read_msg.aspx?message_id=128711004
http://investorshub.advfn.com/boards/read_msg.aspx?message_id=128710808
_________________________________________________________________
How Targets are Calculated
Fibonacci Numbers and Retrace Targets: Explained

________________________________________________________________
Fibonacci Numbers
http://www.stockta.com/cgi-bin/school.pl?page=fib
Fibonacci Retracements
* Golden 61.8% Retracements
* Moderate 38.2% Retracements
* Common 38.2% Retracements
Fibonacci Retracements
http://stockcharts.com/school/doku.php?id=chart_school:chart_analysis:fibonacci_retracemen
________________________________________________________________
Fibonacci Numbers
are commonly used in Technical Analysis
with or without a knowledge of Elliot Wave Analysis
to determine potential support, resistance,
and price objectives.
The most popular Fibonacci Retracements are
61.8% and 38.2%
61.8% retracements
imply a new trend is establishing itself.
38.2% retracements
usually imply that the prior trend will continue
38.2% retracements
are considered natural retracements in a healthy trend.
Fibonacci Retracements
can be applied after a decline
to forecast the length of a counter-trend bounce.
________________________________________________________________
The 50% retracement is not based on a Fibonacci number.
Instead, this number stems from Dow Theory's assertion
that the Averages often retrace half their prior move.
50% retracement
implies indecision.
________________________________________________________________

________________________________________________________________
Buy after an Elliott Wave 5-Wave Decline
________________________________________________________________
The Elliott Wave 5-Waves Sequence
A Basic "A,B,C Corrective Wave"
https://www.metatrader5.com/en/terminal/help/objects/elliott/elliott_theory
________________________________________________________________


Elliott Wave Basics
http://www.acrotec.com/ewt.htm
Elliott Wave Theory
http://ta.mql4.com/elliott_wave_theory
Buy after an Elliott Wave,
5-Wave decline sequence !
A Basic "A,B,C Corrective Wave"
Buy, ONLY when the stocks price,
is trading under the Blue 8-day M.A.
when the Blue 8-day M.A. is under the Red 34-day M.A.
________________________________________________________________

_________________________________________________________________

________________________________________________________________
Live! Charts
Buy, ONLY when the stocks price,
is trading under the Blue 8-day M.A.
when the Blue 8-day M.A. is under the Red 34-day M.A.

________________________________________________________________
Live! Charts
Buy, ONLY when the stocks price,
is trading under the Blue 8-day M.A.
when the Blue 8-day M.A. is under the Red 34-day M.A.

________________________________________________________________
Buy, ONLY when the stocks price,
is trading under the Blue 8-day M.A.
when the Blue 8-day M.A. is under the Red 34-day M.A.

________________________________________________________________
Buy, ONLY when the stocks price,
is trading under the Blue 8-day M.A.
when the Blue 8-day M.A. is under the Red 34-day M.A.

________________________________________________________________
Buy, ONLY when the stocks price,
is trading under the Blue 8-day M.A.
when the Blue 8-day M.A. is under the Red 34-day M.A.

________________________________________________________________
Buy, ONLY when the stocks price,
is trading under the Blue 8-day M.A.
when the Blue 8-day M.A. is under the Red 34-day M.A.


PCTL - Targets $0.10 / $0.12 / $0.18

________________________________________________________________
PCTL Security Details
Share Structure
Market Value1...........$3,754,596 a/o Jan 03, 2020
Authorized Shares..1,000,000,000 a/o Dec 17, 2019
Outstanding Shares...475,265,300 a/o Dec 17, 2019
Restricted............35,139,690 a/o Dec 17, 2019
Unrestricted.........440,125,610 a/o Dec 17, 2019
Float..............Not Available
Par Value 0.001
https://www.otcmarkets.com/stock/PCTL/security
_________________________________________________________________
DOLV Security Details
Share Structure
Market Value1.........$2,938,706 a/o Feb 13, 2017
Authorized Shares 1,000,000,000 a/o Dec 30, 2016
Outstanding Shares..699,691,800 a/o Dec 30, 2016
Float...............643,163,847 a/o Apr 05, 2016
Par Value 0.001
_________________________________________________________________
DOLV - Alerted at 0.0002
Climbs to $0.158
https://investorshub.advfn.com/boards/read_msg.aspx?message_id=143163040
https://investorshub.advfn.com/boards/read_msg.aspx?message_id=143131413
https://investorshub.advfn.com/boards/read_msg.aspx?message_id=136148662
https://investorshub.advfn.com/boards/read_msg.aspx?message_id=135667977
https://investorshub.advfn.com/boards/read_msg.aspx?message_id=135667740
https://investorshub.advfn.com/boards/read_msg.aspx?message_id=133937728
https://investorshub.advfn.com/boards/read_msg.aspx?message_id=133937736
https://investorshub.advfn.com/boards/read_msg.aspx?message_id=133392965
https://investorshub.advfn.com/boards/read_msg.aspx?message_id=133335752
https://investorshub.advfn.com/boards/read_msg.aspx?message_id=133335779
https://investorshub.advfn.com/boards/read_msg.aspx?message_id=131775192
https://investorshub.advfn.com/boards/read_msg.aspx?message_id=131775206
https://investorshub.advfn.com/boards/read_msg.aspx?message_id=130987399
http://investorshub.advfn.com/boards/read_msg.aspx?message_id=129862971
http://investorshub.advfn.com/boards/read_msg.aspx?message_id=128711004
http://investorshub.advfn.com/boards/read_msg.aspx?message_id=128710808
_________________________________________________________________
How Targets are Calculated
Fibonacci Numbers and Retrace Targets: Explained

________________________________________________________________
Fibonacci Numbers
http://www.stockta.com/cgi-bin/school.pl?page=fib
Fibonacci Retracements
* Golden 61.8% Retracements
* Moderate 38.2% Retracements
* Common 38.2% Retracements
Fibonacci Retracements
http://stockcharts.com/school/doku.php?id=chart_school:chart_analysis:fibonacci_retracemen
________________________________________________________________
Fibonacci Numbers
are commonly used in Technical Analysis
with or without a knowledge of Elliot Wave Analysis
to determine potential support, resistance,
and price objectives.
The most popular Fibonacci Retracements are
61.8% and 38.2%
61.8% retracements
imply a new trend is establishing itself.
38.2% retracements
usually imply that the prior trend will continue
38.2% retracements
are considered natural retracements in a healthy trend.
Fibonacci Retracements
can be applied after a decline
to forecast the length of a counter-trend bounce.
________________________________________________________________
The 50% retracement is not based on a Fibonacci number.
Instead, this number stems from Dow Theory's assertion
that the Averages often retrace half their prior move.
50% retracement
implies indecision.
________________________________________________________________

________________________________________________________________
Buy after an Elliott Wave 5-Wave Decline
________________________________________________________________
The Elliott Wave 5-Waves Sequence
A Basic "A,B,C Corrective Wave"
https://www.metatrader5.com/en/terminal/help/objects/elliott/elliott_theory
________________________________________________________________


Elliott Wave Basics
http://www.acrotec.com/ewt.htm
Elliott Wave Theory
http://ta.mql4.com/elliott_wave_theory
Buy after an Elliott Wave,
5-Wave decline sequence !
A Basic "A,B,C Corrective Wave"
Buy, ONLY when the stocks price,
is trading under the Blue 8-day M.A.
when the Blue 8-day M.A. is under the Red 34-day M.A.
________________________________________________________________

_________________________________________________________________

________________________________________________________________
Live! Charts
Buy, ONLY when the stocks price,
is trading under the Blue 8-day M.A.
when the Blue 8-day M.A. is under the Red 34-day M.A.

________________________________________________________________
Live! Charts
Buy, ONLY when the stocks price,
is trading under the Blue 8-day M.A.
when the Blue 8-day M.A. is under the Red 34-day M.A.
________________________________________________________________
Buy, ONLY when the stocks price,
is trading under the Blue 8-day M.A.
when the Blue 8-day M.A. is under the Red 34-day M.A.
________________________________________________________________
Buy, ONLY when the stocks price,
is trading under the Blue 8-day M.A.
when the Blue 8-day M.A. is under the Red 34-day M.A.
________________________________________________________________
Buy, ONLY when the stocks price,
is trading under the Blue 8-day M.A.
when the Blue 8-day M.A. is under the Red 34-day M.A.
________________________________________________________________
Buy, ONLY when the stocks price,
is trading under the Blue 8-day M.A.
when the Blue 8-day M.A. is under the Red 34-day M.A.


Discover What Traders Are Watching
Explore small cap ideas before they hit the headlines.


