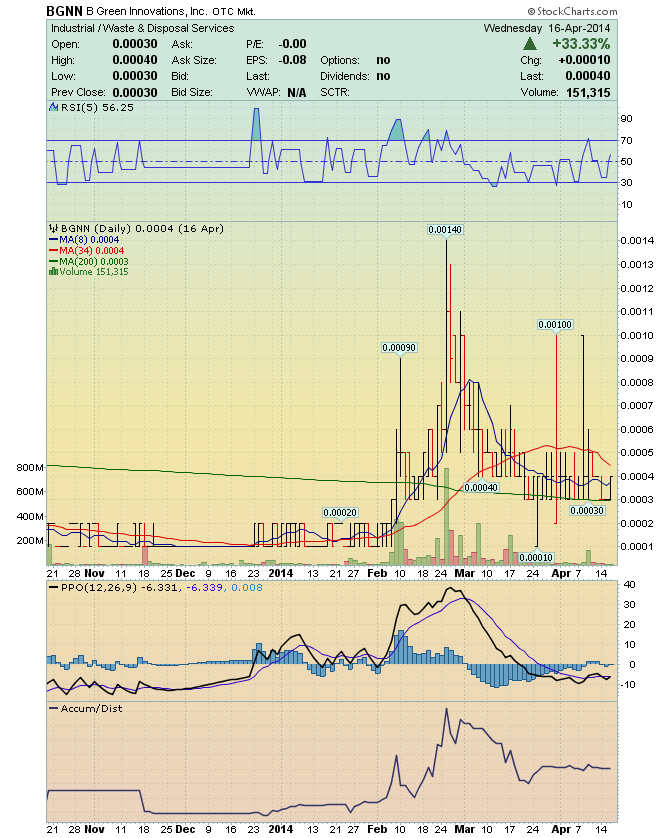
FONU - BGNN - Sell after an A-B-C Retrace FONU - BGNN - Chart Comparison Analysis I'll Alert you of stocks to Buy, before the Run happens ! https://investorshub.advfn.com/uicon/155361.png?cb=636776145039370000 ________________________________________________________________ Sell after an A-B-C Retrace Sell after a EW 5-Wave Advance Buy after an Elliott Wave 5-Wave Decline ________________________________________________________________ The Elliott Wave 5-Waves Sequence A Basic "A,B,C Corrective Wave" https://www.metatrader5.com/en/terminal/help/objects/elliott/elliott_theory ________________________________________________________________ https://investorshub.advfn.com/uimage/uploads/2017/2/16/vvrclElliott_Wave_Decline_8_Wave.png https://investorshub.advfn.com/uimage/uploads/2017/2/16/hgymrElliott_Wave_Chart.png Elliott Wave Basics http://www.acrotec.com/ewt.htm Elliott Wave Theory http://ta.mql4.com/elliott_wave_theory Buy after an Elliott Wave, 5-Wave decline sequence ! A Basic "A,B,C Corrective Wave" Buy, ONLY when the stocks price, is trading under the Blue 8-day M.A. when the Blue 8-day M.A. is under the Red 34-day M.A . ________________________________________________________________ February Runners! BGNN - Alerted at 0.0001 Climbs to 0.0014 FONU - Alerted at 0.0001 Climbs to 0.0010 https://investorshub.advfn.com/boards/read_msg.aspx?message_id=153802576 _________________________________________________________________ Embedded Charts https://investorshub.advfn.com/uimage/uploads/2014/4/18/qpkwlBGNN_Chart_2_from_0.0001_to_0.0014.png investorshub.advfn.com/uimage/uploads/2020/4/9/vrqpsFONU_Apr_9_Chart_180_day_Daily.png ________________________________________________________________ https://investorshub.advfn.com/uimage/uploads/2017/2/16/hgymrElliott_Wave_Chart.png Elliott Wave Basics http://www.acrotec.com/ewt.htm Elliott Wave Theory http://ta.mql4.com/elliott_wave_theory Buy after an Elliott Wave, 5-Wave decline sequence ! A Basic "A,B,C Corrective Wave" Buy, ONLY when the stocks price, is trading under the Blue 8-day M.A. when the Blue 8-day M.A. is under the Red 34-day M.A . ________________________________________________________________ Embedded Charts investorshub.advfn.com/uimage/uploads/2020/4/9/jkjouBGNN_Apr_16_Annotated_Chart_for_FONU_Comparison_Showing_ABC_Retrace.PNG investorshub.advfn.com/uimage/uploads/2020/4/9/vorblFONU_Apr_9_Annotated_Chart_for_BGNN_Comparison_Showing_ABC_Retrace.PNG ________________________________________________________________ https://investorshub.advfn.com/uimage/uploads/2017/2/16/hgymrElliott_Wave_Chart.png Buy, ONLY when the stocks price, is trading under the Blue 8-day M.A. when the Blue 8-day M.A. is under the Red 34-day M.A . Embedded and Live! Charts investorshub.advfn.com/uimage/uploads/2020/4/9/jkjouBGNN_Apr_16_Annotated_Chart_for_FONU_Comparison_Showing_ABC_Retrace.PNG https://www.stockscores.com/chart.asp?TickerSymbol=FONU&TimeRange=180&Interval=d&Volume=1&ChartType=OHLC&Stockscores=1&ChartWidth=1100&ChartHeight=480&LogScale=None&Band=None&avgType1=SMA&movAvg1=8&avgType2=SMA&movAvg2=34&Indicator1=RSI&Indicator2=PPO&Indicator3=AccDist&Indicator4=MFI&endDate=&CompareWith=&entryPrice=&stopLossPrice= ________________________________________________________________ Embedded and Live! Charts investorshub.advfn.com/uimage/uploads/2020/4/9/jkjouBGNN_Apr_16_Annotated_Chart_for_FONU_Comparison_Showing_ABC_Retrace.PNG https://www.stockscores.com/chart.asp?TickerSymbol=FONU&TimeRange=365&Interval=d&Volume=1&ChartType=OHLC&Stockscores=1&ChartWidth=1100&ChartHeight=480&LogScale=None&Band=None&avgType1=SMA&movAvg1=8&avgType2=SMA&movAvg2=34&Indicator1=RSI&Indicator2=PPO&Indicator3=AccDist&Indicator4=MFI&endDate=&CompareWith=&entryPrice=&stopLossPrice= ________________________________________________________________ Embedded and Live! Charts investorshub.advfn.com/uimage/uploads/2020/4/9/jkjouBGNN_Apr_16_Annotated_Chart_for_FONU_Comparison_Showing_ABC_Retrace.PNG https://www.stockscores.com/chart.asp?TickerSymbol=FONU&TimeRange=720&Interval=d&Volume=1&ChartType=OHLC&Stockscores=1&ChartWidth=1100&ChartHeight=480&LogScale=None&Band=None&avgType1=SMA&movAvg1=8&avgType2=SMA&movAvg2=34&Indicator1=RSI&Indicator2=PPO&Indicator3=AccDist&Indicator4=MFI&endDate=&CompareWith=&entryPrice=&stopLossPrice= ________________________________________________________________ Embedded and Live! Charts investorshub.advfn.com/uimage/uploads/2020/4/9/jkjouBGNN_Apr_16_Annotated_Chart_for_FONU_Comparison_Showing_ABC_Retrace.PNG https://www.stockscores.com/chart.asp?TickerSymbol=FONU&TimeRange=1095&Interval=d&Volume=1&ChartType=OHLC&Stockscores=1&ChartWidth=1100&ChartHeight=480&LogScale=None&Band=None&avgType1=SMA&movAvg1=8&avgType2=SMA&movAvg2=34&Indicator1=RSI&Indicator2=PPO&Indicator3=AccDist&Indicator4=MFI&endDate=&CompareWith=&entryPrice=&stopLossPrice= https://investorshub.advfn.com/uicon/155361.png?cb=636776145039370000
 Market Data
  Markets