ForReal, Four Charts Comparing Trump’s Vs. Obama’s Stock Market Returns
And you still refuse to accept reality.
Feb 29, 2020, 08:30am
Chuck Jones Senior Contributor Markets I cover technology companies, worldwide economies and the stock market
[...]
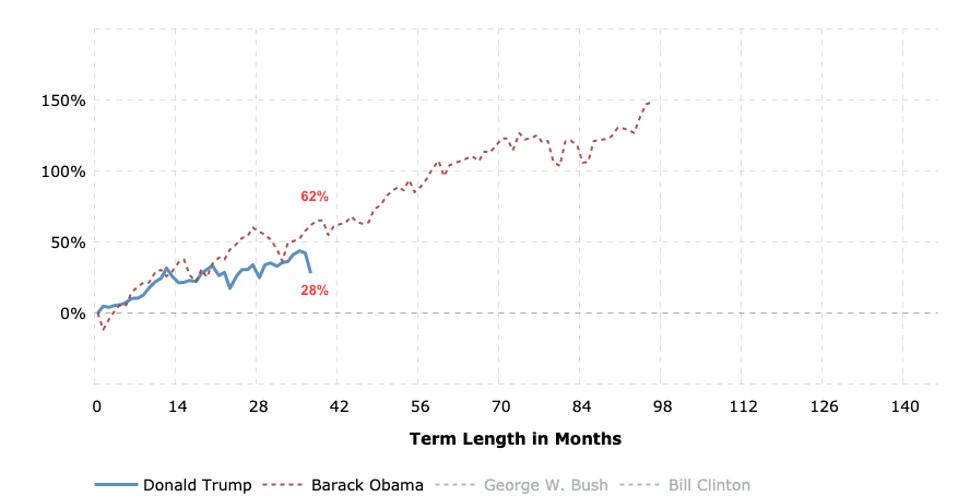
The first two start with inauguration dates. Since their respective inaugurations, the Dow is up 28% under Trump and over the same time frame it was up 62% under Obama. These figures are based on Thursday’s close before the Dow fell an additional 1.4%.
Trump vs. Obama’s Dow Industrials returns starting from their inauguration Macrotrends.net
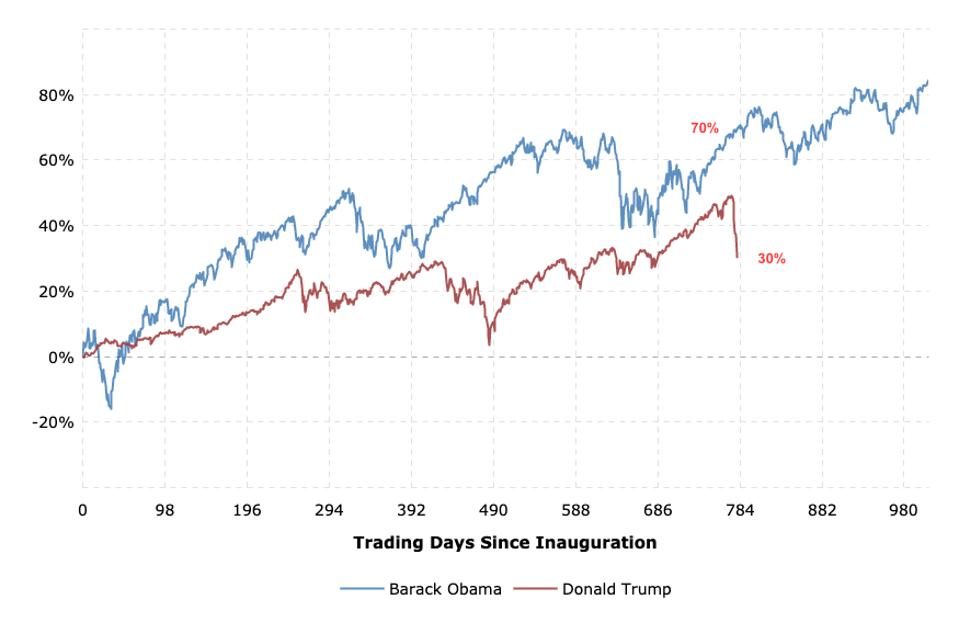
For the first three plus years since Trump’s inauguration the S&P 500 has risen 30% while under Obama it increased 70%.
Trump vs. Obama’s S&P 500 returns starting from their inauguration Macrotrends.net
The second set of charts start the analysis based on election dates and for Obama also from the low point of the stock market. The Dow has risen 39% since Trump’s election, while under Obama it increased 35% and 65% from the low point in February 2009.
Note that in the last 16 minutes of trading on Friday the Dow increased 643 points. If it had closed at that value Trump’s gain would have been 35%, matching Obama’s vs. being ahead by 4 percentage points.
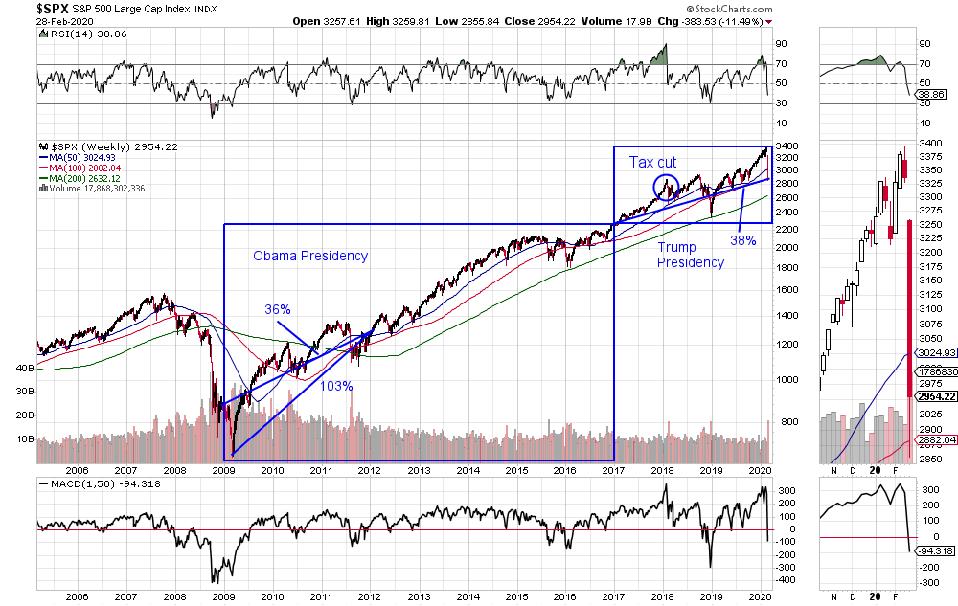
The Dow is in an extremely oversold position with its RSI, or Relative Strength Index, in the upper portion of the chart at 17.26. The Dow is due for a bounce but another technical indicator of it breaking below its 50, 100 and 200 day moving averages shows that there could be further downside.
Dow 30 Industrials price chart StockCharts.com
The S&P 500 has risen 38% under Trump since his election, while under Obama it rose 36% and 103% from the low point in March 2009. The S&P 500 is also oversold with an RSI of 38.86 but not nearly as much as the Dow. It also closed above its 100 day moving average, so from a technical perspective is not as “broken” as the Dow.
 Market Data
  Markets