


Wednesday, January 15, 2020 5:36:46 PM
Trump’s Numbers October 2019 Update
"Trump’s Numbers January 2019 Update"
Ignoring his tie, Trump still remains, though slowing GDP growth, in many ways a trendy guy, see ..
Att: ForReal, et al Trump boasts the economy is the best it's ever been. Here are 9 charts
showing how it's fared compared to the Obama and Bush presidencies.
https://investorshub.advfn.com/boards/read_msg.aspx?message_id=152240042
Statistical measures of how things have changed since the president took office.
By Brooks Jackson
Posted on October 11, 2019
Summary
Since President Donald Trump took office:
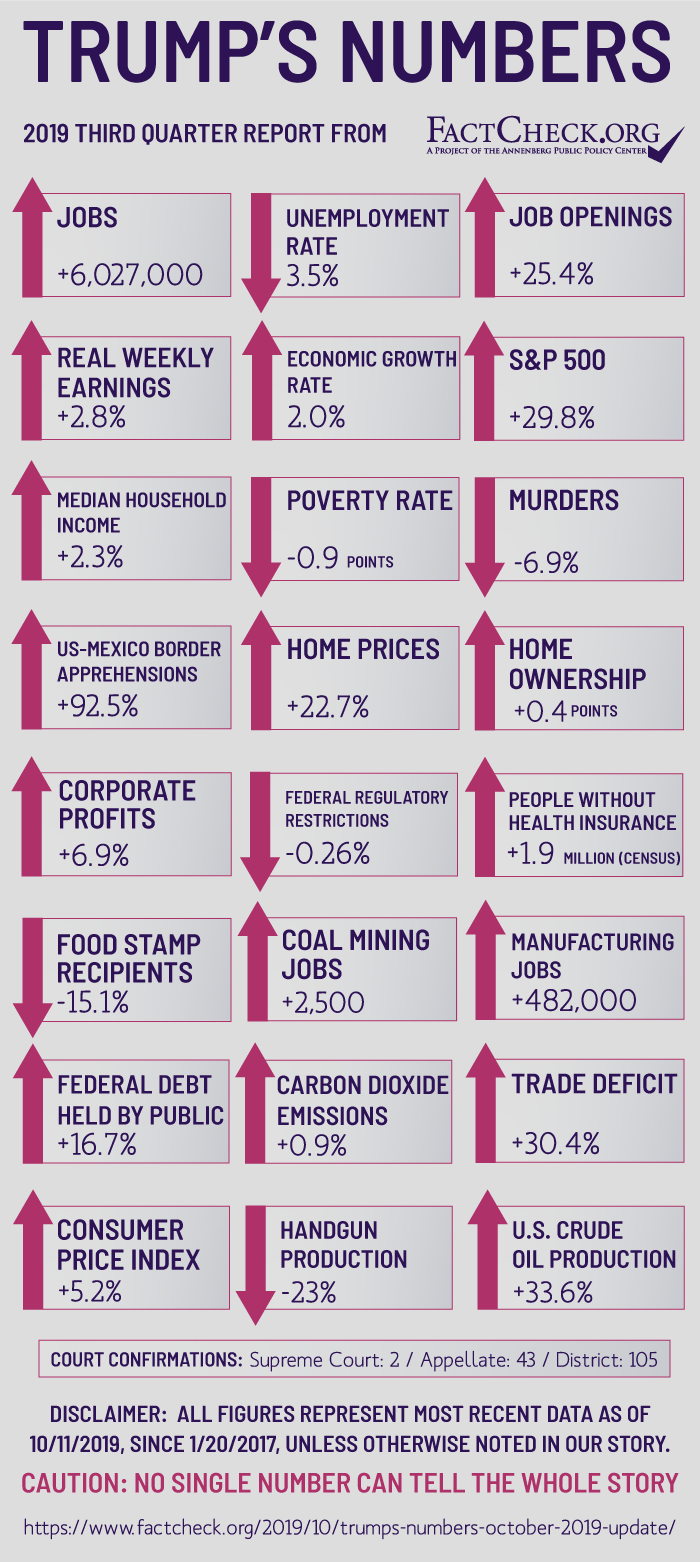
* The economy added 6 million jobs, and the unemployment rate dropped to the lowest level in nearly 50 years.
* Economic growth fell far short of the annual 4% to 6% Trump promised. The most recent rate is 2.0%.
* The federal debt went up more than $2.4 trillion. The annual deficit hit nearly $1 trillion in fiscal year 2019 – the highest since 2012.
* Median household income rose 2.3%. Average weekly paychecks rose 2.8%. The poverty rate and food stamp rolls declined.
* Stock prices rose: The S&P 500 index was up 29.8%. Single-family home prices rose nearly 23%, hitting a record level in June.
* The trade deficit — which Trump promised to reduce — went up 30%.
* The number of Americans lacking health insurance rose nearly 2 million.
* The number of murders dropped 6.9%. But the number of rapes went up.
* Illegal border crossings nearly doubled, as of the most recent 12 months on record.
* Trump has filled 43 seats on federal appeals courts, compared with 25 filled by Obama at the same point in his first term.
Analysis
With all links
This is our seventh quarterly update of the “Trump’s Numbers” scorecard that we posted in January 2018 and have updated every three months, most recently on July 12. We’ll publish additional updates every three months, as fresh statistics become available.
Here we’ve included statistics that may seem good or bad or just neutral, depending on the reader’s point of view. That’s the way we did it when we posted our first “Obama’s Numbers” article seven years ago — and in the quarterly updates and final summary .. https://www.factcheck.org/2017/09/obamas-final-numbers/ .. that followed. And we’ve maintained the same practice under Trump.
This update includes comprehensive looks at crime, income and poverty during the president’s first two years in office. The FBI’s report of crime rates for all of 2018 was released Sept. 30, and the Census Bureau’s figures for median annual household income, poverty levels and health insurance coverage during 2018 were released Sept. 10. Other statistics are released quarterly, monthly and sometimes daily, and we include here the most recent available as of this date.
Then as now, we make no judgment as to how much credit or blame any president deserves for things that happen during his time in office. Opinions differ on that.
Jobs and Unemployment
Job growth slowed a bit under Trump, but unemployment dropped to the lowest level in nearly half a century.
Employment — Total nonfarm employment grew by 6,027,000 since the president took office, according to the most recent figures available from the Bureau of Labor Statistics.
That continued an unbroken chain of monthly gains in total employment that started in October 2010. The economy has now added jobs for 108 consecutive months — just shy of nine years — including the first 32 months of the Trump administration.
The average monthly gain under Trump so far is 188,000 — compared with an average monthly gain of 217,000 during Obama’s second term. Trump is far behind the pace needed to fulfill his campaign boast that he will be “the greatest jobs president that God ever created .. https://www.youtube.com/watch?v=WmijVqQEpD8 .”
Unemployment — The unemployment rate, which was well below the historical norm when Trump took office, has continued to fall to the lowest rate in nearly half a century.
The Bureau of Labor Statistics now figures the rate was 4.7% when he was sworn in. The most recent rate, for September, fell to 3.5%. That’s the lowest since December 1969, nearly 50 years ago, when it was also 3.5%.
The jobless rate has been at or below 4% for the most recent 19 months — all under Trump. It hasn’t been that low for that long since a 50-month streak ending in January 1970.
The historical norm is 5.6%, which is the median monthly rate for all the months since the start of 1948.
Job Openings — One reason employment growth has slowed is a shortage of qualified workers .. https://www.wsj.com/articles/labor-shortage-may-imperil-growth-11568760707 .
The number of unfilled job openings hit more than 7.6 million in November and again in January, the highest in the 18 years the BLS has tracked this figure.
As of the last day of August, the most recent figure on record, it was nearly 7.1 million. That’s a gain of 1.4 million unfilled job openings — or 25.4% — since Trump took office.
In March of last year the number of job openings exceeded the number of unemployed people looking for work for the first time on record. And that’s been the case in every month since. In August, there were 1 million more job openings than there were people seeking jobs.
Labor Force Participation — Despite the abundance of jobs, the labor force participation rate — which went down 2.8 percentage points during the Obama years — is up slightly .. https://data.bls.gov/timeseries/LNS11300000 .. under Trump.
The labor force participation rate is the portion of the entire civilian population age 16 and older that is either employed or currently looking for work in the last four weeks. Republicans often criticized Obama for the decline .. https://www.factcheck.org/2015/03/declining-labor-participation-rates/ .. during his time, even though it was due mostly to the post-World War II baby boomers reaching retirement age, and other demographic factors beyond the control of any president.
Since Trump took office, the rate has fluctuated in a narrow range between 63.2% and 62.7%. It was at the high end of that range in September — 0.3 percentage points above where it was the month Trump took office.
Manufacturing Jobs — Manufacturing jobs increased under Trump, but the growth has stalled recently.
The number rose by 482,000 between Trump’s inauguration and September. That followed a net decrease of 193,000 under Obama.
But the early growth during Trump’s term has faded. At first, manufacturing jobs increased even faster than total employment. But Trump’s trade disputes and tariffs have taken a toll on the manufacturing sector .. https://www.usatoday.com/story/money/2019/10/01/recession-manufacturing-slump-tokes-downturn-fears/3832366002/ . During the first nine months of this year, the number of factory jobs rose 0.2%, while total employment rose four times as fast.
During all of Trump’s tenure, the grown in manufacturing jobs has been 3.9%, below the 4.1% growth for all jobs.
The number of manufacturing jobs is still 896,000 below where it was in December 2007, at the start of the Great Recession.
Economic Growth
The economy grew somewhat faster under Trump — but not at the rate he promised. Gross domestic product was growing at an annual rate of 2.0% during the second quarter .. https://www.bea.gov/news/2019/gross-domestic-product-2nd-quarter-2019-third-estimate-corporate-profits-2nd-quarter-2019 .. of this year, after going up 2.9% in 2018 and a revised 2.4% during his first year in office.
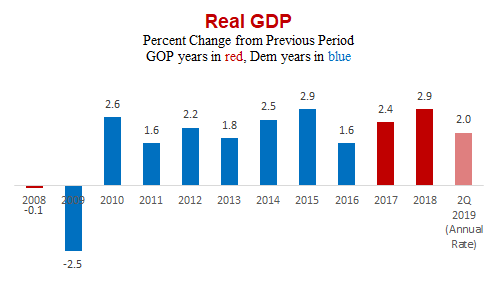
Since our last report, the Bureau of Economic Analysis has upwardly revised its estimate of growth in 2017 by 0.2 percentage points as part of its annual update, using newly available data to refine its GDP estimates for the previous five years. Even so, growth under Trump has averaged far less than the 4% to 6% per year that he promised repeatedly, both when he was a candidate and also as president .. https://www.realclearpolitics.com/video/2017/12/16/trump_were_going_to_see_economy_growth_of_4_5_and_maybe_6_percent.html . And economists say future growth rates will be nowhere close to what Trump once claimed he could bring about.
There’s little reason to think growth will improve. The “GDPNow” forecast .. https://www.frbatlanta.org/cqer/research/gdpnow.aspx .. produced by the Federal Reserve Bank of Atlanta projects that the third-quarter growth rate will come in at 1.7% based on several economic indicators that are already known.
Most economists believe this year’s growth will be less than last year’s. The nonpartisan Congressional Budget Office’s most recent economic outlook, issued Aug. 21, projects year-to-year growth .. https://www.cbo.gov/system/files/2019-01/51135-2019-01-economicprojections.xlsx .. of real GDP at 2.6% this year and 2.1% next year (see page 40).
A more recent median forecast of the Federal Reserve Board members and Federal Reserve Bank presidents, issued Sept. 18, projects 2.2% growth this year and 2.0% in 2020 (measured from fourth quarter to fourth quarter, rather than from year to year). That’s similar to the GDP forecasts offered by business and university economists to the Wall Street Journal’s monthly economic survey in September. Their average prediction was for only 2.2% annual growth this year and 1.7% next year.
The National Association for Business Economics’ October .. https://www.nabe.com/NABE/Surveys/Outlook_Surveys/October_2019_Outlook_Survey_Summary.aspx .. survey produced a median forecast of 2.3% year-to-year growth in 2019, and 1.8% in 2020.
Income and Poverty
Household Income — Household income rose briskly under Trump.
The Census Bureau’s measure of median household income reached $63,179, an increase of $1,400 from 2016 after adjusting for inflation.
In percentage terms, the increase during Trump’s first two years is 2.3%. (The median figure represents the midpoint — half of all households earned more, half less.)
The official figure is the highest ever recorded, exceeding previous records set in 2016 and 2017. But Census officials said those recent “records” are all due in part to a change in the survey questions in 2014. Starting then, the annual survey has picked up some sources of income that were previously missed.
Adjusting for that factor, and also for a change in the way Census processed data starting this year, Census officials published “estimated adjusted” figures .. https://www2.census.gov/library/stories/2019/09/income-data.xlsx .. showing what median household income would have been for past years, had the current questionnaire and processing procedures been in place. On that basis the latest figure is just a few dollars less than it was in 1999 — $63,231.
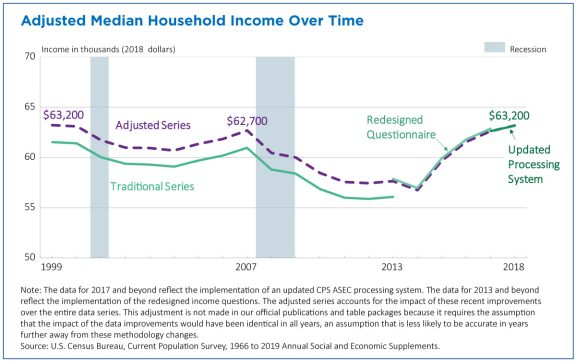
The “estimated adjusted” figures also show an even greater increase during Trump’s first two years than the official figures, because this year’s new data processing procedures had the effect of holding down income by a fraction of a percentage point. On an adjusted basis, the increase under Trump would be $1,638, or 2.7%.
Poverty — As incomes rose, the rate of poverty .. https://www2.census.gov/programs-surveys/cps/tables/time-series/historical-poverty-people/hstpov2.xls .. declined. The percentage of Americans living with income below the official poverty line went down to 11.8% of the population in 2018, the lowest level since 2001.
The poverty rate has now declined for four consecutive years, dropping by 1.3 percentage points in 2015, by 0.8 points in 2016 and by 0.4 points and 0.5 points in Trump’s first two years.
Regulations
https://www.factcheck.org/2019/10/trumps-numbers-october-2019-update/
"Trump’s Numbers January 2019 Update"
Ignoring his tie, Trump still remains, though slowing GDP growth, in many ways a trendy guy, see ..
Att: ForReal, et al Trump boasts the economy is the best it's ever been. Here are 9 charts
showing how it's fared compared to the Obama and Bush presidencies.
https://investorshub.advfn.com/boards/read_msg.aspx?message_id=152240042
Statistical measures of how things have changed since the president took office.
By Brooks Jackson
Posted on October 11, 2019
Summary
Since President Donald Trump took office:
* The economy added 6 million jobs, and the unemployment rate dropped to the lowest level in nearly 50 years.
* Economic growth fell far short of the annual 4% to 6% Trump promised. The most recent rate is 2.0%.
* The federal debt went up more than $2.4 trillion. The annual deficit hit nearly $1 trillion in fiscal year 2019 – the highest since 2012.
* Median household income rose 2.3%. Average weekly paychecks rose 2.8%. The poverty rate and food stamp rolls declined.
* Stock prices rose: The S&P 500 index was up 29.8%. Single-family home prices rose nearly 23%, hitting a record level in June.
* The trade deficit — which Trump promised to reduce — went up 30%.
* The number of Americans lacking health insurance rose nearly 2 million.
* The number of murders dropped 6.9%. But the number of rapes went up.
* Illegal border crossings nearly doubled, as of the most recent 12 months on record.
* Trump has filled 43 seats on federal appeals courts, compared with 25 filled by Obama at the same point in his first term.

Analysis
With all links
This is our seventh quarterly update of the “Trump’s Numbers” scorecard that we posted in January 2018 and have updated every three months, most recently on July 12. We’ll publish additional updates every three months, as fresh statistics become available.
Here we’ve included statistics that may seem good or bad or just neutral, depending on the reader’s point of view. That’s the way we did it when we posted our first “Obama’s Numbers” article seven years ago — and in the quarterly updates and final summary .. https://www.factcheck.org/2017/09/obamas-final-numbers/ .. that followed. And we’ve maintained the same practice under Trump.
This update includes comprehensive looks at crime, income and poverty during the president’s first two years in office. The FBI’s report of crime rates for all of 2018 was released Sept. 30, and the Census Bureau’s figures for median annual household income, poverty levels and health insurance coverage during 2018 were released Sept. 10. Other statistics are released quarterly, monthly and sometimes daily, and we include here the most recent available as of this date.
Then as now, we make no judgment as to how much credit or blame any president deserves for things that happen during his time in office. Opinions differ on that.
Jobs and Unemployment
Job growth slowed a bit under Trump, but unemployment dropped to the lowest level in nearly half a century.
Employment — Total nonfarm employment grew by 6,027,000 since the president took office, according to the most recent figures available from the Bureau of Labor Statistics.
That continued an unbroken chain of monthly gains in total employment that started in October 2010. The economy has now added jobs for 108 consecutive months — just shy of nine years — including the first 32 months of the Trump administration.
The average monthly gain under Trump so far is 188,000 — compared with an average monthly gain of 217,000 during Obama’s second term. Trump is far behind the pace needed to fulfill his campaign boast that he will be “the greatest jobs president that God ever created .. https://www.youtube.com/watch?v=WmijVqQEpD8 .”
Unemployment — The unemployment rate, which was well below the historical norm when Trump took office, has continued to fall to the lowest rate in nearly half a century.
The Bureau of Labor Statistics now figures the rate was 4.7% when he was sworn in. The most recent rate, for September, fell to 3.5%. That’s the lowest since December 1969, nearly 50 years ago, when it was also 3.5%.
The jobless rate has been at or below 4% for the most recent 19 months — all under Trump. It hasn’t been that low for that long since a 50-month streak ending in January 1970.
The historical norm is 5.6%, which is the median monthly rate for all the months since the start of 1948.
Job Openings — One reason employment growth has slowed is a shortage of qualified workers .. https://www.wsj.com/articles/labor-shortage-may-imperil-growth-11568760707 .
The number of unfilled job openings hit more than 7.6 million in November and again in January, the highest in the 18 years the BLS has tracked this figure.
As of the last day of August, the most recent figure on record, it was nearly 7.1 million. That’s a gain of 1.4 million unfilled job openings — or 25.4% — since Trump took office.
In March of last year the number of job openings exceeded the number of unemployed people looking for work for the first time on record. And that’s been the case in every month since. In August, there were 1 million more job openings than there were people seeking jobs.
Labor Force Participation — Despite the abundance of jobs, the labor force participation rate — which went down 2.8 percentage points during the Obama years — is up slightly .. https://data.bls.gov/timeseries/LNS11300000 .. under Trump.
The labor force participation rate is the portion of the entire civilian population age 16 and older that is either employed or currently looking for work in the last four weeks. Republicans often criticized Obama for the decline .. https://www.factcheck.org/2015/03/declining-labor-participation-rates/ .. during his time, even though it was due mostly to the post-World War II baby boomers reaching retirement age, and other demographic factors beyond the control of any president.
Since Trump took office, the rate has fluctuated in a narrow range between 63.2% and 62.7%. It was at the high end of that range in September — 0.3 percentage points above where it was the month Trump took office.
Manufacturing Jobs — Manufacturing jobs increased under Trump, but the growth has stalled recently.
The number rose by 482,000 between Trump’s inauguration and September. That followed a net decrease of 193,000 under Obama.
But the early growth during Trump’s term has faded. At first, manufacturing jobs increased even faster than total employment. But Trump’s trade disputes and tariffs have taken a toll on the manufacturing sector .. https://www.usatoday.com/story/money/2019/10/01/recession-manufacturing-slump-tokes-downturn-fears/3832366002/ . During the first nine months of this year, the number of factory jobs rose 0.2%, while total employment rose four times as fast.
During all of Trump’s tenure, the grown in manufacturing jobs has been 3.9%, below the 4.1% growth for all jobs.
The number of manufacturing jobs is still 896,000 below where it was in December 2007, at the start of the Great Recession.
Economic Growth
The economy grew somewhat faster under Trump — but not at the rate he promised. Gross domestic product was growing at an annual rate of 2.0% during the second quarter .. https://www.bea.gov/news/2019/gross-domestic-product-2nd-quarter-2019-third-estimate-corporate-profits-2nd-quarter-2019 .. of this year, after going up 2.9% in 2018 and a revised 2.4% during his first year in office.

Since our last report, the Bureau of Economic Analysis has upwardly revised its estimate of growth in 2017 by 0.2 percentage points as part of its annual update, using newly available data to refine its GDP estimates for the previous five years. Even so, growth under Trump has averaged far less than the 4% to 6% per year that he promised repeatedly, both when he was a candidate and also as president .. https://www.realclearpolitics.com/video/2017/12/16/trump_were_going_to_see_economy_growth_of_4_5_and_maybe_6_percent.html . And economists say future growth rates will be nowhere close to what Trump once claimed he could bring about.
There’s little reason to think growth will improve. The “GDPNow” forecast .. https://www.frbatlanta.org/cqer/research/gdpnow.aspx .. produced by the Federal Reserve Bank of Atlanta projects that the third-quarter growth rate will come in at 1.7% based on several economic indicators that are already known.
Most economists believe this year’s growth will be less than last year’s. The nonpartisan Congressional Budget Office’s most recent economic outlook, issued Aug. 21, projects year-to-year growth .. https://www.cbo.gov/system/files/2019-01/51135-2019-01-economicprojections.xlsx .. of real GDP at 2.6% this year and 2.1% next year (see page 40).
A more recent median forecast of the Federal Reserve Board members and Federal Reserve Bank presidents, issued Sept. 18, projects 2.2% growth this year and 2.0% in 2020 (measured from fourth quarter to fourth quarter, rather than from year to year). That’s similar to the GDP forecasts offered by business and university economists to the Wall Street Journal’s monthly economic survey in September. Their average prediction was for only 2.2% annual growth this year and 1.7% next year.
The National Association for Business Economics’ October .. https://www.nabe.com/NABE/Surveys/Outlook_Surveys/October_2019_Outlook_Survey_Summary.aspx .. survey produced a median forecast of 2.3% year-to-year growth in 2019, and 1.8% in 2020.
Income and Poverty
Household Income — Household income rose briskly under Trump.
The Census Bureau’s measure of median household income reached $63,179, an increase of $1,400 from 2016 after adjusting for inflation.
In percentage terms, the increase during Trump’s first two years is 2.3%. (The median figure represents the midpoint — half of all households earned more, half less.)
The official figure is the highest ever recorded, exceeding previous records set in 2016 and 2017. But Census officials said those recent “records” are all due in part to a change in the survey questions in 2014. Starting then, the annual survey has picked up some sources of income that were previously missed.
Adjusting for that factor, and also for a change in the way Census processed data starting this year, Census officials published “estimated adjusted” figures .. https://www2.census.gov/library/stories/2019/09/income-data.xlsx .. showing what median household income would have been for past years, had the current questionnaire and processing procedures been in place. On that basis the latest figure is just a few dollars less than it was in 1999 — $63,231.

The “estimated adjusted” figures also show an even greater increase during Trump’s first two years than the official figures, because this year’s new data processing procedures had the effect of holding down income by a fraction of a percentage point. On an adjusted basis, the increase under Trump would be $1,638, or 2.7%.
Poverty — As incomes rose, the rate of poverty .. https://www2.census.gov/programs-surveys/cps/tables/time-series/historical-poverty-people/hstpov2.xls .. declined. The percentage of Americans living with income below the official poverty line went down to 11.8% of the population in 2018, the lowest level since 2001.
The poverty rate has now declined for four consecutive years, dropping by 1.3 percentage points in 2015, by 0.8 points in 2016 and by 0.4 points and 0.5 points in Trump’s first two years.
Regulations
https://www.factcheck.org/2019/10/trumps-numbers-october-2019-update/
It was Plato who said, “He, O men, is the wisest, who like Socrates, knows that his wisdom is in truth worth nothing”
Discover What Traders Are Watching
Explore small cap ideas before they hit the headlines.


