


Sunday, January 05, 2020 4:50:33 PM
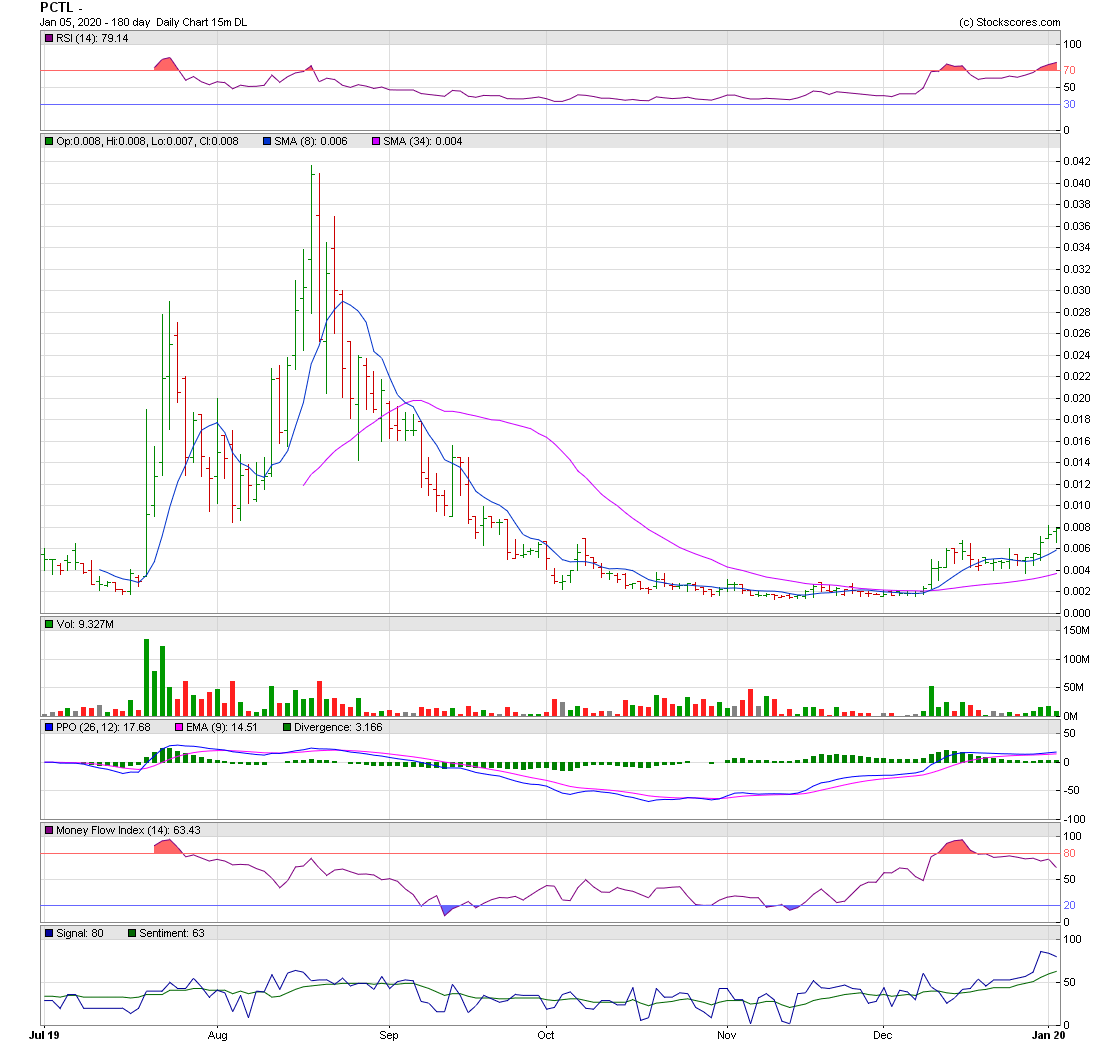
PCTL 0.0079 - Targets $0.021
How Targets are Calculated
Fibonacci Numbers and Retrace Targets: Explained

________________________________________________________________
Fibonacci Numbers
http://www.stockta.com/cgi-bin/school.pl?page=fib
Fibonacci Retracements
* Golden 61.8% Retracements
* Moderate 38.2% Retracements
* Common 38.2% Retracements
Fibonacci Retracements
http://stockcharts.com/school/doku.php?id=chart_school:chart_analysis:fibonacci_retracemen
________________________________________________________________
Fibonacci Numbers
are commonly used in Technical Analysis
with or without a knowledge of Elliot Wave Analysis
to determine potential support, resistance,
and price objectives.
The most popular Fibonacci Retracements are
61.8% and 38.2%
61.8% retracements
imply a new trend is establishing itself.
38.2% retracements
usually imply that the prior trend will continue
38.2% retracements
are considered natural retracements in a healthy trend.
Fibonacci Retracements
can be applied after a decline
to forecast the length of a counter-trend bounce.
________________________________________________________________
The 50% retracement is not based on a Fibonacci number.
Instead, this number stems from Dow Theory's assertion
that the Averages often retrace half their prior move.
50% retracement
implies indecision.
________________________________________________________________

________________________________________________________________
Buy after an Elliott Wave 5-Wave Decline
________________________________________________________________
The Elliott Wave 5-Waves Sequence
A Basic "A,B,C Corrective Wave"
https://www.metatrader5.com/en/terminal/help/objects/elliott/elliott_theory
________________________________________________________________


Elliott Wave Basics
http://www.acrotec.com/ewt.htm
Elliott Wave Theory
http://ta.mql4.com/elliott_wave_theory
Buy after an Elliott Wave,
5-Wave decline sequence !
A Basic "A,B,C Corrective Wave"
Buy, ONLY when the stocks price,
is trading under the Blue 8-day M.A.
when the Blue 8-day M.A. is under the Red 34-day M.A.
________________________________________________________________

_________________________________________________________________

________________________________________________________________
Embedded Chart
Buy, ONLY when the stocks price,
is trading under the Blue 8-day M.A.
when the Blue 8-day M.A. is under the Red 34-day M.A.
________________________________________________________________
Live! Charts
Buy, ONLY when the stocks price,
is trading under the Blue 8-day M.A.
when the Blue 8-day M.A. is under the Red 34-day M.A.

________________________________________________________________
Buy, ONLY when the stocks price,
is trading under the Blue 8-day M.A.
when the Blue 8-day M.A. is under the Red 34-day M.A.

________________________________________________________________
Buy, ONLY when the stocks price,
is trading under the Blue 8-day M.A.
when the Blue 8-day M.A. is under the Red 34-day M.A.


How Targets are Calculated
Fibonacci Numbers and Retrace Targets: Explained

________________________________________________________________
Fibonacci Numbers
http://www.stockta.com/cgi-bin/school.pl?page=fib
Fibonacci Retracements
* Golden 61.8% Retracements
* Moderate 38.2% Retracements
* Common 38.2% Retracements
Fibonacci Retracements
http://stockcharts.com/school/doku.php?id=chart_school:chart_analysis:fibonacci_retracemen
________________________________________________________________
Fibonacci Numbers
are commonly used in Technical Analysis
with or without a knowledge of Elliot Wave Analysis
to determine potential support, resistance,
and price objectives.
The most popular Fibonacci Retracements are
61.8% and 38.2%
61.8% retracements
imply a new trend is establishing itself.
38.2% retracements
usually imply that the prior trend will continue
38.2% retracements
are considered natural retracements in a healthy trend.
Fibonacci Retracements
can be applied after a decline
to forecast the length of a counter-trend bounce.
________________________________________________________________
The 50% retracement is not based on a Fibonacci number.
Instead, this number stems from Dow Theory's assertion
that the Averages often retrace half their prior move.
50% retracement
implies indecision.
________________________________________________________________

________________________________________________________________
Buy after an Elliott Wave 5-Wave Decline
________________________________________________________________
The Elliott Wave 5-Waves Sequence
A Basic "A,B,C Corrective Wave"
https://www.metatrader5.com/en/terminal/help/objects/elliott/elliott_theory
________________________________________________________________


Elliott Wave Basics
http://www.acrotec.com/ewt.htm
Elliott Wave Theory
http://ta.mql4.com/elliott_wave_theory
Buy after an Elliott Wave,
5-Wave decline sequence !
A Basic "A,B,C Corrective Wave"
Buy, ONLY when the stocks price,
is trading under the Blue 8-day M.A.
when the Blue 8-day M.A. is under the Red 34-day M.A.
________________________________________________________________

_________________________________________________________________

________________________________________________________________
Embedded Chart
Buy, ONLY when the stocks price,
is trading under the Blue 8-day M.A.
when the Blue 8-day M.A. is under the Red 34-day M.A.

________________________________________________________________
Live! Charts
Buy, ONLY when the stocks price,
is trading under the Blue 8-day M.A.
when the Blue 8-day M.A. is under the Red 34-day M.A.
________________________________________________________________
Buy, ONLY when the stocks price,
is trading under the Blue 8-day M.A.
when the Blue 8-day M.A. is under the Red 34-day M.A.
________________________________________________________________
Buy, ONLY when the stocks price,
is trading under the Blue 8-day M.A.
when the Blue 8-day M.A. is under the Red 34-day M.A.


