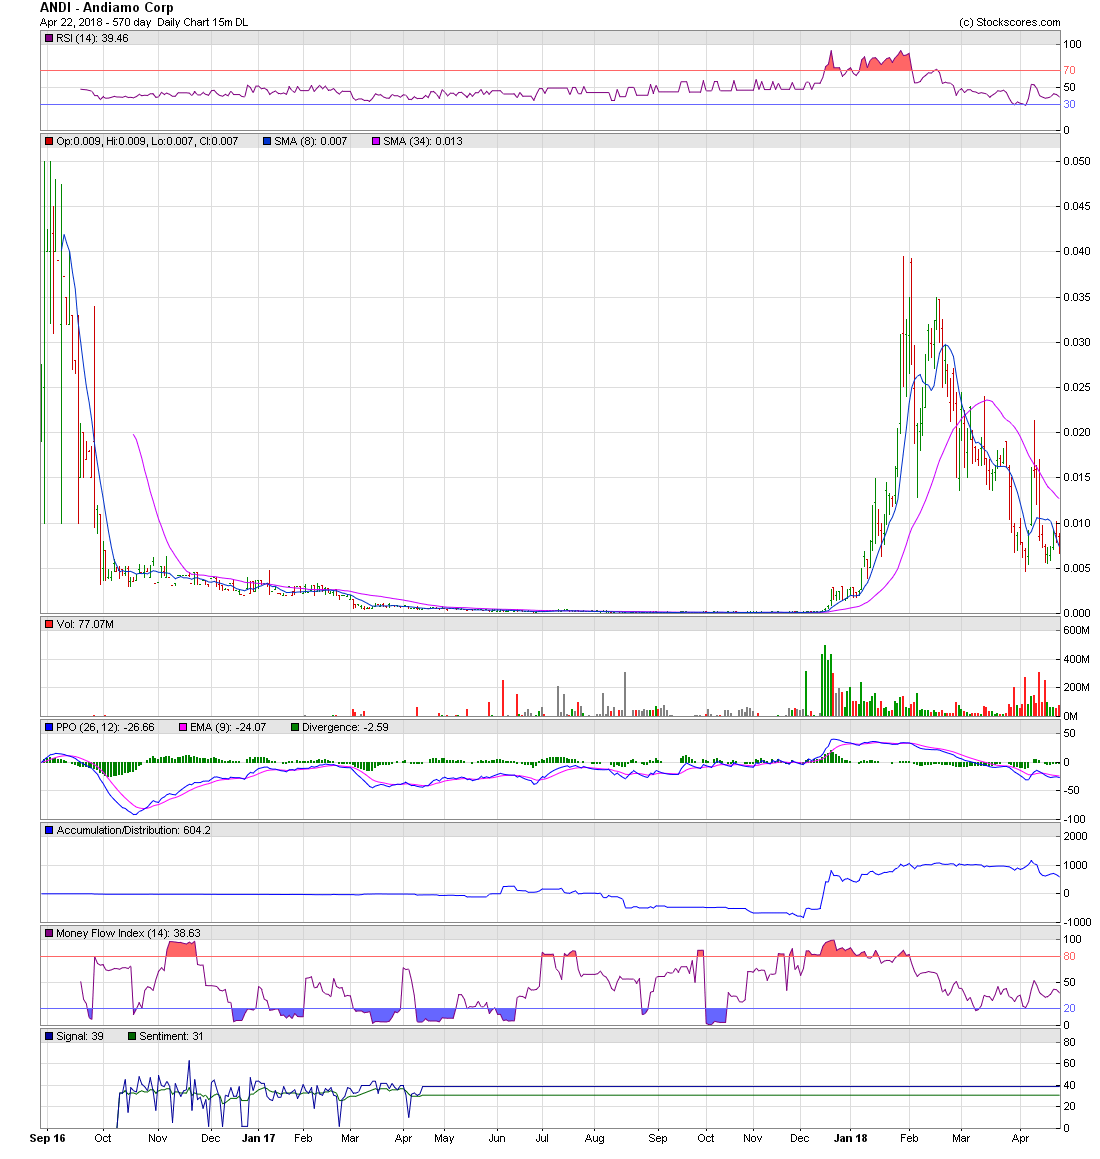
QEDN - ANDI - Bringing Products to Market https://investorshub.advfn.com/uicon/155361.png?cb=636954666482470000 _________________________________________________________________ ANDI Security Details Share Structure Market Value1...........$171,094 a/o Oct 27, 2017 Authorized Shares..6,000,000,000 a/o Jun 15, 2017 Outstanding Shares 1,710,940,000 a/o Aug 30, 2017 Float.............. 1,100,940,000 a/o Aug 30, 2017 Par Value 0.00001 https://www.otcmarkets.com/stock/ANDI/security QEDN Security Details Share Structure Market Value1...........$546,790 a/o Jul 30, 2019 Authorized Shares..3,000,000,000 a/o Nov 01, 2017 Outstanding Shares 1,822,632,434 a/o Nov 01, 2017 -Restricted.....…........69,887,042 a/o Nov 01, 2017 -Unrestricted.........1,752,745,392 a/o Nov 01, 2017 Float................ 688,232,011 a/o Mar 09, 2017 Par Value 0.001 https://www.incaworldwide.com/blog/author/Kate--Bahnsen https://www.otcmarkets.com/stock/QEDN/security https://otcshortreport.com/company/QEDN http://www.buyins.net/tools/symbol_stats.php?sym=QEDN https://www.stockscores.com/charts/charts/?ticker=QEDN http://www.investorpoint.com/stock/QEDN-QED%20Connect%20Inc/ ________________________________________________________________ Authorized Shares, has No Bearing on the price . The Shares Authorized, is not used in any fundamental of financial calculation, to determine company value . _________________________________________________________________ Embedded Chart https://investorshub.advfn.com/uimage/uploads/2018/4/22/qnqpfANDI_Apr_22_Chart_1.png ________________________________________________ Live! Chart https://www.stockscores.com/chart.asp?TickerSymbol=QEDN&TimeRange=720&Interval=d&Volume=1&ChartType=OHLC&Stockscores=1&ChartWidth=1100&ChartHeight=480&LogScale=None&Band=None&avgType1=SMA&movAvg1=8&avgType2=SMA&movAvg2=34&Indicator1=RSI&Indicator2=PPO&Indicator3=AccDist&Indicator4=MFI&endDate=&CompareWith=&entryPrice=&stopLossPrice= ________________________________________________________________ https://investorshub.advfn.com/uimage/uploads/2018/4/22/qnqpfANDI_Apr_22_Chart_1.png ________________________________________________ https://www.stockscores.com/chart.asp?TickerSymbol=QEDN&TimeRange=1095&Interval=d&Volume=1&ChartType=OHLC&Stockscores=1&ChartWidth=1100&ChartHeight=480&LogScale=None&Band=None&avgType1=SMA&movAvg1=8&avgType2=SMA&movAvg2=34&Indicator1=RSI&Indicator2=PPO&Indicator3=AccDist&Indicator4=MFI&endDate=&CompareWith=&entryPrice=&stopLossPrice= _______________________________________________________________ Embedded Chart https://investorshub.advfn.com/uimage/uploads/2018/4/22/qnqpfANDI_Apr_22_Chart_1.png Live! Chart https://www.stockscores.com/chart.asp?TickerSymbol=QEDN&TimeRange=1825&Interval=d&Volume=1&ChartType=OHLC&Stockscores=1&ChartWidth=1100&ChartHeight=480&LogScale=None&Band=None&avgType1=SMA&movAvg1=8&avgType2=SMA&movAvg2=34&Indicator1=RSI&Indicator2=PPO&Indicator3=AccDist&Indicator4=MFI&endDate=&CompareWith=&entryPrice=&stopLossPrice= ________________________________________________________________ Embedded Chart https://investorshub.advfn.com/uimage/uploads/2018/4/22/qnqpfANDI_Apr_22_Chart_1.png Live! Chart https://www.stockscores.com/chart.asp?TickerSymbol=QEDN&TimeRange=2555&Interval=d&Volume=1&ChartType=OHLC&Stockscores=1&ChartWidth=1100&ChartHeight=480&LogScale=None&Band=None&avgType1=SMA&movAvg1=8&avgType2=SMA&movAvg2=34&Indicator1=RSI&Indicator2=PPO&Indicator3=AccDist&Indicator4=MFI&endDate=&CompareWith=&entryPrice=&stopLossPrice= ________________________________________________________________ Embedded Chart https://investorshub.advfn.com/uimage/uploads/2018/4/22/qnqpfANDI_Apr_22_Chart_1.png Live! Chart https://www.stockscores.com/chart.asp?TickerSymbol=QEDN&TimeRange=2920&Interval=d&Volume=1&ChartType=OHLC&Stockscores=1&ChartWidth=1100&ChartHeight=480&LogScale=None&Band=None&avgType1=SMA&movAvg1=8&avgType2=SMA&movAvg2=34&Indicator1=RSI&Indicator2=PPO&Indicator3=AccDist&Indicator4=MFI&endDate=&CompareWith=&entryPrice=&stopLossPrice= ________________________________________________________________ Live! Charts https://www.stockscores.com/chart.asp?TickerSymbol=ANDI&TimeRange=1050&Interval=d&Volume=1&ChartType=OHLC&Stockscores=1&ChartWidth=1100&ChartHeight=480&LogScale=None&Band=None&avgType1=SMA&movAvg1=8&avgType2=SMA&movAvg2=34&Indicator1=RSI&Indicator2=PPO&Indicator3=AccDist&Indicator4=MFI&endDate=&CompareWith=&entryPrice=&stopLossPrice= https://www.stockscores.com/chart.asp?TickerSymbol=QEDN&TimeRange=2555&Interval=d&Volume=1&ChartType=OHLC&Stockscores=1&ChartWidth=1100&ChartHeight=480&LogScale=None&Band=None&avgType1=SMA&movAvg1=8&avgType2=SMA&movAvg2=34&Indicator1=RSI&Indicator2=PPO&Indicator3=AccDist&Indicator4=MFI&endDate=&CompareWith=&entryPrice=&stopLossPrice= ________________________________________________________________ Live! Charts https://www.stockscores.com/chart.asp?TickerSymbol=ANDI&TimeRange=1050&Interval=d&Volume=1&ChartType=OHLC&Stockscores=1&ChartWidth=1100&ChartHeight=480&LogScale=None&Band=None&avgType1=SMA&movAvg1=8&avgType2=SMA&movAvg2=34&Indicator1=RSI&Indicator2=PPO&Indicator3=AccDist&Indicator4=MFI&endDate=&CompareWith=&entryPrice=&stopLossPrice= https://www.stockscores.com/chart.asp?TickerSymbol=QEDN&TimeRange=2920&Interval=d&Volume=1&ChartType=OHLC&Stockscores=1&ChartWidth=1100&ChartHeight=480&LogScale=None&Band=None&avgType1=SMA&movAvg1=8&avgType2=SMA&movAvg2=34&Indicator1=RSI&Indicator2=PPO&Indicator3=AccDist&Indicator4=MFI&endDate=&CompareWith=&entryPrice=&stopLossPrice= _______________________________________________________________ https://www.stockscores.com/charts/charts/?ticker=ANDI https://www.stockscores.com/charts/charts/?ticker=QEDN https://investorshub.advfn.com/uicon/155361.png?cb=636954666482470000
 Market Data
  Markets