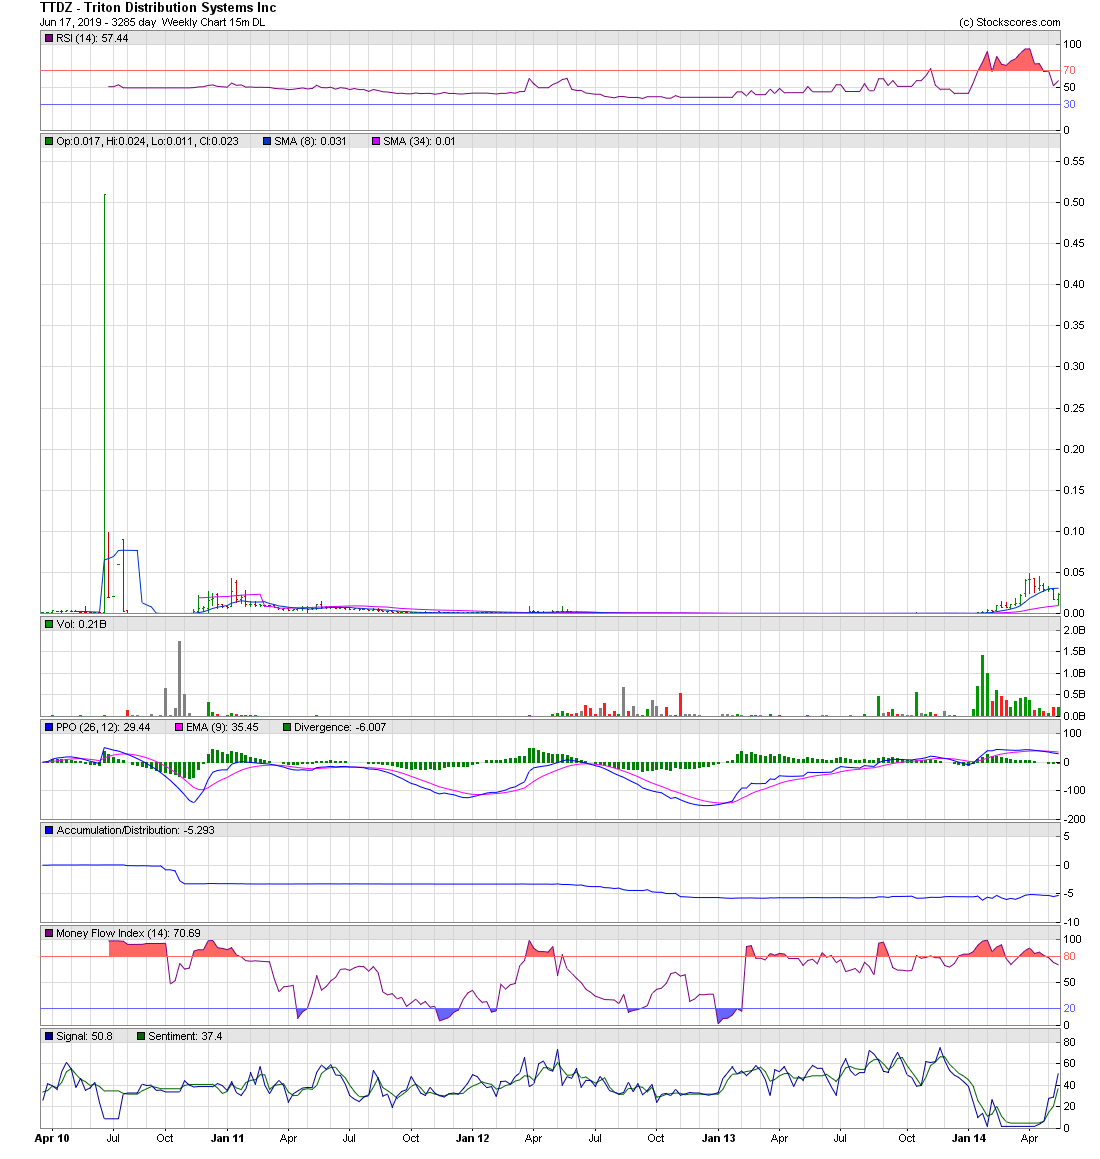
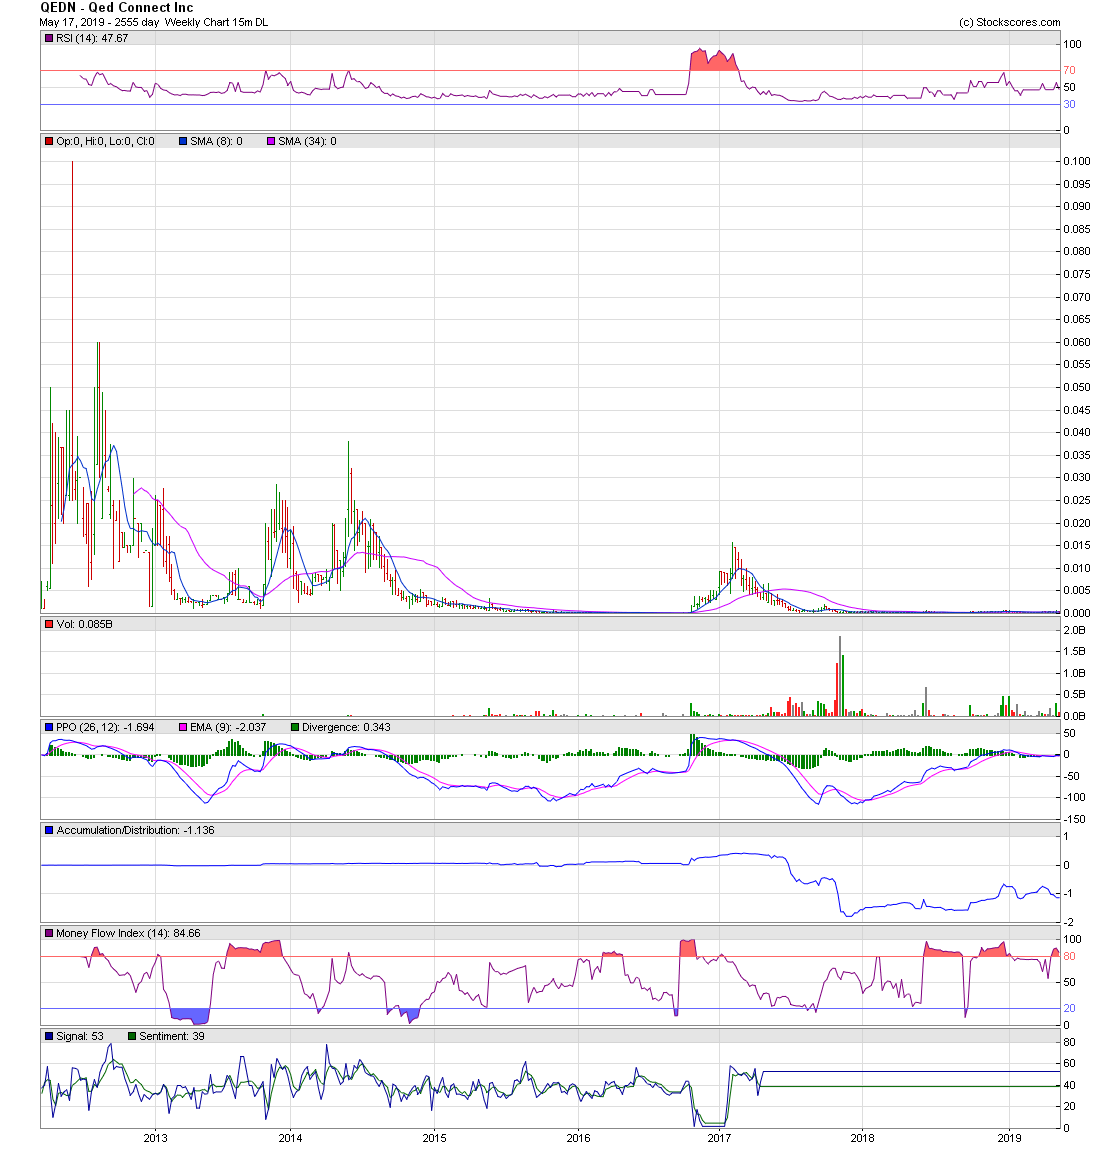
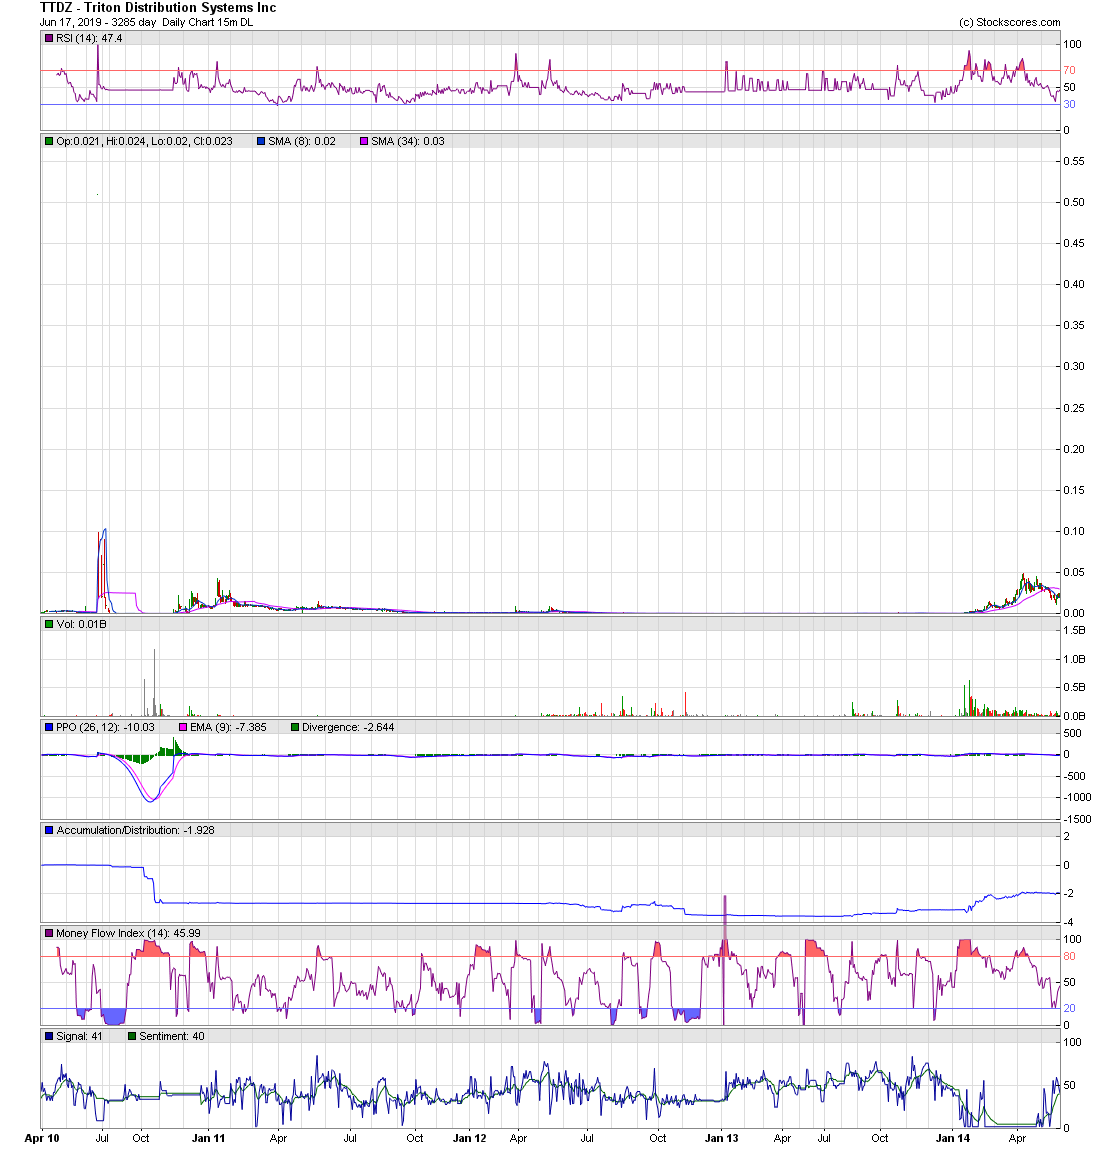
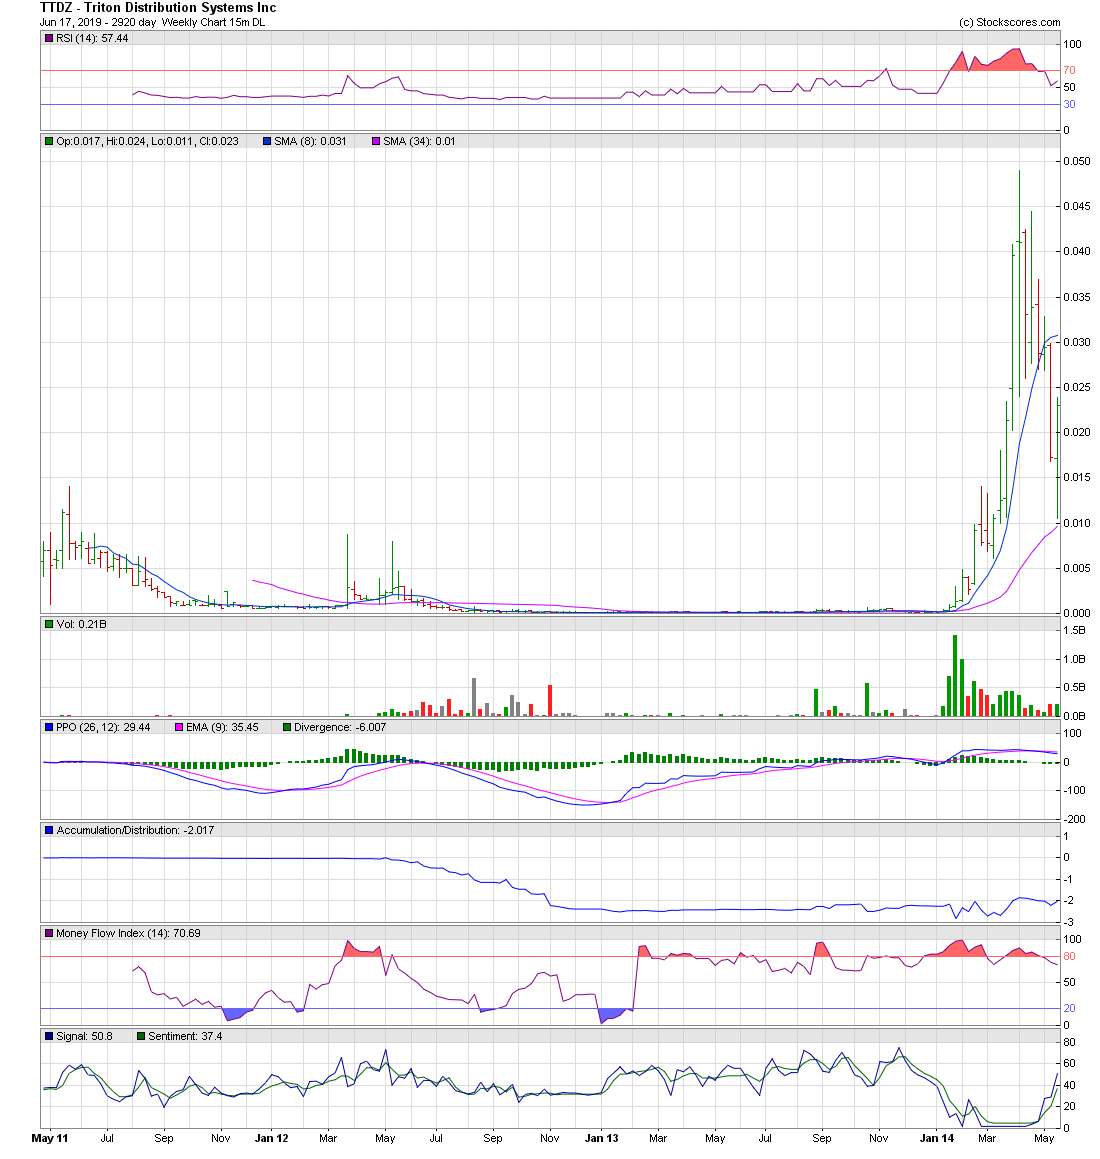
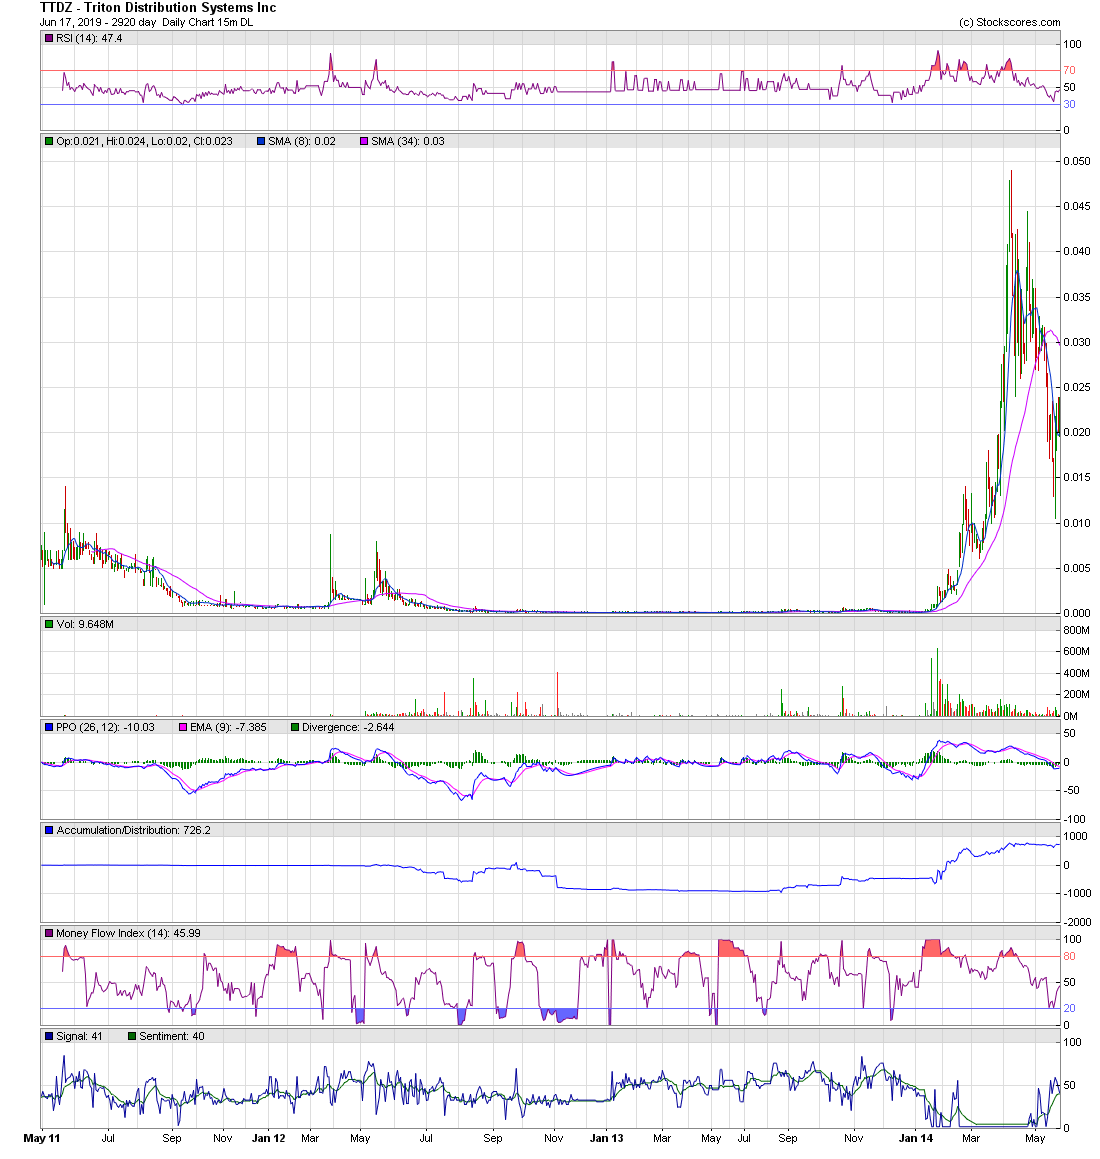
QEDN - TTDZ - Comparison Analysis https://investorshub.advfn.com/uicon/155361.png?cb=636776145039370000 _____________________________________________________________ QEDN Security Details Share Structure Market Value1...........$729,053 a/o Jun 07, 2019 Authorized Shares..3,000,000,000 a/o Nov 01, 2017 Outstanding Shares 1,822,632,434 a/o Nov 01, 2017 -Restricted.....…........69,887,042 a/o Nov 01, 2017 -Unrestricted.........1,752,745,392 a/o Nov 01, 2017 Float................ 688,232,011 a/o Mar 09, 2017 Par Value 0.001 https://www.incaworldwide.com/blog/author/Kate--Bahnsen https://www.otcmarkets.com/stock/QEDN/security https://otcshortreport.com/company/QEDN http://www.buyins.net/tools/symbol_stats.php?sym=QEDN https://www.stockscores.com/charts/charts/?ticker=QEDN http://www.investorpoint.com/stock/QEDN-QED%20Connect%20Inc/ ________________________________________________________________ TTDZ Security Details Share Structure Market Value1...........$ a/o Sep 30, 2013 Authorized Shares..2,000,000,000 a/o Sep 30, 2013 Outstanding Shares 1,743,695,597 a/o Sep 30, 2013 -Restricted.....…....Not Available -Unrestricted........Not Available -Held at DTC.........Not Available Float.............. 1,531,010,602 a/o Sep 30, 2013 Par Value 0.0001 Authorized Shares, has No Bearing on the price . The Shares Authorized, is not used in any fundamental of financial calculation, to determine company value . ________________________________________________________________ https://investorshub.advfn.com/uicon/155361.png?cb=636360310707230000 Buy after an Elliott Wave 5-Wave Decline https://investorshub.advfn.com/boards/read_msg.aspx?message_id=147897807 ________________________________________________________________ The Elliott Wave 5-Waves Sequence A Basic "A,B,C Corrective Wave" https://www.metatrader5.com/en/terminal/help/objects/elliott/elliott_theory ________________________________________________________________ https://investorshub.advfn.com/uimage/uploads/2017/2/16/vvrclElliott_Wave_Decline_8_Wave.png https://investorshub.advfn.com/uimage/uploads/2017/2/16/hgymrElliott_Wave_Chart.png Elliott Wave Basics http://www.acrotec.com/ewt.htm Elliott Wave Theory http://ta.mql4.com/elliott_wave_theory Buy after an Elliott Wave, 5-Wave decline sequence ! A Basic "A,B,C Corrective Wave" Buy, ONLY when the stocks price, is trading under the Blue 8-day M.A. when the Blue 8-day M.A. is under the Red 34-day M.A . ________________________________________________________________ Embedded Chart https://investorshub.advfn.com/uimage/uploads/2014/4/18/urvayTTDZ_Chart_5_from_0.0001_to_0.049.png _______________________________________________________________ Embedded Charts https://investorshub.advfn.com/uimage/uploads/2019/6/17/qekuqTTDZ_Jun_17_Chart_3285_day_Weekly.png investorshub.advfn.com/uimage/uploads/2019/5/17/dylznQEDN_May_17_Chart_2555_day_Weekly.png _______________________________________________________________ Embedded Charts https://investorshub.advfn.com/uimage/uploads/2019/6/17/fyeqsTTDZ_Jun_17_Chart_3285_day_Daily.png investorshub.advfn.com/uimage/uploads/2019/6/17/awqrjQEDN_Jun_17_Chart_2555_day_Daily.png ______________________________________________________________ Embedded Charts https://investorshub.advfn.com/uimage/uploads/2019/6/17/gexkbTTDZ_Jun_17_Chart_2920_day_Weekly.png investorshub.advfn.com/uimage/uploads/2019/5/17/dylznQEDN_May_17_Chart_2555_day_Weekly.png ________________________________________________________________ Embedded Chart https://investorshub.advfn.com/uimage/uploads/2019/6/17/gexkbTTDZ_Jun_17_Chart_2920_day_Weekly.png Live! Chart https://www.stockscores.com/chart.asp?TickerSymbol=QEDN&TimeRange=2555&Interval=w&Volume=1&ChartType=OHLC&Stockscores=1&ChartWidth=1100&ChartHeight=480&LogScale=None&Band=None&avgType1=SMA&movAvg1=8&avgType2=SMA&movAvg2=34&Indicator1=RSI&Indicator2=PPO&Indicator3=AccDist&Indicator4=MFI&endDate=&CompareWith=&entryPrice=&stopLossPrice= ________________________________________________________________ https://investorshub.advfn.com/uicon/155361.png?cb=636776145039370000 Embedded Chart https://investorshub.advfn.com/uimage/uploads/2019/6/17/gexkbTTDZ_Jun_17_Chart_2920_day_Weekly.png Live! Chart https://www.stockscores.com/chart.asp?TickerSymbol=QEDN&TimeRange=1825&Interval=w&Volume=1&ChartType=OHLC&Stockscores=1&ChartWidth=1100&ChartHeight=480&LogScale=None&Band=None&avgType1=SMA&movAvg1=8&avgType2=SMA&movAvg2=34&Indicator1=RSI&Indicator2=PPO&Indicator3=AccDist&Indicator4=MFI&endDate=&CompareWith=&entryPrice=&stopLossPrice= _______________________________________________________________ https://investorshub.advfn.com/uicon/155361.png?cb=636776145039370000 Embedded Chart https://investorshub.advfn.com/uimage/uploads/2019/6/17/gexkbTTDZ_Jun_17_Chart_2920_day_Weekly.png Live! Chart https://www.stockscores.com/chart.asp?TickerSymbol=QEDN&TimeRange=720&Interval=w&Volume=1&ChartType=OHLC&Stockscores=1&ChartWidth=1100&ChartHeight=480&LogScale=None&Band=None&avgType1=SMA&movAvg1=8&avgType2=SMA&movAvg2=34&Indicator1=RSI&Indicator2=PPO&Indicator3=AccDist&Indicator4=MFI&endDate=&CompareWith=&entryPrice=&stopLossPrice= ________________________________________________________________ https://investorshub.advfn.com/uicon/155361.png?cb=636776145039370000 Embedded Chart https://investorshub.advfn.com/uimage/uploads/2019/6/17/gexkbTTDZ_Jun_17_Chart_2920_day_Weekly.png Live! Chart https://www.stockscores.com/chart.asp?TickerSymbol=QEDN&TimeRange=365&Interval=w&Volume=1&ChartType=OHLC&Stockscores=1&ChartWidth=1100&ChartHeight=480&LogScale=None&Band=None&avgType1=SMA&movAvg1=8&avgType2=SMA&movAvg2=34&Indicator1=RSI&Indicator2=PPO&Indicator3=AccDist&Indicator4=MFI&endDate=&CompareWith=&entryPrice=&stopLossPrice= ________________________________________________________________ https://investorshub.advfn.com/uicon/155361.png?cb=636776145039370000 Embedded Chart https://investorshub.advfn.com/uimage/uploads/2019/6/17/ixdwiTTDZ_Jun_17_Chart_2920_day_Daily.png Live! Chart https://www.stockscores.com/chart.asp?TickerSymbol=QEDN&TimeRange=1095&Interval=d&Volume=1&ChartType=OHLC&Stockscores=1&ChartWidth=1100&ChartHeight=480&LogScale=None&Band=None&avgType1=SMA&movAvg1=8&avgType2=SMA&movAvg2=34&Indicator1=RSI&Indicator2=PPO&Indicator3=AccDist&Indicator4=MFI&endDate=&CompareWith=&entryPrice=&stopLossPrice= ________________________________________________________________ https://investorshub.advfn.com/uicon/155361.png?cb=636776145039370000 Embedded Chart https://investorshub.advfn.com/uimage/uploads/2019/6/17/ixdwiTTDZ_Jun_17_Chart_2920_day_Daily.png Live! Chart https://www.stockscores.com/chart.asp?TickerSymbol=QEDN&TimeRange=720&Interval=d&Volume=1&ChartType=OHLC&Stockscores=1&ChartWidth=1100&ChartHeight=480&LogScale=None&Band=None&avgType1=SMA&movAvg1=8&avgType2=SMA&movAvg2=34&Indicator1=RSI&Indicator2=PPO&Indicator3=AccDist&Indicator4=MFI&endDate=&CompareWith=&entryPrice=&stopLossPrice= ________________________________________________________________ https://investorshub.advfn.com/uicon/155361.png?cb=636776145039370000 Embedded Chart https://investorshub.advfn.com/uimage/uploads/2019/6/17/ixdwiTTDZ_Jun_17_Chart_2920_day_Daily.png Live! Chart https://www.stockscores.com/chart.asp?TickerSymbol=QEDN&TimeRange=365&Interval=d&Volume=1&ChartType=OHLC&Stockscores=1&ChartWidth=1100&ChartHeight=480&LogScale=None&Band=None&avgType1=SMA&movAvg1=8&avgType2=SMA&movAvg2=34&Indicator1=RSI&Indicator2=PPO&Indicator3=AccDist&Indicator4=MFI&endDate=&CompareWith=&entryPrice=&stopLossPrice= https://investorshub.advfn.com/uicon/155361.png?cb=636776145039370000
 Market Data
  Markets