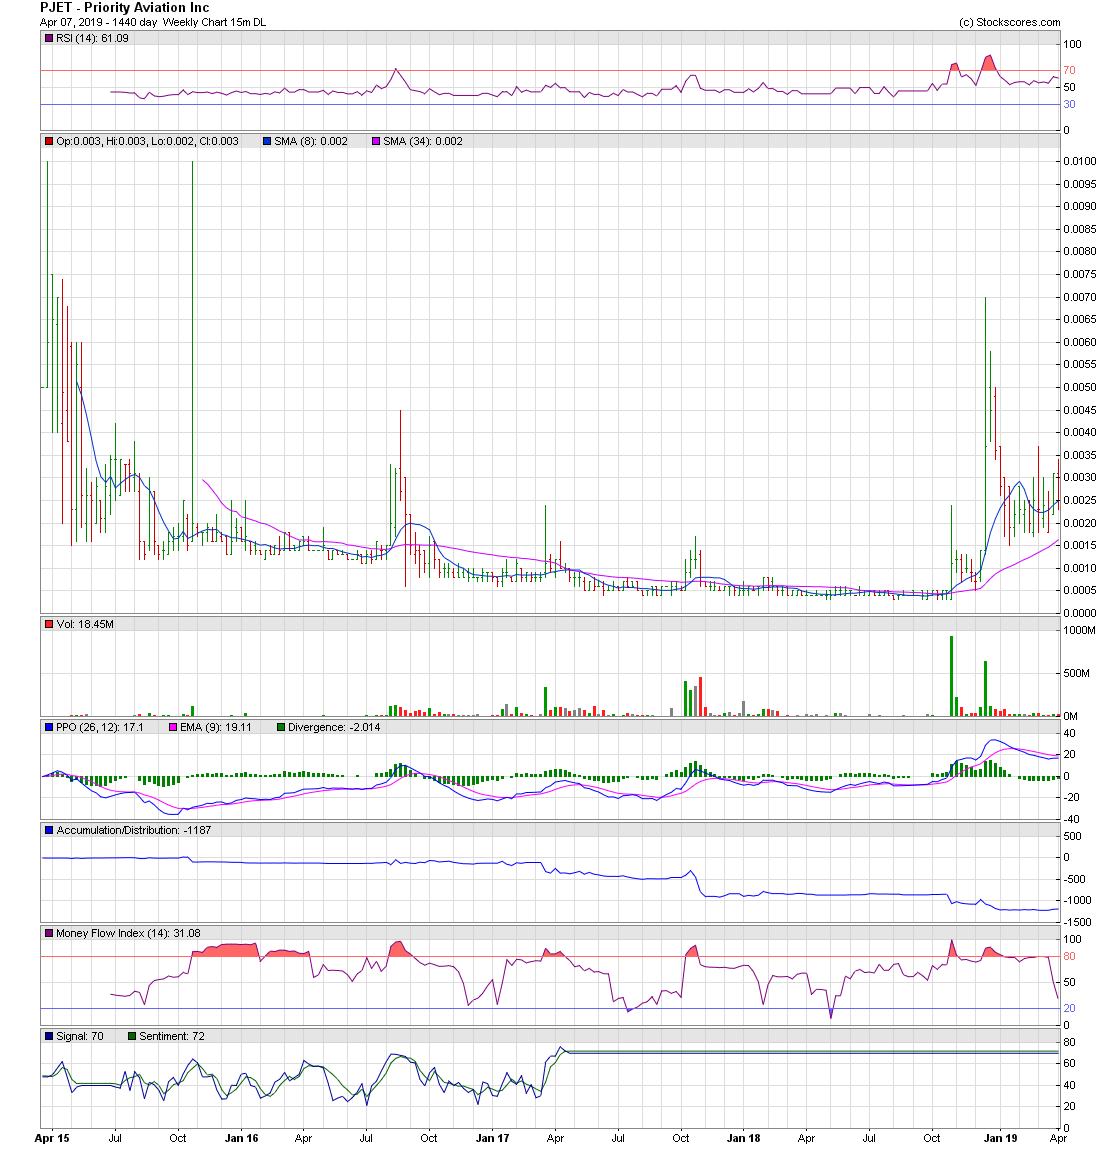
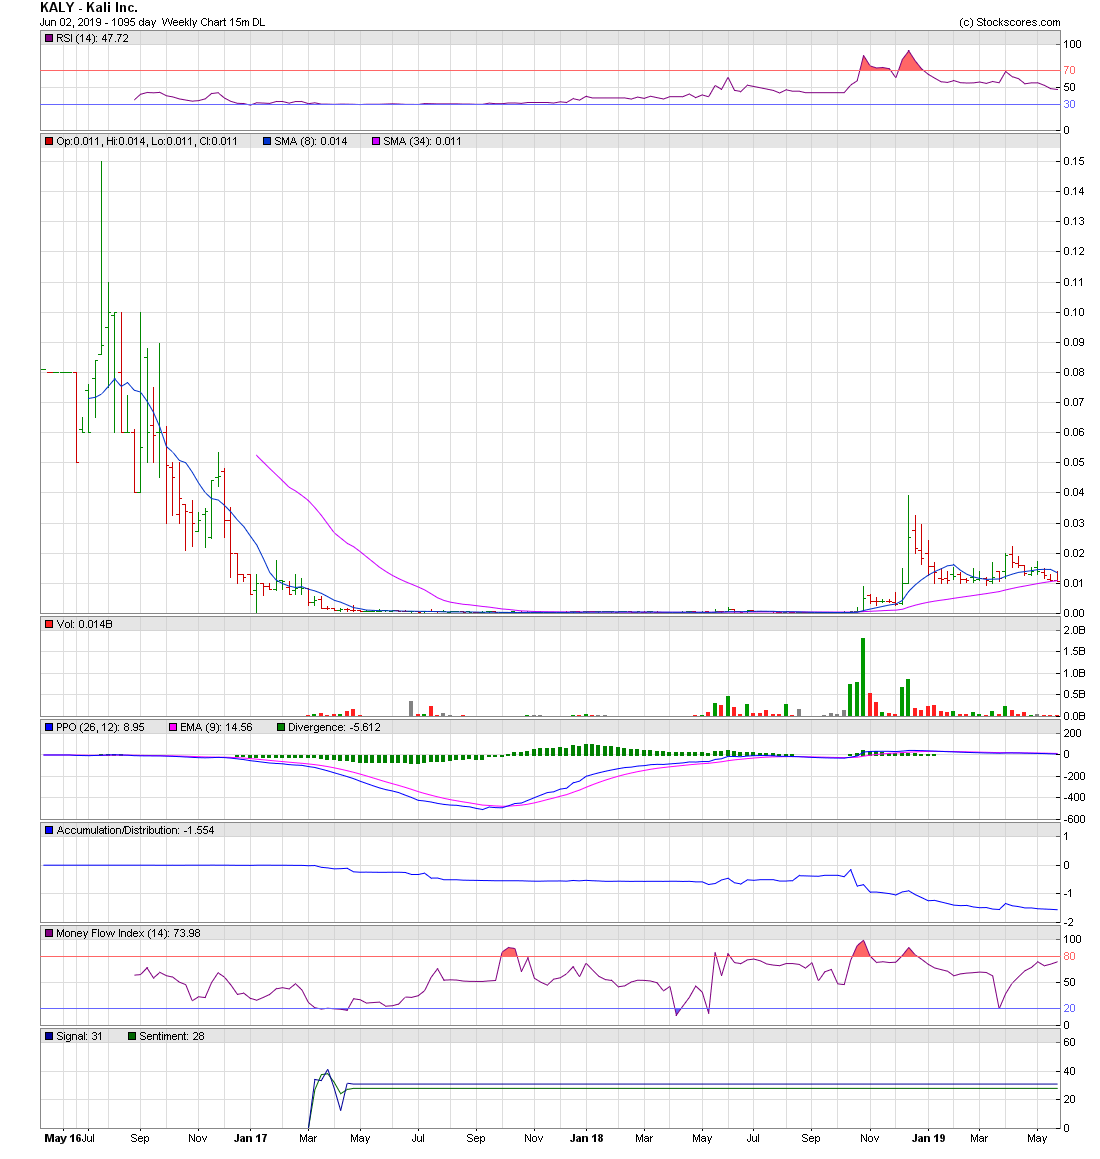
QEDN - PJET - KALY - Comparison Buy after an Elliott Wave 5-Wave Decline https://investorshub.advfn.com/uicon/155361.png?cb=636946062923800000 ________________________________________________________________ QEDN - KALY - Buy after a 5-Wave Decline https://investorshub.advfn.com/boards/read_msg.aspx?message_id=149158917 QEDN - PJET - Buy after a 5-Wave Decline https://investorshub.advfn.com/boards/read_msg.aspx?message_id=149158863 ________________________________________________________________ https://www.stockscores.com/charts/charts/?ticker=QEDN https://www.stockscores.com/charts/charts/?ticker=KALY https://www.stockscores.com/charts/charts/?ticker=PJET _______________________________________________________________ The Elliott Wave 5-Waves Sequence A Basic "A,B,C Corrective Wave" https://www.metatrader5.com/en/terminal/help/objects/elliott/elliott_theory ________________________________________________________________ https://investorshub.advfn.com/uimage/uploads/2017/2/16/vvrclElliott_Wave_Decline_8_Wave.png https://investorshub.advfn.com/uimage/uploads/2017/2/16/hgymrElliott_Wave_Chart.png Elliott Wave Basics http://www.acrotec.com/ewt.htm Elliott Wave Theory http://ta.mql4.com/elliott_wave_theory Buy after an Elliott Wave, 5-Wave decline sequence ! A Basic "A,B,C Corrective Wave" Buy, ONLY when the stocks price, is trading under the Blue 8-day M.A. when the Blue 8-day M.A. is under the Red 34-day M.A . _______________________________________________________________ Buy after an Elliott Wave 5-Wave Decline Embedded Charts https://investorshub.advfn.com/uimage/uploads/2019/4/9/fookqPJET_Apr_07_1440_day_Weekly.png https://investorshub.advfn.com/uimage/uploads/2019/6/2/jayxwKALY_Jun_02_Chart_1095_day_Weekly.png https://investorshub.advfn.com/uimage/uploads/2019/3/14/jwuexQEDN_Mar_14_Chart_2555_day_Weekly.png ________________________________________________________________ https://investorshub.advfn.com/uimage/uploads/2017/2/16/hgymrElliott_Wave_Chart.png Live! Weekly Charts https://www.stockscores.com/chart.asp?TickerSymbol=PJET&TimeRange=1440&Interval=w&Volume=1&ChartType=OHLC&Stockscores=1&ChartWidth=1100&ChartHeight=480&LogScale=None&Band=None&avgType1=SMA&movAvg1=8&avgType2=SMA&movAvg2=34&Indicator1=RSI&Indicator2=PPO&Indicator3=AccDist&Indicator4=MFI&endDate=&CompareWith=&entryPrice=&stopLossPrice= https://www.stockscores.com/chart.asp?TickerSymbol=KALY&TimeRange=1095&Interval=w&Volume=1&ChartType=OHLC&Stockscores=1&ChartWidth=1100&ChartHeight=480&LogScale=None&Band=None&avgType1=SMA&movAvg1=8&avgType2=SMA&movAvg2=34&Indicator1=RSI&Indicator2=PPO&Indicator3=AccDist&Indicator4=MFI&endDate=&CompareWith=&entryPrice=&stopLossPrice= https://www.stockscores.com/chart.asp?TickerSymbol=QEDN&TimeRange=2555&Interval=w&Volume=1&ChartType=OHLC&Stockscores=1&ChartWidth=1100&ChartHeight=480&LogScale=None&Band=None&avgType1=SMA&movAvg1=8&avgType2=SMA&movAvg2=34&Indicator1=RSI&Indicator2=PPO&Indicator3=AccDist&Indicator4=MFI&endDate=&CompareWith=&entryPrice=&stopLossPrice= ________________________________________________________________ https://investorshub.advfn.com/uimage/uploads/2017/2/16/hgymrElliott_Wave_Chart.png Live! Weekly Charts https://www.stockscores.com/chart.asp?TickerSymbol=PJET&TimeRange=720&Interval=w&Volume=1&ChartType=OHLC&Stockscores=1&ChartWidth=1100&ChartHeight=480&LogScale=None&Band=None&avgType1=SMA&movAvg1=8&avgType2=SMA&movAvg2=34&Indicator1=RSI&Indicator2=PPO&Indicator3=AccDist&Indicator4=MFI&endDate=&CompareWith=&entryPrice=&stopLossPrice= https://www.stockscores.com/chart.asp?TickerSymbol=KALY&TimeRange=720&Interval=w&Volume=1&ChartType=OHLC&Stockscores=1&ChartWidth=1100&ChartHeight=480&LogScale=None&Band=None&avgType1=SMA&movAvg1=8&avgType2=SMA&movAvg2=34&Indicator1=RSI&Indicator2=PPO&Indicator3=AccDist&Indicator4=MFI&endDate=&CompareWith=&entryPrice=&stopLossPrice= https://www.stockscores.com/chart.asp?TickerSymbol=QEDN&TimeRange=720&Interval=w&Volume=1&ChartType=OHLC&Stockscores=1&ChartWidth=1100&ChartHeight=480&LogScale=None&Band=None&avgType1=SMA&movAvg1=8&avgType2=SMA&movAvg2=34&Indicator1=RSI&Indicator2=PPO&Indicator3=AccDist&Indicator4=MFI&endDate=&CompareWith=&entryPrice=&stopLossPrice= ________________________________________________________________ https://investorshub.advfn.com/uimage/uploads/2017/2/16/hgymrElliott_Wave_Chart.png Live! Daily Charts https://www.stockscores.com/chart.asp?TickerSymbol=PJET&TimeRange=720&Interval=d&Volume=1&ChartType=OHLC&Stockscores=1&ChartWidth=1100&ChartHeight=480&LogScale=None&Band=None&avgType1=SMA&movAvg1=8&avgType2=SMA&movAvg2=34&Indicator1=RSI&Indicator2=PPO&Indicator3=AccDist&Indicator4=MFI&endDate=&CompareWith=&entryPrice=&stopLossPrice= https://www.stockscores.com/chart.asp?TickerSymbol=KALY&TimeRange=720&Interval=d&Volume=1&ChartType=OHLC&Stockscores=1&ChartWidth=1100&ChartHeight=480&LogScale=None&Band=None&avgType1=SMA&movAvg1=8&avgType2=SMA&movAvg2=34&Indicator1=RSI&Indicator2=PPO&Indicator3=AccDist&Indicator4=MFI&endDate=&CompareWith=&entryPrice=&stopLossPrice= https://www.stockscores.com/chart.asp?TickerSymbol=QEDN&TimeRange=720&Interval=d&Volume=1&ChartType=OHLC&Stockscores=1&ChartWidth=1100&ChartHeight=480&LogScale=None&Band=None&avgType1=SMA&movAvg1=8&avgType2=SMA&movAvg2=34&Indicator1=RSI&Indicator2=PPO&Indicator3=AccDist&Indicator4=MFI&endDate=&CompareWith=&entryPrice=&stopLossPrice= _______________________________________________________________ https://investorshub.advfn.com/uimage/uploads/2017/2/16/hgymrElliott_Wave_Chart.png Live! Daily Charts https://www.stockscores.com/chart.asp?TickerSymbol=PJET&TimeRange=365&Interval=d&Volume=1&ChartType=OHLC&Stockscores=1&ChartWidth=1100&ChartHeight=480&LogScale=None&Band=None&avgType1=SMA&movAvg1=8&avgType2=SMA&movAvg2=34&Indicator1=RSI&Indicator2=PPO&Indicator3=AccDist&Indicator4=MFI&endDate=&CompareWith=&entryPrice=&stopLossPrice= https://www.stockscores.com/chart.asp?TickerSymbol=KALY&TimeRange=365&Interval=d&Volume=1&ChartType=OHLC&Stockscores=1&ChartWidth=1100&ChartHeight=480&LogScale=None&Band=None&avgType1=SMA&movAvg1=8&avgType2=SMA&movAvg2=34&Indicator1=RSI&Indicator2=PPO&Indicator3=AccDist&Indicator4=MFI&endDate=&CompareWith=&entryPrice=&stopLossPrice= https://www.stockscores.com/chart.asp?TickerSymbol=QEDN&TimeRange=365&Interval=d&Volume=1&ChartType=OHLC&Stockscores=1&ChartWidth=1100&ChartHeight=480&LogScale=None&Band=None&avgType1=SMA&movAvg1=8&avgType2=SMA&movAvg2=34&Indicator1=RSI&Indicator2=PPO&Indicator3=AccDist&Indicator4=MFI&endDate=&CompareWith=&entryPrice=&stopLossPrice= https://investorshub.advfn.com/uicon/155361.png?cb=636946062923800000
 Market Data
  Markets