


Friday, May 17, 2019 1:39:08 AM
QEDN - CWIR - Comparison Analysis

QEDN Security Details
Share Structure
Market Value1...........$546,790 a/o May 16, 2019
Authorized Shares..3,000,000,000 a/o Nov 01, 2017
Outstanding Shares 1,822,632,434 a/o Nov 01, 2017
-Restricted.....…........69,887,042 a/o Nov 01, 2017
-Unrestricted.........1,752,745,392 a/o Nov 01, 2017
Float................688,232,011 a/o Mar 09, 2017
Par Value 0.001
https://www.otcmarkets.com/stock/QEDN/security
https://www.incaworldwide.com/blog/author/Kate--Bahnsen
https://www.stockscores.com/charts/charts/?ticker=QEDN
________________________________________________________________
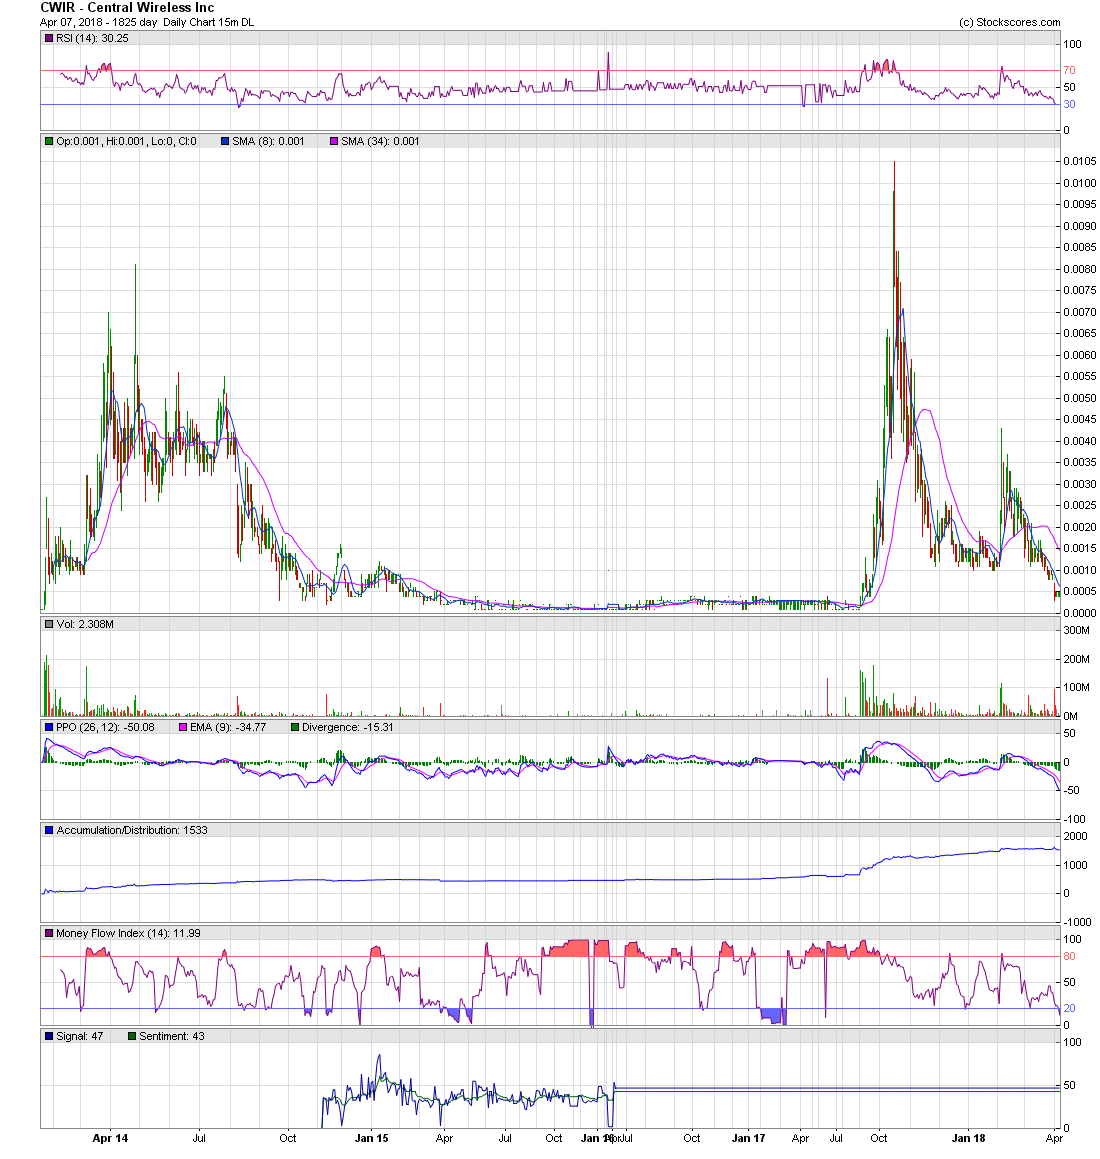
CWIR Security Details
Share Structure
Market Value1...........$1,563,354 a/o Sep 25, 2017
Authorized Shares..7,000,000,000 a/o Jul 20, 2016
Outstanding Shares 1,954,192,451 a/o Jul 20, 2016
Float..............1,086,949,892 a/o Jul 20, 2016
Par Value 0.001
https://www.otcmarkets.com/stock/CWIR/security
Authorized Shares,
has No Bearing on the price.
The Shares Authorized,
is not used in any fundamental of financial calculation,
to determine company value.
________________________________________________________________
CWIR - Alerted at 0.0002
Climbs to $0.0105
https://investorshub.advfn.com/boards/read_msg.aspx?message_id=135485245
https://investorshub.advfn.com/boards/read_msg.aspx?message_id=135443073
https://investorshub.advfn.com/boards/read_msg.aspx?message_id=135443000
https://investorshub.advfn.com/boards/read_msg.aspx?message_id=135299677
https://investorshub.advfn.com/boards/read_msg.aspx?message_id=135269502
https://investorshub.advfn.com/boards/read_msg.aspx?message_id=135269493
https://investorshub.advfn.com/boards/read_msg.aspx?message_id=135269537
https://investorshub.advfn.com/boards/read_msg.aspx?message_id=135217964
https://investorshub.advfn.com/boards/read_msg.aspx?message_id=135217969
https://investorshub.advfn.com/boards/read_msg.aspx?message_id=135181654
https://investorshub.advfn.com/boards/read_msg.aspx?message_id=135181632
https://investorshub.advfn.com/boards/read_msg.aspx?message_id=135027143
https://investorshub.advfn.com/boards/read_msg.aspx?message_id=135025891
https://investorshub.advfn.com/boards/read_msg.aspx?message_id=135025876
https://investorshub.advfn.com/boards/read_msg.aspx?message_id=134926485
https://investorshub.advfn.com/boards/read_msg.aspx?message_id=134926521
https://investorshub.advfn.com/boards/read_msg.aspx?message_id=134719211
https://investorshub.advfn.com/boards/read_msg.aspx?message_id=134719201
_________________________________________________________________

Buy after an Elliott Wave 5-Wave Decline
https://investorshub.advfn.com/boards/read_msg.aspx?message_id=147897807
________________________________________________________________
The Elliott Wave 5-Waves Sequence
A Basic "A,B,C Corrective Wave"
https://www.metatrader5.com/en/terminal/help/objects/elliott/elliott_theory
________________________________________________________________


Elliott Wave Basics
http://www.acrotec.com/ewt.htm
Elliott Wave Theory
http://ta.mql4.com/elliott_wave_theory
Buy after an Elliott Wave,
5-Wave decline sequence !
A Basic "A,B,C Corrective Wave"
Buy, ONLY when the stocks price,
is trading under the Blue 8-day M.A.
when the Blue 8-day M.A. is under the Red 34-day M.A.
________________________________________________________________
https://www.stockscores.com/charts/charts/?ticker=CWIR
https://www.stockscores.com/charts/charts/?ticker=QEDN
________________________________________________________________
Embedded and Live! Charts

_______________________________________________________________
Embedded and Live! Charts

________________________________________________________________
Live! Charts

________________________________________________________________


________________________________________________________________

_________________________________________________________________

________________________________________________________________

________________________________________________________________


QEDN Security Details
Share Structure
Market Value1...........$546,790 a/o May 16, 2019
Authorized Shares..3,000,000,000 a/o Nov 01, 2017
Outstanding Shares 1,822,632,434 a/o Nov 01, 2017
-Restricted.....…........69,887,042 a/o Nov 01, 2017
-Unrestricted.........1,752,745,392 a/o Nov 01, 2017
Float................688,232,011 a/o Mar 09, 2017
Par Value 0.001
https://www.otcmarkets.com/stock/QEDN/security
https://www.incaworldwide.com/blog/author/Kate--Bahnsen
https://www.stockscores.com/charts/charts/?ticker=QEDN
________________________________________________________________
CWIR Security Details
Share Structure
Market Value1...........$1,563,354 a/o Sep 25, 2017
Authorized Shares..7,000,000,000 a/o Jul 20, 2016
Outstanding Shares 1,954,192,451 a/o Jul 20, 2016
Float..............1,086,949,892 a/o Jul 20, 2016
Par Value 0.001
https://www.otcmarkets.com/stock/CWIR/security
Authorized Shares,
has No Bearing on the price.
The Shares Authorized,
is not used in any fundamental of financial calculation,
to determine company value.
________________________________________________________________
CWIR - Alerted at 0.0002
Climbs to $0.0105
https://investorshub.advfn.com/boards/read_msg.aspx?message_id=135485245
https://investorshub.advfn.com/boards/read_msg.aspx?message_id=135443073
https://investorshub.advfn.com/boards/read_msg.aspx?message_id=135443000
https://investorshub.advfn.com/boards/read_msg.aspx?message_id=135299677
https://investorshub.advfn.com/boards/read_msg.aspx?message_id=135269502
https://investorshub.advfn.com/boards/read_msg.aspx?message_id=135269493
https://investorshub.advfn.com/boards/read_msg.aspx?message_id=135269537
https://investorshub.advfn.com/boards/read_msg.aspx?message_id=135217964
https://investorshub.advfn.com/boards/read_msg.aspx?message_id=135217969
https://investorshub.advfn.com/boards/read_msg.aspx?message_id=135181654
https://investorshub.advfn.com/boards/read_msg.aspx?message_id=135181632
https://investorshub.advfn.com/boards/read_msg.aspx?message_id=135027143
https://investorshub.advfn.com/boards/read_msg.aspx?message_id=135025891
https://investorshub.advfn.com/boards/read_msg.aspx?message_id=135025876
https://investorshub.advfn.com/boards/read_msg.aspx?message_id=134926485
https://investorshub.advfn.com/boards/read_msg.aspx?message_id=134926521
https://investorshub.advfn.com/boards/read_msg.aspx?message_id=134719211
https://investorshub.advfn.com/boards/read_msg.aspx?message_id=134719201
_________________________________________________________________

Buy after an Elliott Wave 5-Wave Decline
https://investorshub.advfn.com/boards/read_msg.aspx?message_id=147897807
________________________________________________________________
The Elliott Wave 5-Waves Sequence
A Basic "A,B,C Corrective Wave"
https://www.metatrader5.com/en/terminal/help/objects/elliott/elliott_theory
________________________________________________________________


Elliott Wave Basics
http://www.acrotec.com/ewt.htm
Elliott Wave Theory
http://ta.mql4.com/elliott_wave_theory
Buy after an Elliott Wave,
5-Wave decline sequence !
A Basic "A,B,C Corrective Wave"
Buy, ONLY when the stocks price,
is trading under the Blue 8-day M.A.
when the Blue 8-day M.A. is under the Red 34-day M.A.
________________________________________________________________
https://www.stockscores.com/charts/charts/?ticker=CWIR
https://www.stockscores.com/charts/charts/?ticker=QEDN
________________________________________________________________
Embedded and Live! Charts

_______________________________________________________________
Embedded and Live! Charts
________________________________________________________________
Live! Charts
________________________________________________________________
________________________________________________________________
_________________________________________________________________
________________________________________________________________
________________________________________________________________

Discover What Traders Are Watching
Explore small cap ideas before they hit the headlines.


