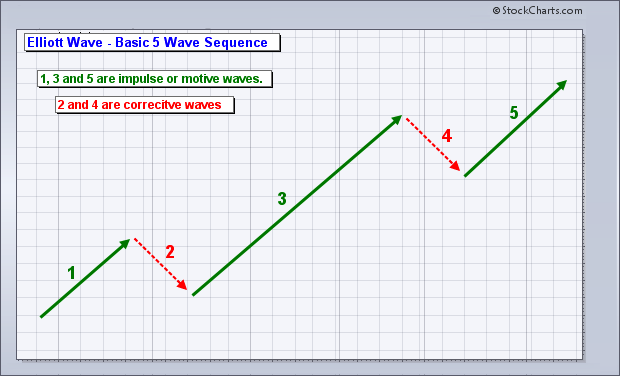
LBSR - Sell after a 5-Wave Advance https://investorshub.advfn.com/uicon/155361.png?cb=636776145039370000 _______________________________________________________________ Sell after an Elliott Wave 5-Wave Advance https://investorshub.advfn.com/boards/read_msg.aspx?message_id=147897822 Buy after an Elliott Wave 5-Wave Decline https://investorshub.advfn.com/boards/read_msg.aspx?message_id=147897807 ______________________________________________________________ Elliott Wave Basics http://www.acrotec.com/ewt.htm Elliott Wave Theory http://ta.mql4.com/elliott_wave_theory https://www.metatrader5.com/en/terminal/help/objects/elliott/elliott_theory https://investorshub.advfn.com/uimage/uploads/2018/1/20/fofsgElliott_Wave_Basic_5_Wave_Sequence.png https://investorshub.advfn.com/uimage/uploads/2019/3/27/orjmdElliott_Wave_Example_2_with_Wave_Count_shown.png Embedded Charts investorshub.advfn.com/uimage/uploads/2019/4/3/cmnjxLBSR_Apr_03_Chart_30_day_60_minute.png investorshub.advfn.com/uimage/uploads/2019/4/3/vmtfiLBSR_Apr_03_Chart_30_day_120_minute.png investorshub.advfn.com/uimage/uploads/2019/4/3/xrcodLBSR_Apr_03_Chart_180_day_Daily.png investorshub.advfn.com/uimage/uploads/2019/4/3/yihamLBSR_Apr_03_Chart_1440_day_Weekly.png ________________________________________________________________ The Elliott Wave 5-Waves Sequence A Basic "A,B,C Corrective Wave" https://www.metatrader5.com/en/terminal/help/objects/elliott/elliott_theory ________________________________________________________________ https://investorshub.advfn.com/uimage/uploads/2017/2/16/vvrclElliott_Wave_Decline_8_Wave.png https://investorshub.advfn.com/uimage/uploads/2017/2/16/hgymrElliott_Wave_Chart.png Elliott Wave Basics http://www.acrotec.com/ewt.htm Elliott Wave Theory http://ta.mql4.com/elliott_wave_theory Buy after an Elliott Wave, 5-Wave decline sequence ! A Basic "A,B,C Corrective Wave" Buy, ONLY when the stocks price, is trading under the Blue 8-day M.A. when the Blue 8-day M.A. is under the Red 34-day M.A . ________________________________________________________________ Live! Charts https://www.stockscores.com/chart.asp?TickerSymbol=LBSR&TimeRange=1095&Interval=d&Volume=1&ChartType=OHLC&Stockscores=1&ChartWidth=1100&ChartHeight=480&LogScale=None&Band=None&avgType1=SMA&movAvg1=8&avgType2=SMA&movAvg2=34&Indicator1=RSI&Indicator2=PPO&Indicator3=AccDist&Indicator4=MFI&endDate=&CompareWith=&entryPrice=&stopLossPrice= https://www.stockscores.com/chart.asp?TickerSymbol=LBSR&TimeRange=1095&Interval=w&Volume=1&ChartType=OHLC&Stockscores=1&ChartWidth=1100&ChartHeight=480&LogScale=None&Band=None&avgType1=SMA&movAvg1=8&avgType2=SMA&movAvg2=34&Indicator1=RSI&Indicator2=PPO&Indicator3=AccDist&Indicator4=MFI&endDate=&CompareWith=&entryPrice=&stopLossPrice= https://www.stockscores.com/chart.asp?TickerSymbol=LBSR&TimeRange=1440&Interval=w&Volume=1&ChartType=OHLC&Stockscores=1&ChartWidth=1100&ChartHeight=480&LogScale=None&Band=None&avgType1=SMA&movAvg1=8&avgType2=SMA&movAvg2=34&Indicator1=RSI&Indicator2=PPO&Indicator3=AccDist&Indicator4=MFI&endDate=&CompareWith=&entryPrice=&stopLossPrice= https://www.stockscores.com/chart.asp?TickerSymbol=LBSR&TimeRange=1825&Interval=w&Volume=1&ChartType=OHLC&Stockscores=1&ChartWidth=1100&ChartHeight=480&LogScale=None&Band=None&avgType1=SMA&movAvg1=8&avgType2=SMA&movAvg2=34&Indicator1=RSI&Indicator2=PPO&Indicator3=AccDist&Indicator4=MFI&endDate=&CompareWith=&entryPrice=&stopLossPrice= https://investorshub.advfn.com/uicon/155361.png?cb=636776145039370000
 Market Data
  Markets