


Monday, March 04, 2019 7:24:33 PM
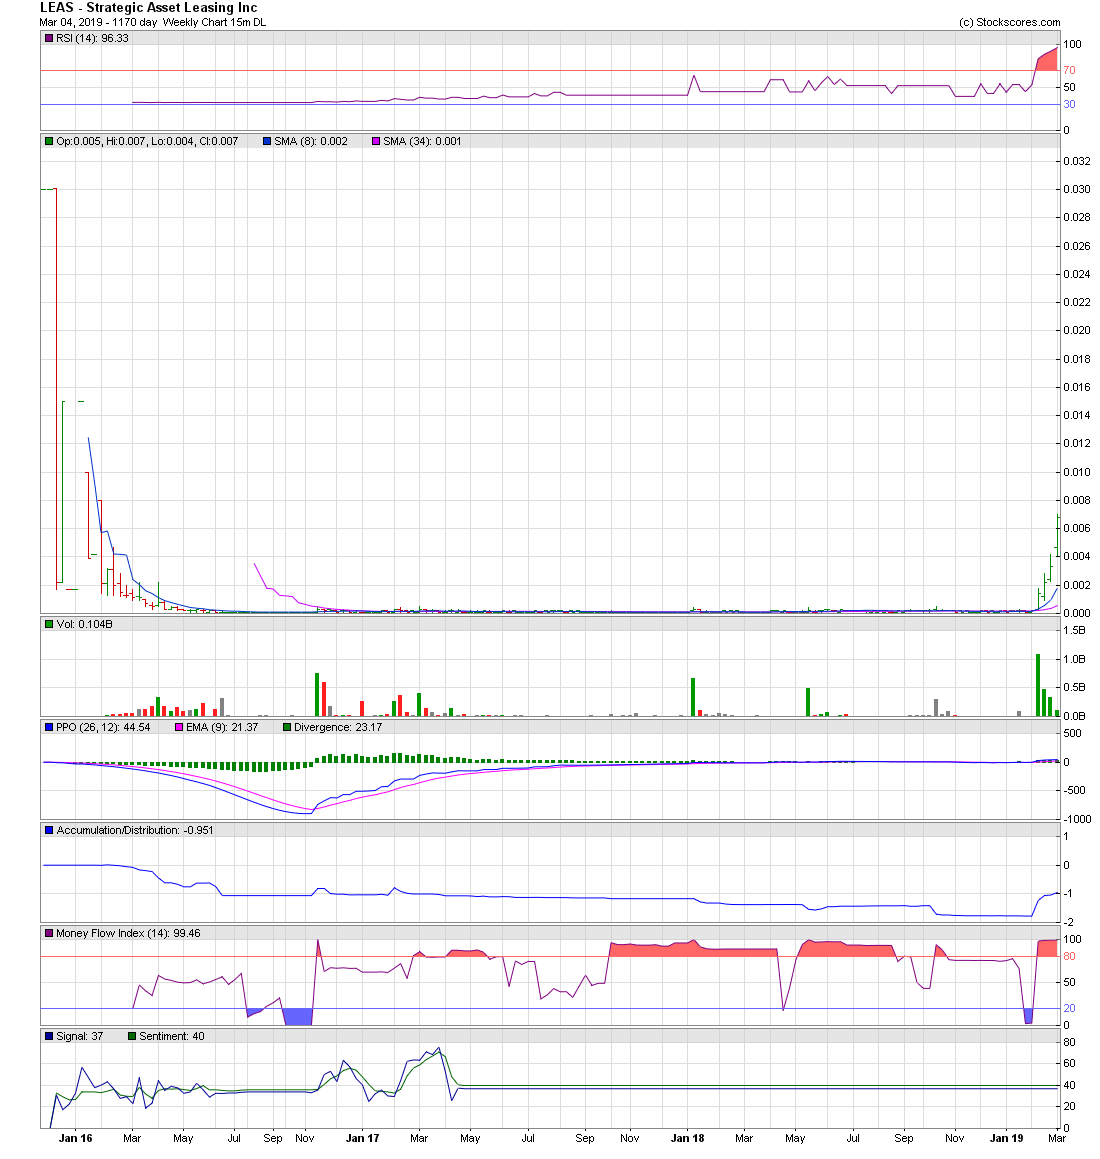
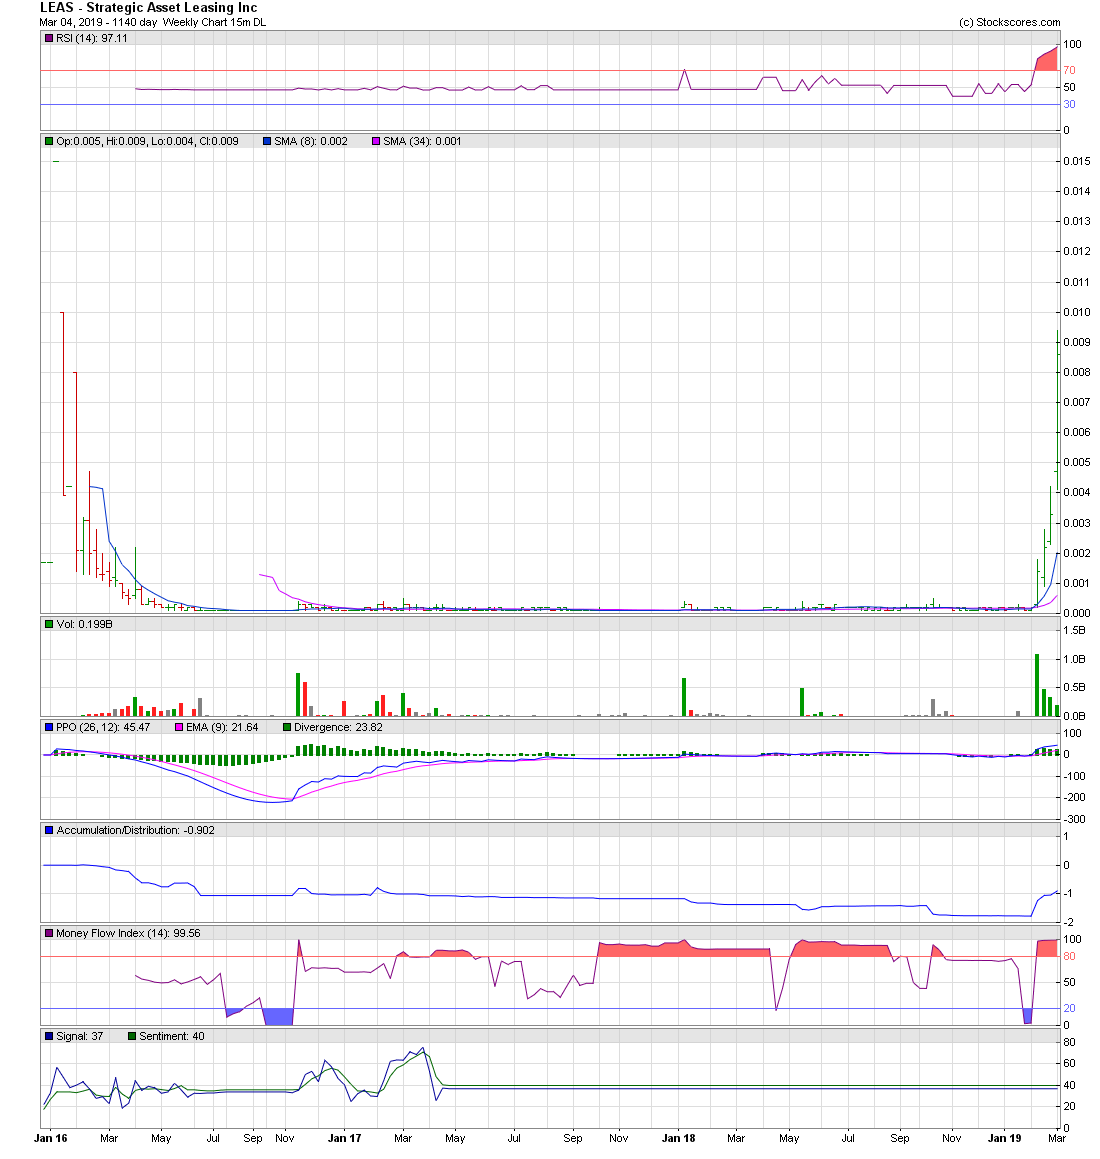
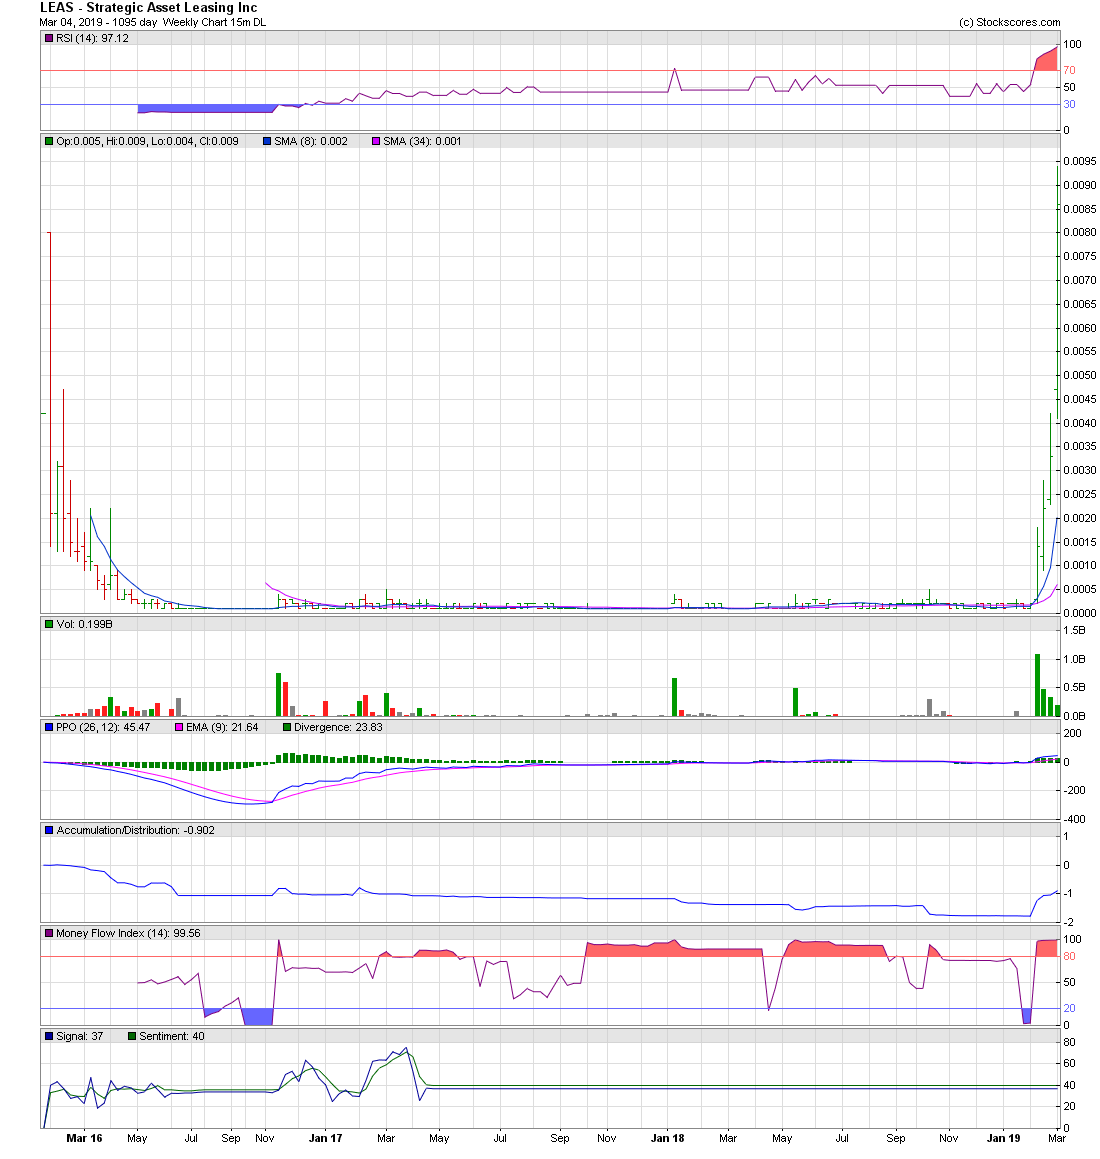
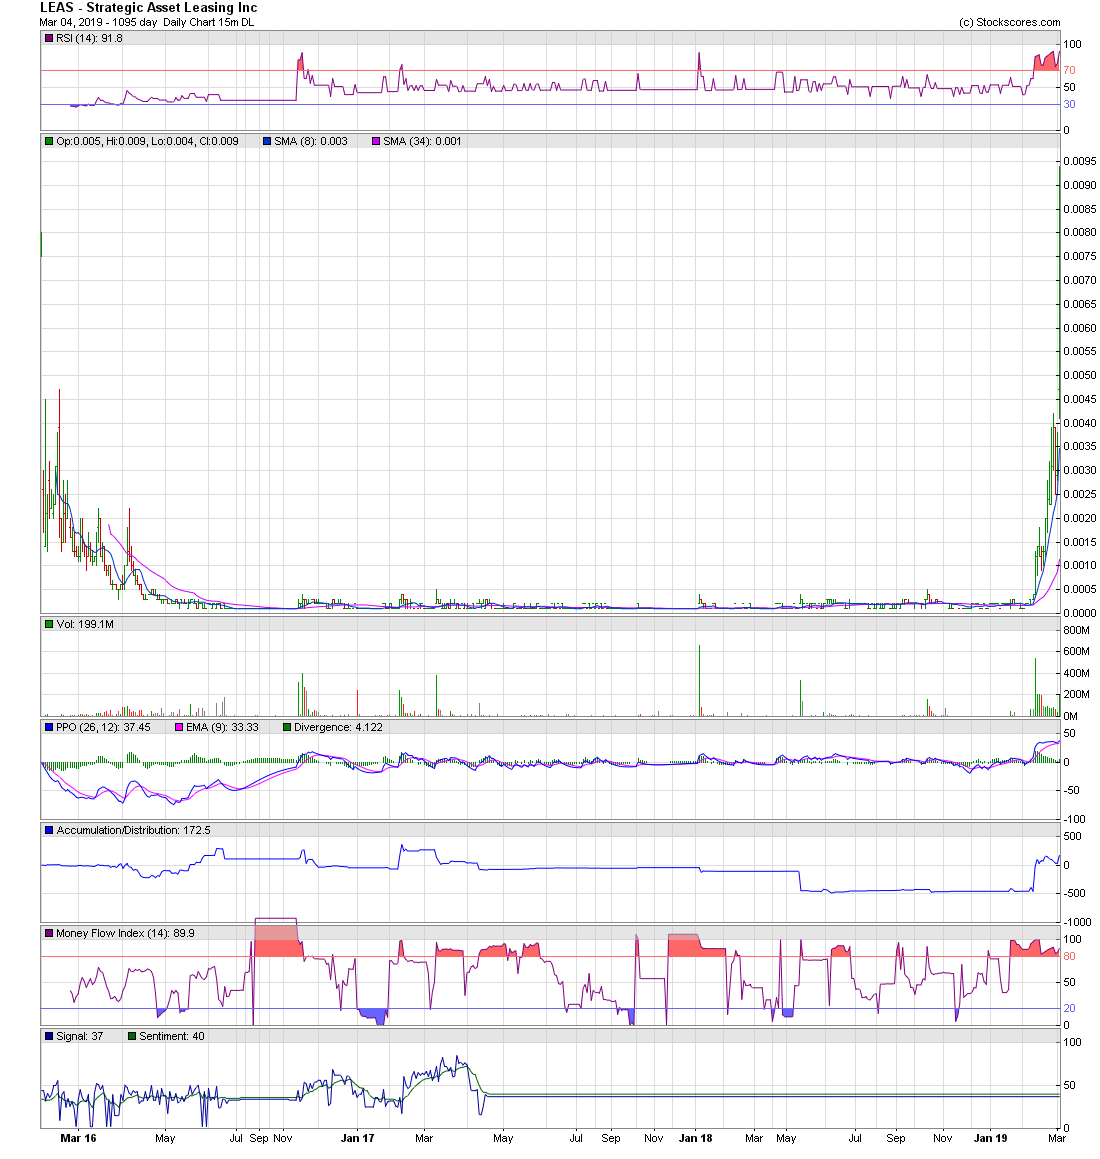
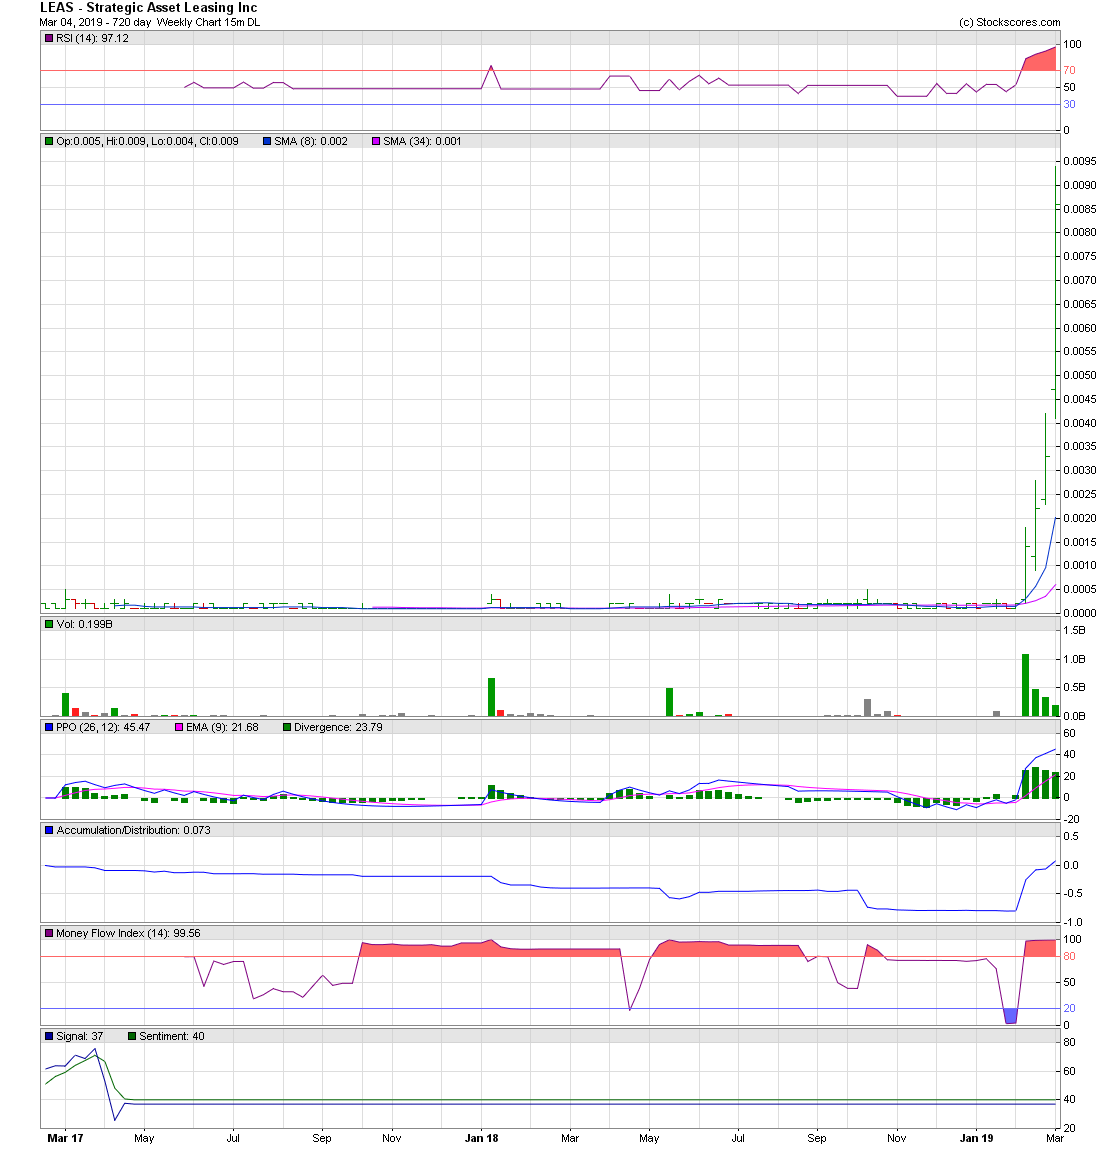
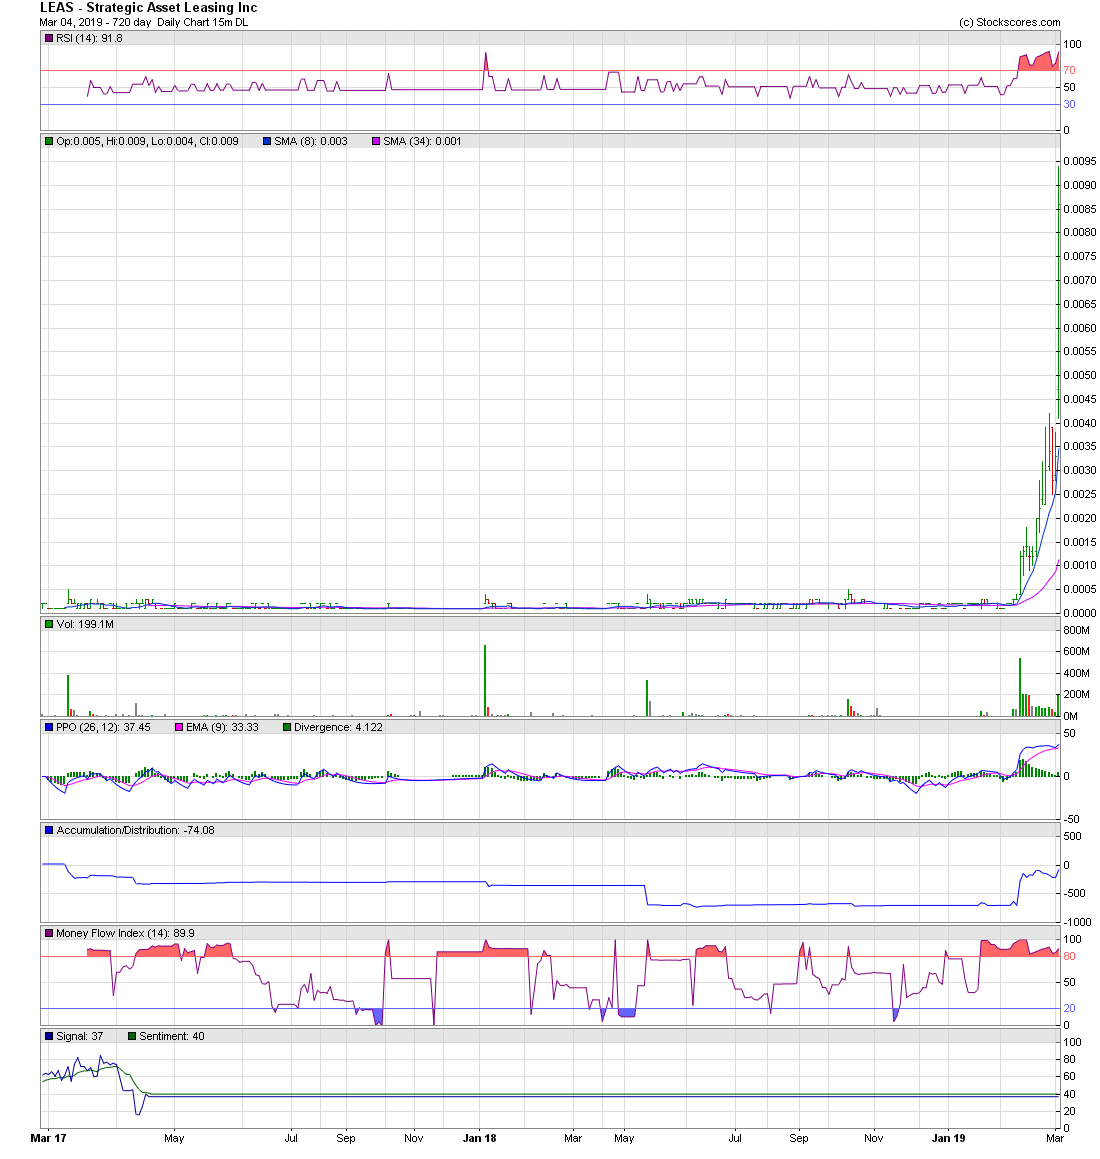
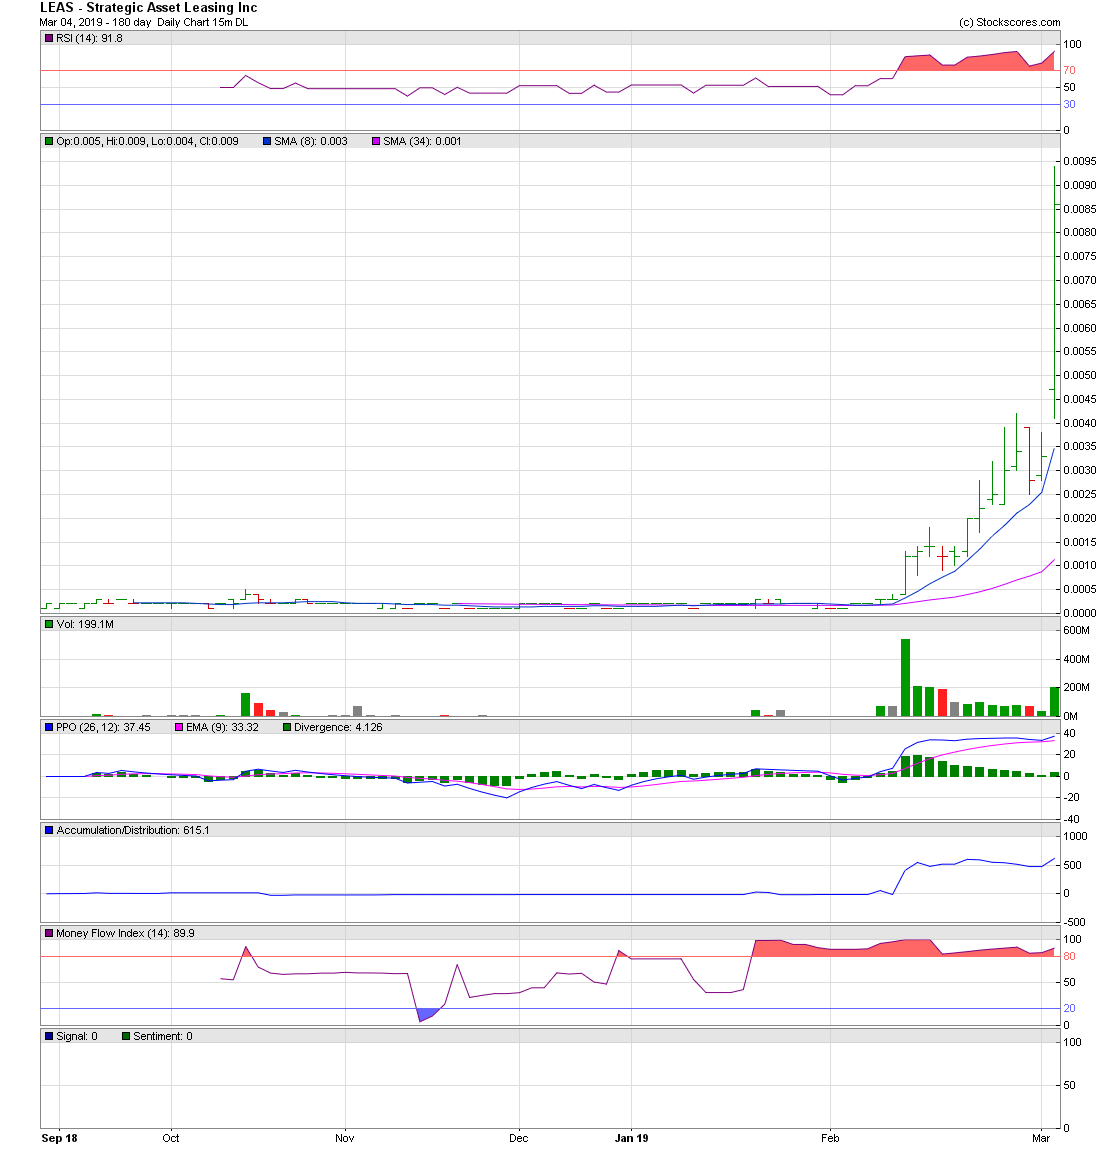
LEAS - from 0.0002 - Climbs to 0.0094

________________________________________________________________
Trader53's Wealth Strategy
* Buy 2 Million Shares of every 0.0001 that you like !
* 2 Million Shares at 0.0001 is $200
* Most 0.0001's will climb to 0.0003 / 0.0004
* Many 0.0001's will climb to 0.0012 and Higher
* Some 0.0001's will climb to $0.01 and Higher
________________________________________________________________
Triple 000 Traders - It's Time To Get Loaded!
* Buy 2 Million Shares of every 0.0001 that you like !
* Always try to Buy at 0.0001
________________________________________________________________
Trader53's Wealth Strategy:
Had you bought just 10 Million shares at 0.0002
for a Cost of just $2,000
your 10 Million shares could have been Sold
at a conservative 0.0040 for $40,000 <-------------
on the climb to 0.0094
_________________________________________________________________
Pink No Information

LEAS Security Details
Share Structure
Market Value1...............$1,483,723 a/o Feb 21, 2019
Authorized Shares...800,000,000 a/o Feb 20, 2019
Outstanding Shares..741,861,360 a/o Feb 20, 2019
Restricted.................102,321,015 a/o Feb 20, 2019
Unrestricted...............639,540,345 a/o Feb 20, 2019
Held at DTC................639,278,736 a/o Feb 20, 2019
Float........9,901,942 a/o Dec 31, 2015
Par Value 0.0001
Authorized Shares,
has No Bearing on the price.
The Shares Authorized,
is not used in any fundamental of financial calculation,
to determine company value.
________________________________________________________________
Profile / News / Filings
https://www.otcmarkets.com/stock/LEAS/profile
https://www.otcmarkets.com/stock/LEAS/security
https://www.otcmarkets.com/stock/LEAS/news
https://www.otcmarkets.com/stock/LEAS/disclosure
News / Targets
https://globenewswire.com/Search/NewsSearch?keyword=LEAS
https://www.barchart.com/stocks/quotes/LEAS
http://www.allotcbb.com/quote.php?symbol=LEAS
https://greenleafpotstocks.com/stock-report/?symbol=LEAS
https://www.barchart.com/stocks/quotes/LEAS/technical-chart?plot=CANDLE&volume=total&data=DO&density=X&pricesOn=1&asPctChange=0&logscale=0&indicators=ACCUM;SMA(50);SMA(100);SMA(20);SMA(200);RSI(14,100);MFI(14,100);SMACD(12,26,9);PTP(50);PTP(50);BOLLW(20,2);BBANDS(20,2)&sym=LEAS&grid=1&height=500&studyheight=100
BuyIns.Net Alerts for Symbol LEAS
http://www.buyins.net/tools/symbol_stats.php?sym=LEAS
Time and Sales
http://www.investorpoint.com/stock/LEAS-Mammoth%20Energy%20Group%20Inc/
http://www.investorpoint.com/stock/LEAS-Mammoth+Energy+Group+Inc/market-makers-level2/
http://www.investorpoint.com/stock/LEAS-Mammoth+Energy+Group+Inc/price-history/
https://ih.advfn.com/stock-market/USOTC/strategic-asset-leasing-inc-LEAS/trades
Analysis / Charts
https://www.stockscores.com/charts/charts/?ticker=LEAS
https://www.barchart.com/stocks/quotes/LEAS/technical-chart?plot=CANDLE&volume=total&data=DO&density=M&pricesOn=1&asPctChange=0&logscale=0&indicators=ACCUM;SMA(50);SMA(100);SMA(20);SMA(200);RSI(14,100);MFI(14,100);SMACD(12,26,9);PTP(50);PTP(50);BOLLW(20,2);BBANDS(20,2)&sym=LEAS&grid=1&height=500&studyheight=100
Short Information
http://shortsqueeze.com/?symbol=LEAS&submit=Short+Quote%E2%84%A2
https://otcshortreport.com/company/LEAS
https://www.interactivebrokers.com/en/index.php?key=LEAS&cntry=usa&tag=United+States&ib_entity=llc&ln=&asset=&f=4587&conf=am&amref=1
________________________________________________________________
LEAS - from 0.0002
Climbs to 0.0094
Tuesday, 01/29/19
LEAS 0.00020
Wednesday, 01/16/19
LEAS 0.00020
Saturday, 01/05/19
LEAS 0.00020
________________________________________________________________
Embedded Charts
Live! Charts


How Stocks Targets are Calculated
Fibonacci Numbers and Retrace Targets: Explained

Fibonacci Numbers
http://www.stockta.com/cgi-bin/school.pl?page=fib
Fibonacci Retracements
* Golden 61.8% Retracements
* Moderate 38.2% Retracements
* Common 38.2% Retracements
http://stockcharts.com/school/doku.php?id=chart_school:chart_analysis:fibonacci_retracemen
Fibonacci Retracements
http://investorshub.advfn.com/boards/read_msg.aspx?message_id=77145842
________________________________________________________________
Fibonacci Numbers
are commonly used in Technical Analysis
with or without a knowledge of Elliot Wave Analysis
to determine potential support, resistance,
and price objectives.
The most popular Fibonacci Retracements are
61.8% and 38.2%
61.8% retracements
imply a new trend is establishing itself.
38.2% retracements
usually imply that the prior trend will continue
38.2% retracements
are considered natural retracements in a healthy trend.
Fibonacci Retracements
can be applied after a decline
to forecast the length of a counter-trend bounce.
________________________________________________________________
The 50% retracement is not based on a Fibonacci number.
Instead, this number stems from Dow Theory's assertion
that the Averages often retrace half their prior move.
50% retracement
implies indecision.
________________________________________________________________
________________________________________________________________
Buy after an Elliott Wave 5-Wave Decline


_________________________________________________________________


________________________________________________________________
Trader53's Wealth Strategy
* Buy 2 Million Shares of every 0.0001 that you like !
* 2 Million Shares at 0.0001 is $200
* Most 0.0001's will climb to 0.0003 / 0.0004
* Many 0.0001's will climb to 0.0012 and Higher
* Some 0.0001's will climb to $0.01 and Higher
________________________________________________________________
Triple 000 Traders - It's Time To Get Loaded!
* Buy 2 Million Shares of every 0.0001 that you like !
* Always try to Buy at 0.0001
________________________________________________________________
Trader53's Wealth Strategy:
Had you bought just 10 Million shares at 0.0002
for a Cost of just $2,000
your 10 Million shares could have been Sold
at a conservative 0.0040 for $40,000 <-------------
on the climb to 0.0094
_________________________________________________________________
Pink No Information

LEAS Security Details
Share Structure
Market Value1...............$1,483,723 a/o Feb 21, 2019
Authorized Shares...800,000,000 a/o Feb 20, 2019
Outstanding Shares..741,861,360 a/o Feb 20, 2019
Restricted.................102,321,015 a/o Feb 20, 2019
Unrestricted...............639,540,345 a/o Feb 20, 2019
Held at DTC................639,278,736 a/o Feb 20, 2019
Float........9,901,942 a/o Dec 31, 2015
Par Value 0.0001
Authorized Shares,
has No Bearing on the price.
The Shares Authorized,
is not used in any fundamental of financial calculation,
to determine company value.
________________________________________________________________
Profile / News / Filings
https://www.otcmarkets.com/stock/LEAS/profile
https://www.otcmarkets.com/stock/LEAS/security
https://www.otcmarkets.com/stock/LEAS/news
https://www.otcmarkets.com/stock/LEAS/disclosure
News / Targets
https://globenewswire.com/Search/NewsSearch?keyword=LEAS
https://www.barchart.com/stocks/quotes/LEAS
http://www.allotcbb.com/quote.php?symbol=LEAS
https://greenleafpotstocks.com/stock-report/?symbol=LEAS
https://www.barchart.com/stocks/quotes/LEAS/technical-chart?plot=CANDLE&volume=total&data=DO&density=X&pricesOn=1&asPctChange=0&logscale=0&indicators=ACCUM;SMA(50);SMA(100);SMA(20);SMA(200);RSI(14,100);MFI(14,100);SMACD(12,26,9);PTP(50);PTP(50);BOLLW(20,2);BBANDS(20,2)&sym=LEAS&grid=1&height=500&studyheight=100
BuyIns.Net Alerts for Symbol LEAS
http://www.buyins.net/tools/symbol_stats.php?sym=LEAS
Time and Sales
http://www.investorpoint.com/stock/LEAS-Mammoth%20Energy%20Group%20Inc/
http://www.investorpoint.com/stock/LEAS-Mammoth+Energy+Group+Inc/market-makers-level2/
http://www.investorpoint.com/stock/LEAS-Mammoth+Energy+Group+Inc/price-history/
https://ih.advfn.com/stock-market/USOTC/strategic-asset-leasing-inc-LEAS/trades
Analysis / Charts
https://www.stockscores.com/charts/charts/?ticker=LEAS
https://www.barchart.com/stocks/quotes/LEAS/technical-chart?plot=CANDLE&volume=total&data=DO&density=M&pricesOn=1&asPctChange=0&logscale=0&indicators=ACCUM;SMA(50);SMA(100);SMA(20);SMA(200);RSI(14,100);MFI(14,100);SMACD(12,26,9);PTP(50);PTP(50);BOLLW(20,2);BBANDS(20,2)&sym=LEAS&grid=1&height=500&studyheight=100
Short Information
http://shortsqueeze.com/?symbol=LEAS&submit=Short+Quote%E2%84%A2
https://otcshortreport.com/company/LEAS
https://www.interactivebrokers.com/en/index.php?key=LEAS&cntry=usa&tag=United+States&ib_entity=llc&ln=&asset=&f=4587&conf=am&amref=1
________________________________________________________________
LEAS - from 0.0002
Climbs to 0.0094
Tuesday, 01/29/19
LEAS 0.00020
Wednesday, 01/16/19
LEAS 0.00020
Saturday, 01/05/19
LEAS 0.00020
________________________________________________________________
Embedded Charts


Live! Charts

How Stocks Targets are Calculated
Fibonacci Numbers and Retrace Targets: Explained

Fibonacci Numbers
http://www.stockta.com/cgi-bin/school.pl?page=fib
Fibonacci Retracements
* Golden 61.8% Retracements
* Moderate 38.2% Retracements
* Common 38.2% Retracements
http://stockcharts.com/school/doku.php?id=chart_school:chart_analysis:fibonacci_retracemen
Fibonacci Retracements
http://investorshub.advfn.com/boards/read_msg.aspx?message_id=77145842
________________________________________________________________
Fibonacci Numbers
are commonly used in Technical Analysis
with or without a knowledge of Elliot Wave Analysis
to determine potential support, resistance,
and price objectives.
The most popular Fibonacci Retracements are
61.8% and 38.2%
61.8% retracements
imply a new trend is establishing itself.
38.2% retracements
usually imply that the prior trend will continue
38.2% retracements
are considered natural retracements in a healthy trend.
Fibonacci Retracements
can be applied after a decline
to forecast the length of a counter-trend bounce.
________________________________________________________________
The 50% retracement is not based on a Fibonacci number.
Instead, this number stems from Dow Theory's assertion
that the Averages often retrace half their prior move.
50% retracement
implies indecision.
________________________________________________________________
________________________________________________________________
Buy after an Elliott Wave 5-Wave Decline


_________________________________________________________________


Discover What Traders Are Watching
Explore small cap ideas before they hit the headlines.


