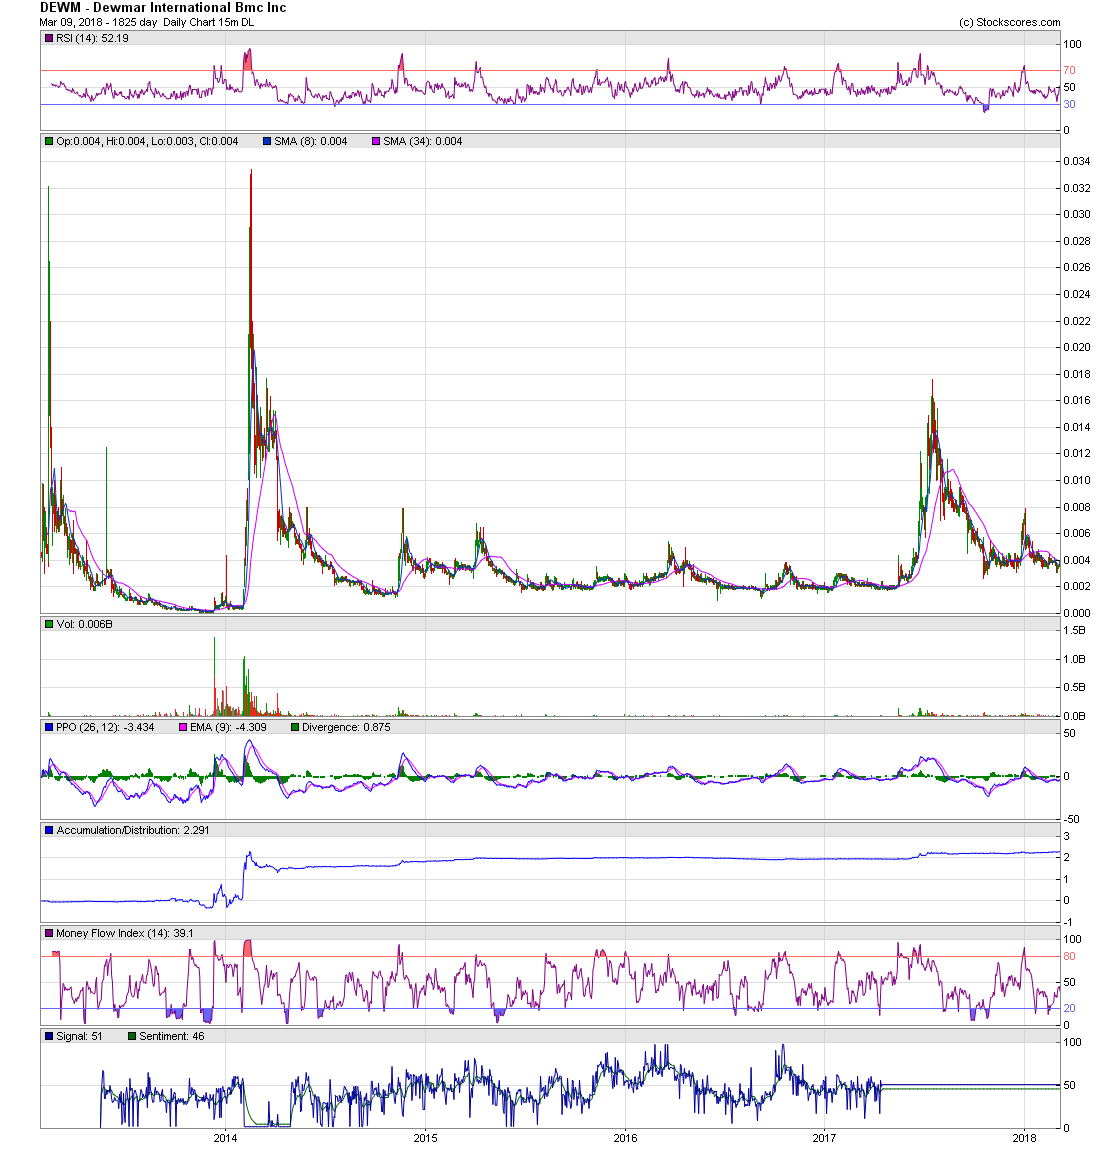
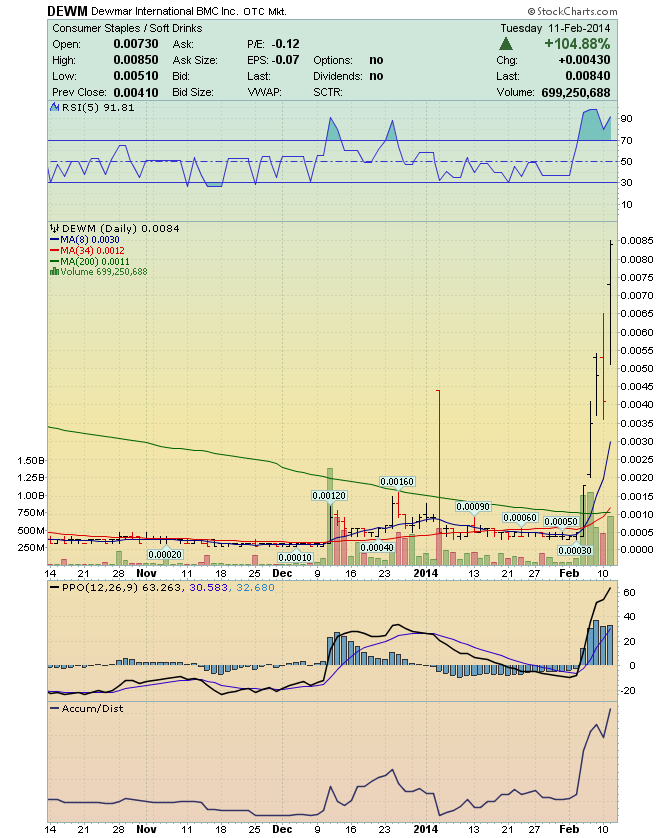
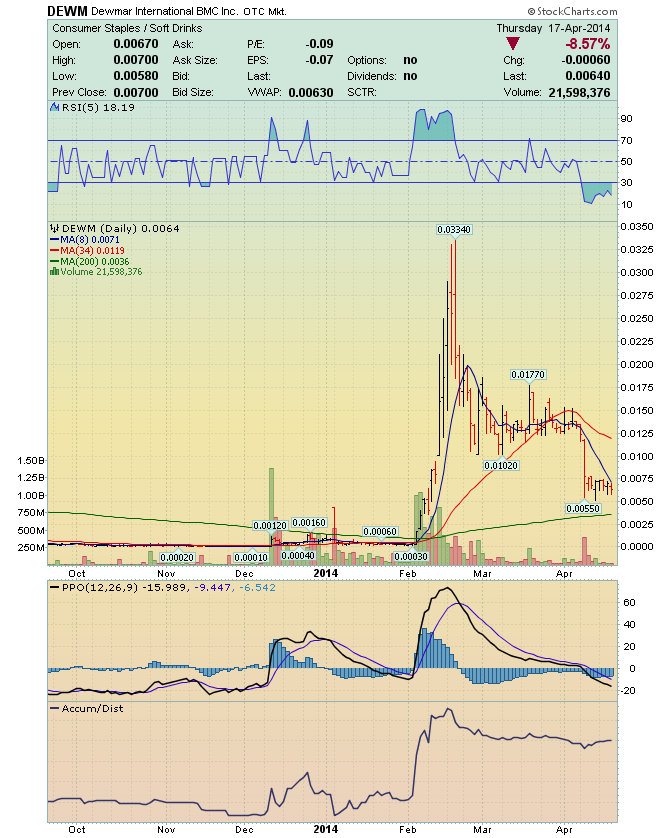
CATV - DEWM - Share Price Prediction CATV - like - DEWM Chart Price Pivot High of $0.03 on both Charts ________________________________________________________________ https://walletinvestor.com/stock-forecast/catv-stock-prediction 4Cable TV International, Inc Stock Price Forecast for 2019 Date----------Open------Close------Minimum----- Maximum Price Feb 2019 -- 0.00486 -- 0.00363 -- 0.000784 -- 0.00491 ________________________________________________________________ 2nd Resistance 0.0040 1st Resistance 0.0020 Embedded DEWM Chart https://investorshub.advfn.com/uimage/uploads/2018/3/9/ufslgDEWM_Mar_9_Chart_1.png https://www.stockscores.com/chart.asp?TickerSymbol=CATV&TimeRange=1290&Interval=d&Volume=1&ChartType=OHLC&Stockscores=1&ChartWidth=1100&ChartHeight=480&LogScale=None&Band=None&avgType1=SMA&movAvg1=8&avgType2=SMA&movAvg2=34&Indicator1=RSI&Indicator2=PPO&Indicator3=AccDist&Indicator4=MFI&endDate=&CompareWith=&entryPrice=&stopLossPrice= ________________________________________________________________ 2nd Resistance 0.0040 1st Resistance 0.0020 Live! Charts https://www.stockscores.com/chart.asp?TickerSymbol=DEWM&TimeRange=2190&Interval=d&Volume=1&ChartType=OHLC&Stockscores=1&ChartWidth=1100&ChartHeight=480&LogScale=None&Band=None&avgType1=SMA&movAvg1=8&avgType2=SMA&movAvg2=34&Indicator1=RSI&Indicator2=PPO&Indicator3=AccDist&Indicator4=MFI&endDate=&CompareWith=&entryPrice=&stopLossPrice= https://www.stockscores.com/chart.asp?TickerSymbol=CATV&TimeRange=1290&Interval=d&Volume=1&ChartType=OHLC&Stockscores=1&ChartWidth=1100&ChartHeight=480&LogScale=None&Band=None&avgType1=SMA&movAvg1=8&avgType2=SMA&movAvg2=34&Indicator1=RSI&Indicator2=PPO&Indicator3=AccDist&Indicator4=MFI&endDate=&CompareWith=&entryPrice=&stopLossPrice= _______________________________________________________________ Date----------Open------Close------Minimum----- Maximum Price Feb 2019 -- 0.00486 -- 0.00363 -- 0.000784 -- 0.00491 _______________________________________________________________ https://investorshub.advfn.com/uimage/uploads/2016/12/18/cezezDEWM_Chart_0.0001.png https://www.stockscores.com/chart.asp?TickerSymbol=CATV&TimeRange=180&Interval=d&Volume=1&ChartType=OHLC&Stockscores=1&ChartWidth=1100&ChartHeight=480&LogScale=None&Band=None&avgType1=SMA&movAvg1=8&avgType2=SMA&movAvg2=34&Indicator1=RSI&Indicator2=PPO&Indicator3=AccDist&Indicator4=MFI&endDate=&CompareWith=&entryPrice=&stopLossPrice= https://investorshub.advfn.com/uimage/uploads/2016/12/18/cezezDEWM_Chart_0.0001.png https://www.stockscores.com/chart.asp?TickerSymbol=CATV&TimeRange=1230&Interval=d&Volume=1&ChartType=OHLC&Stockscores=1&ChartWidth=1100&ChartHeight=480&LogScale=None&Band=None&avgType1=SMA&movAvg1=8&avgType2=SMA&movAvg2=34&Indicator1=RSI&Indicator2=PPO&Indicator3=AccDist&Indicator4=MFI&endDate=&CompareWith=&entryPrice=&stopLossPrice= https://investorshub.advfn.com/uimage/uploads/2013/12/26/doivsDEWM__Has_an_ABC_retrace_of_its_decline_from_0.0018.png https://www.stockscores.com/chart.asp?TickerSymbol=CATV&TimeRange=1230&Interval=d&Volume=1&ChartType=OHLC&Stockscores=1&ChartWidth=1100&ChartHeight=480&LogScale=None&Band=None&avgType1=SMA&movAvg1=8&avgType2=SMA&movAvg2=34&Indicator1=RSI&Indicator2=PPO&Indicator3=AccDist&Indicator4=MFI&endDate=&CompareWith=&entryPrice=&stopLossPrice= https://investorshub.advfn.com/uimage/uploads/2016/12/18/crcbnDEWM_Chart_2_from_0.0001_to_0.0334.png https://www.stockscores.com/chart.asp?TickerSymbol=CATV&TimeRange=1290&Interval=d&Volume=1&ChartType=OHLC&Stockscores=1&ChartWidth=1100&ChartHeight=480&LogScale=None&Band=None&avgType1=SMA&movAvg1=8&avgType2=SMA&movAvg2=34&Indicator1=RSI&Indicator2=PPO&Indicator3=AccDist&Indicator4=MFI&endDate=&CompareWith=&entryPrice=&stopLossPrice=
 Market Data
  Markets