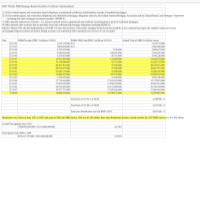
“Aggregate Results for Resolutions during the Crisis Table 6.3 summarizes the use of the different strategies deployed by the FDIC from 2008 to 2013. The failed banks are grouped into five categories: (1) Washington Mutual Bank (WaMu), (2) other whole-bank P&A,57 (3) loss-share P&A,58 (4) other P&A,59 and (5) payout and DINB.60 For failed banks that were placed into bridge banks before resolution, the final resolution method was used for categorization. Of the $686 billion in assets resolved over the course of the crisis, $307 billion (45 percent) were the assets of WaMu. The second-largest bank that failed was IndyMac ($30 billion, or 4.5 percent).”
PDF page 26 of 65
“Table 6.4. FDIC Losses by Resolution Type, 2008–2013 Resolution Type
Washington Mutual
Total Assets ($ Billions) 307.0
Total Cost to FDIC ($ Billions) 0 “
PDF page 27 of 65
“Table 6.5. Selected Condition Indicators by Resolution Type
Washington Mutual
Noncurrent Loan Rate a 4.1%
a The sum of nonaccrual loans plus loans 90+ days delinquent, divided by
Equity to Assets 7.9% “
______________________________
IMO...my conclusions as of October 26, 2018
1) Per FDIC, Washington Mutual had $307 billion in assets (which does not include WMB,FSB)
2) The cost to FDIC for Washington Mutual was zero
3) only 4.1% of the loans in Washington Mutual were 90+ days delinquent
4) Washington Mutual Equity to asset ratio is 7.9%, compare that number to other banks during 2008
5) IMO...overall Washington Mutual was a solvent bank


 Market Data
  Markets


 AI
AI