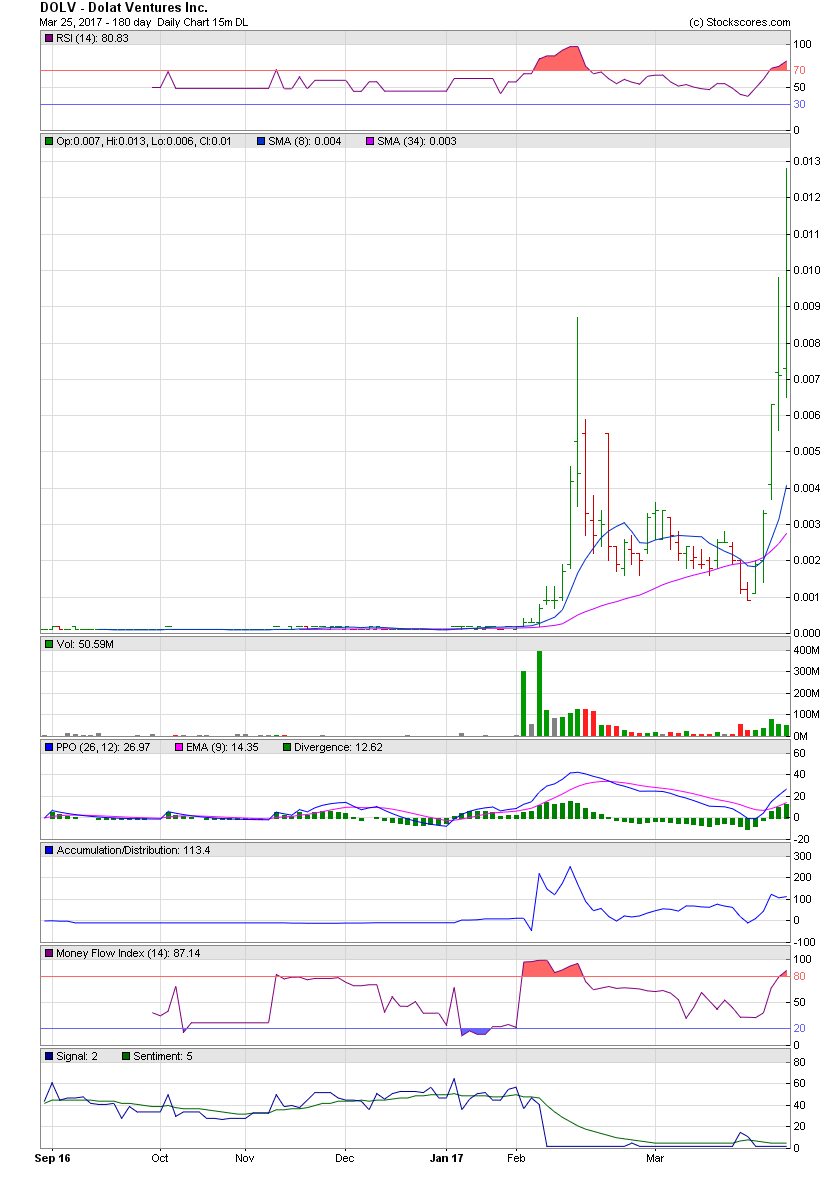
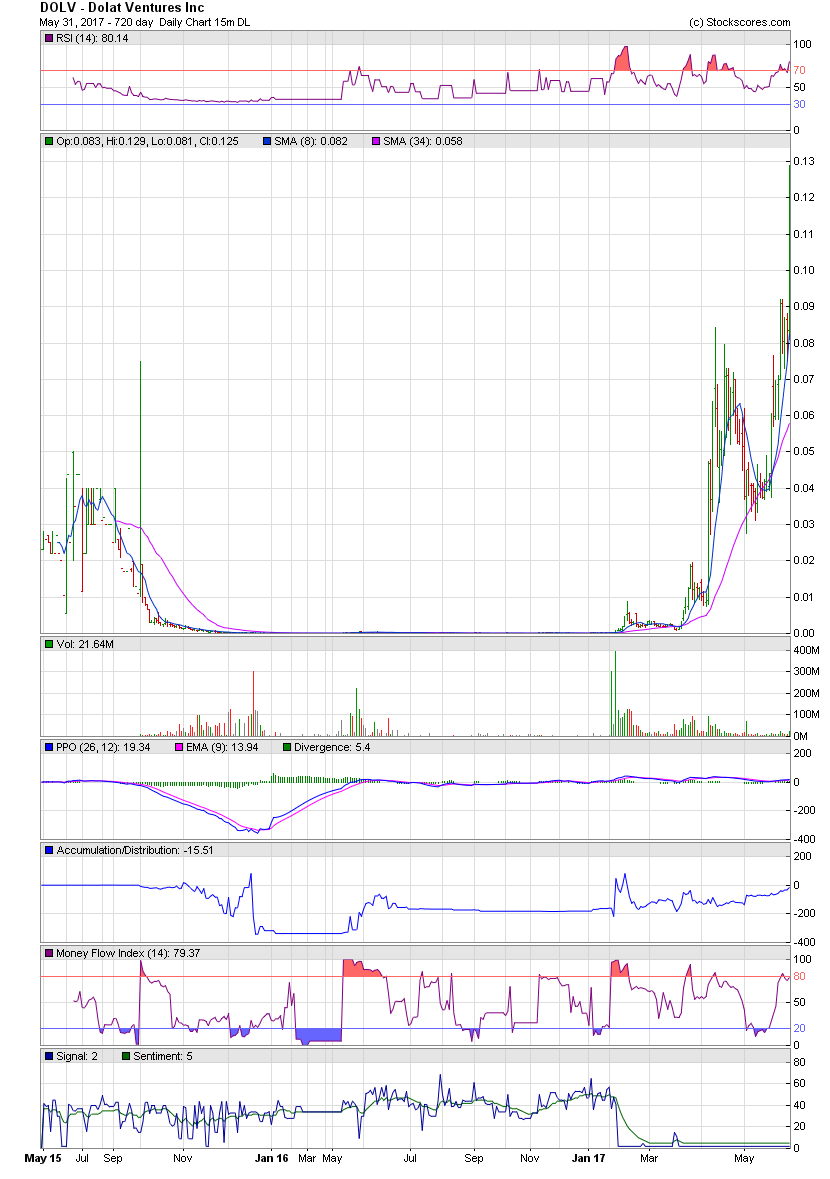
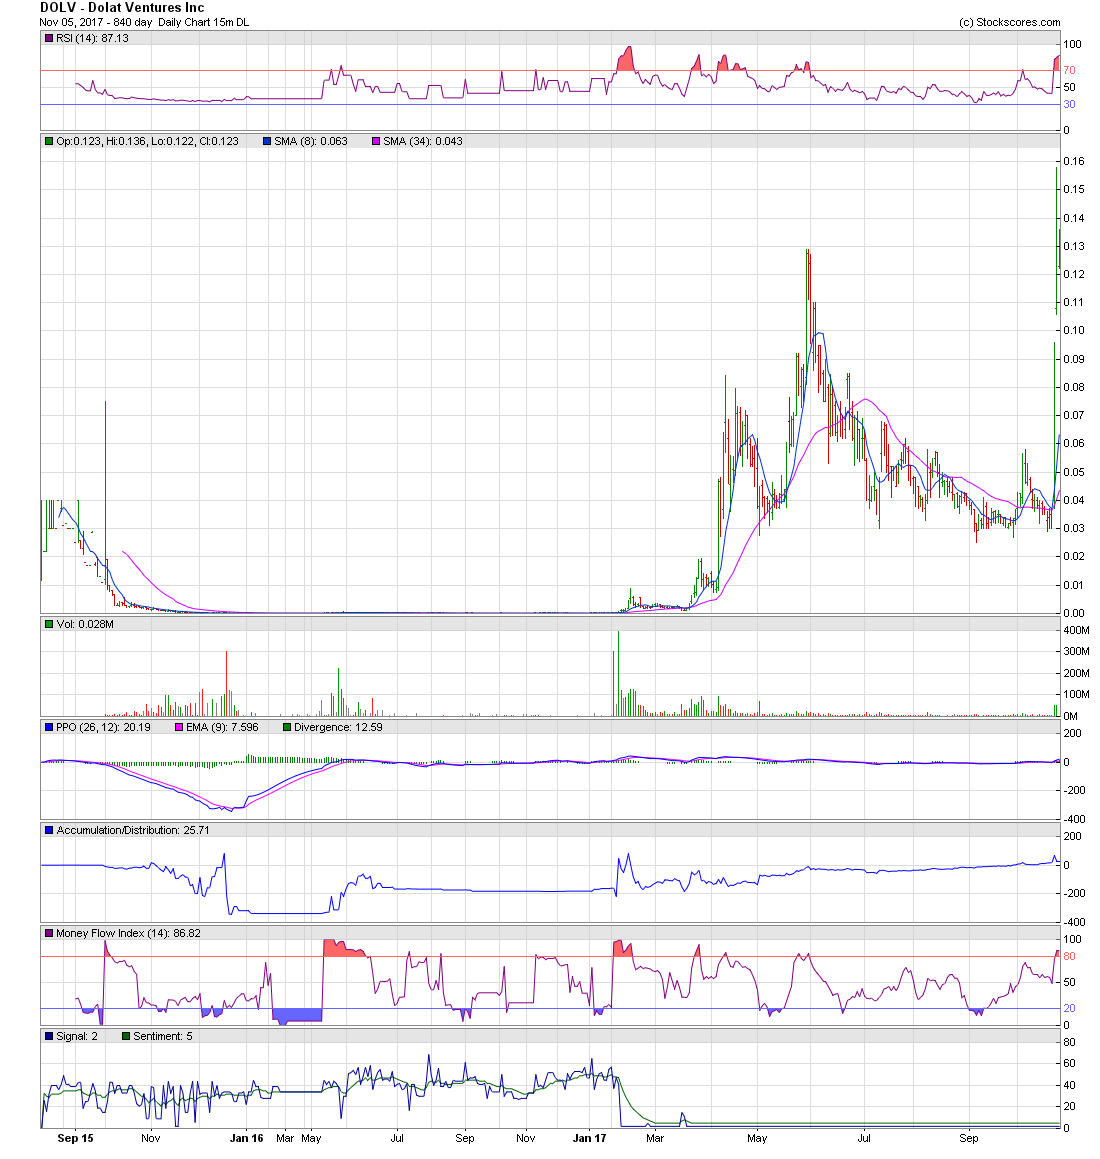
ADTM - Merger Runner like DOLV ADTM - Setting-Up to Run like DOLV DOLV - Alerted at 0.0002 Climbs to $0.158 https://investorshub.advfn.com/boards/read_msg.aspx?message_id=136148662 https://investorshub.advfn.com/boards/read_msg.aspx?message_id=135667977 https://investorshub.advfn.com/boards/read_msg.aspx?message_id=135667740 https://investorshub.advfn.com/boards/read_msg.aspx?message_id=133937728 https://investorshub.advfn.com/boards/read_msg.aspx?message_id=133937736 https://investorshub.advfn.com/boards/read_msg.aspx?message_id=133392965 https://investorshub.advfn.com/boards/read_msg.aspx?message_id=133335752 https://investorshub.advfn.com/boards/read_msg.aspx?message_id=133335779 https://investorshub.advfn.com/boards/read_msg.aspx?message_id=131775192 https://investorshub.advfn.com/boards/read_msg.aspx?message_id=131775206 https://investorshub.advfn.com/boards/read_msg.aspx?message_id=130987399 http://investorshub.advfn.com/boards/read_msg.aspx?message_id=129862971 http://investorshub.advfn.com/boards/read_msg.aspx?message_id=128711004 http://investorshub.advfn.com/boards/read_msg.aspx?message_id=128710808 _________________________________________________________________ ADTM - At "Apex" of Symmetrical Triangle https://investorshub.advfn.com/boards/read_msg.aspx?message_id=140685168 Symmetrical triangles are usually continuation patterns with converging trend lines. Ideally, a stock breaks out from a symmetrical triangle prior to reaching the apex of the triangle with volume expansion. http://stockcharts.com/school/doku.php?id=chart_school:chart_analysis:chart_patterns:symmetrical_triangle_continuation http://thestockbandit.com/symmetrical-triangle/ http://thepatternsite.com/st.html https://investorshub.advfn.com/uimage/uploads/2017/2/15/tfrceSymmetrical_Triangle_1.png https://investorshub.advfn.com/uimage/uploads/2017/3/25/iovjbDOLV_March_24_Chart_4.png https://www.stockscores.com/chart.asp?TickerSymbol=ADTM&TimeRange=540&Interval=w&Volume=1&ChartType=OHLC&Stockscores=1&ChartWidth=1100&ChartHeight=480&LogScale=None&Band=None&avgType1=SMA&movAvg1=8&avgType2=SMA&movAvg2=34&Indicator1=RSI&Indicator2=PPO&Indicator3=AccDist&Indicator4=MFI&endDate=&CompareWith=&entryPrice=&stopLossPrice= https://investorshub.advfn.com/uimage/uploads/2017/2/15/tfrceSymmetrical_Triangle_1.png https://investorshub.advfn.com/uimage/uploads/2017/3/25/iovjbDOLV_March_24_Chart_4.png https://www.stockscores.com/chart.asp?TickerSymbol=ADTM&TimeRange=480&Interval=d&Volume=1&ChartType=OHLC&Stockscores=1&ChartWidth=1100&ChartHeight=480&LogScale=None&Band=None&avgType1=SMA&movAvg1=8&avgType2=SMA&movAvg2=34&Indicator1=RSI&Indicator2=PPO&Indicator3=AccDist&Indicator4=MFI&endDate=&CompareWith=&entryPrice=&stopLossPrice= _________________________________________________________________ ADTM - DOLV - Cup-with-Handle Chart Plays DOLV - "I can lead a horse to water, but I can't make him drink" ! DOLV - Alerted at 0.0002 Climbs to $0.158 https://investorshub.advfn.com/boards/read_msg.aspx?message_id=140213093 ________________________________________________________________ The Cup-with-Handle Chart Play ADTM - Our Feature Play ADTM - Live! Charts shown Learn How to Recognize its Pattern ! Profit by it https://investorshub.advfn.com/uimage/uploads/2018/3/7/volysMoney.jpg investorshub.advfn.com/uimage/uploads/2018/3/8/hygjbCoffee_Cup_to_show_Cup_with_Handle_to_use__for_ADTM.png ________________________________________________________________ https://investorshub.advfn.com/uicon/155361.png?cb=636360310707230000 * The Market is a "Forward-Looking Mechanism" * Traders move the Price of the stock Down 6-to-9 months in advance, to a Price Level that is seen as, a "Point of Maximum Opportunity" and "Fairly Valued". https://investorshub.advfn.com/uimage/uploads/2017/5/27/zjpwmPoint_of_Maximum_Financial_Opportunity.gif Cup with Handle (Continuation) http://stockcharts.com http://thepatternsite.com/cup.html http://thestockbandit.com/cup-handle/ https://d.stockcharts.com/school/data/media/chart_school/chart_analysis/chart_patterns/cuphandle-jbl.png https://www.stockscores.com/charts/charts/?ticker=ADTM ADTM - Live! Chart https://investorshub.advfn.com/uimage/uploads/2017/5/1/amcpgDOLV_May_1_Chart_1.png https://www.stockscores.com/chart.asp?TickerSymbol=ADTM&TimeRange=690&Interval=d&Volume=1&ChartType=OHLC&Stockscores=1&ChartWidth=1100&ChartHeight=480&LogScale=None&Band=None&avgType1=SMA&movAvg1=8&avgType2=SMA&movAvg2=34&Indicator1=RSI&Indicator2=PPO&Indicator3=AccDist&Indicator4=MFI&endDate=&CompareWith=&entryPrice=&stopLossPrice= https://investorshub.advfn.com/uimage/uploads/2017/5/31/gvpodDOLV_May_30_Chart_1.png https://www.stockscores.com/chart.asp?TickerSymbol=ADTM&TimeRange=690&Interval=d&Volume=1&ChartType=OHLC&Stockscores=1&ChartWidth=1100&ChartHeight=480&LogScale=None&Band=None&avgType1=SMA&movAvg1=8&avgType2=SMA&movAvg2=34&Indicator1=RSI&Indicator2=PPO&Indicator3=AccDist&Indicator4=MFI&endDate=&CompareWith=&entryPrice=&stopLossPrice= https://investorshub.advfn.com/uimage/uploads/2017/11/5/npxvlDOLV_Nov_5_Daily_Chart_1.png https://www.stockscores.com/chart.asp?TickerSymbol=ADTM&TimeRange=690&Interval=d&Volume=1&ChartType=OHLC&Stockscores=1&ChartWidth=1100&ChartHeight=480&LogScale=None&Band=None&avgType1=SMA&movAvg1=8&avgType2=SMA&movAvg2=34&Indicator1=RSI&Indicator2=PPO&Indicator3=AccDist&Indicator4=MFI&endDate=&CompareWith=&entryPrice=&stopLossPrice= https://investorshub.advfn.com/uicon/155361.png?cb=636360310707230000
 Market Data
  Markets