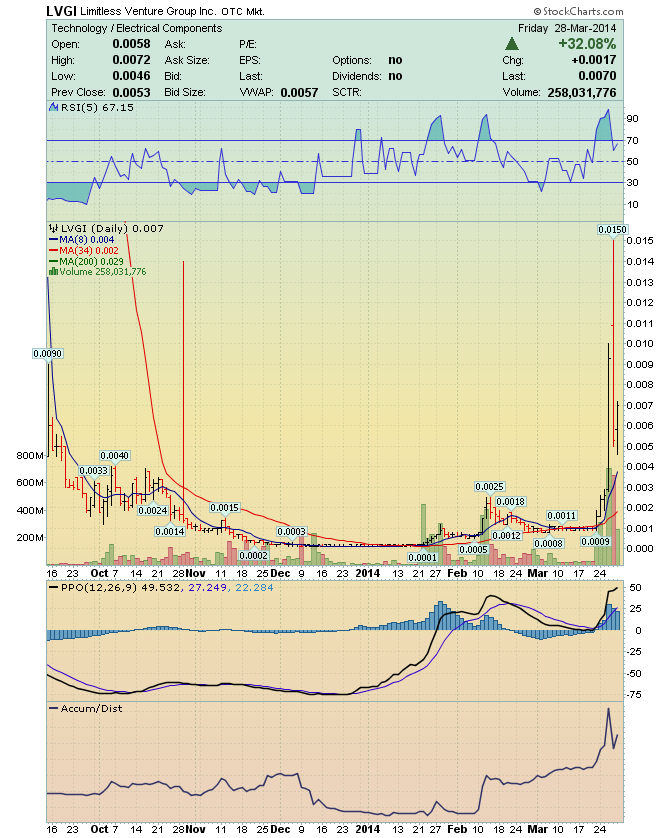
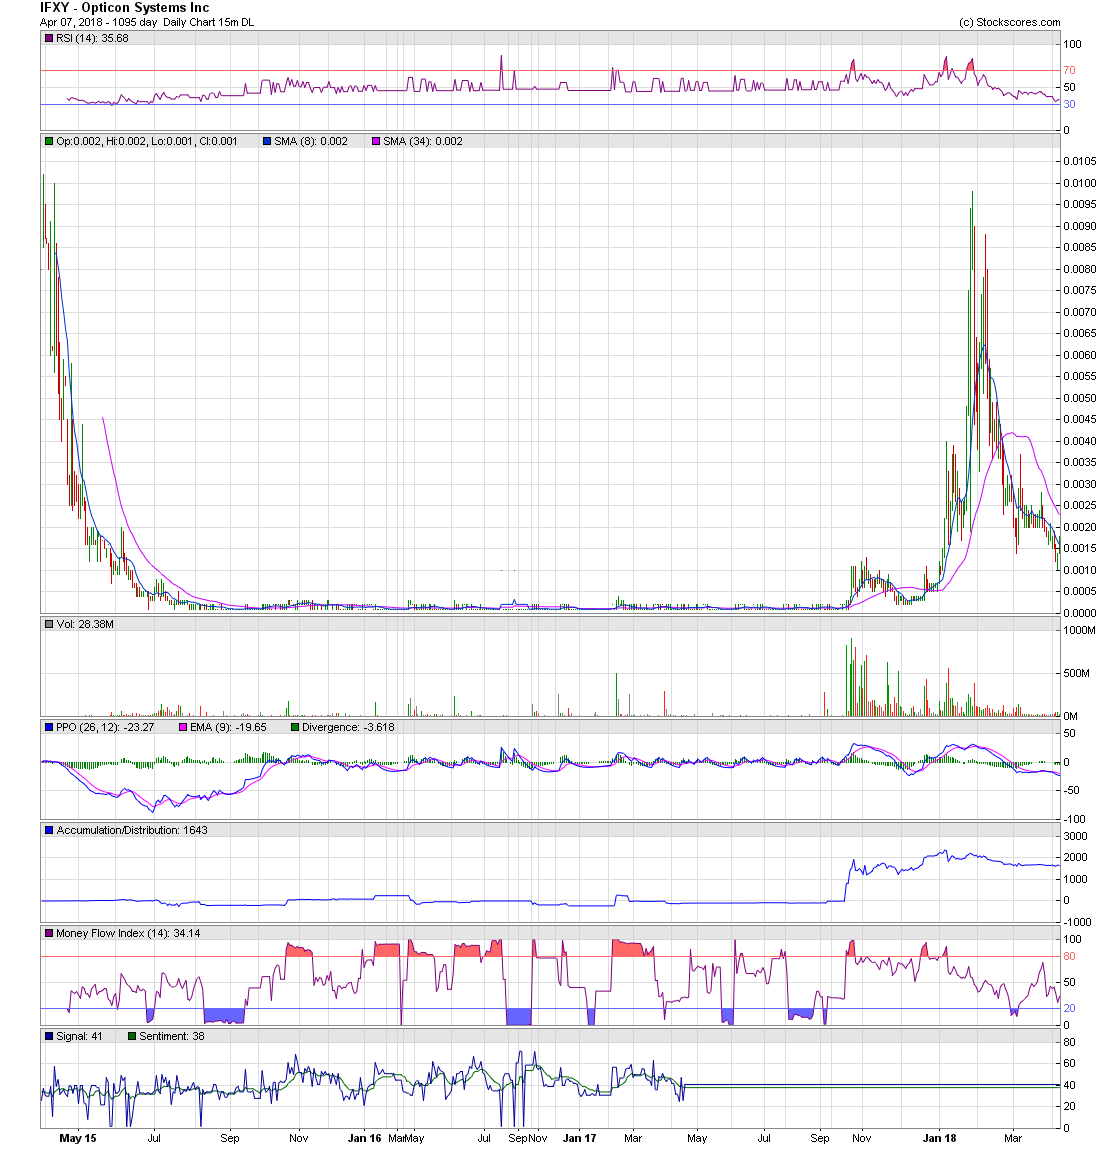
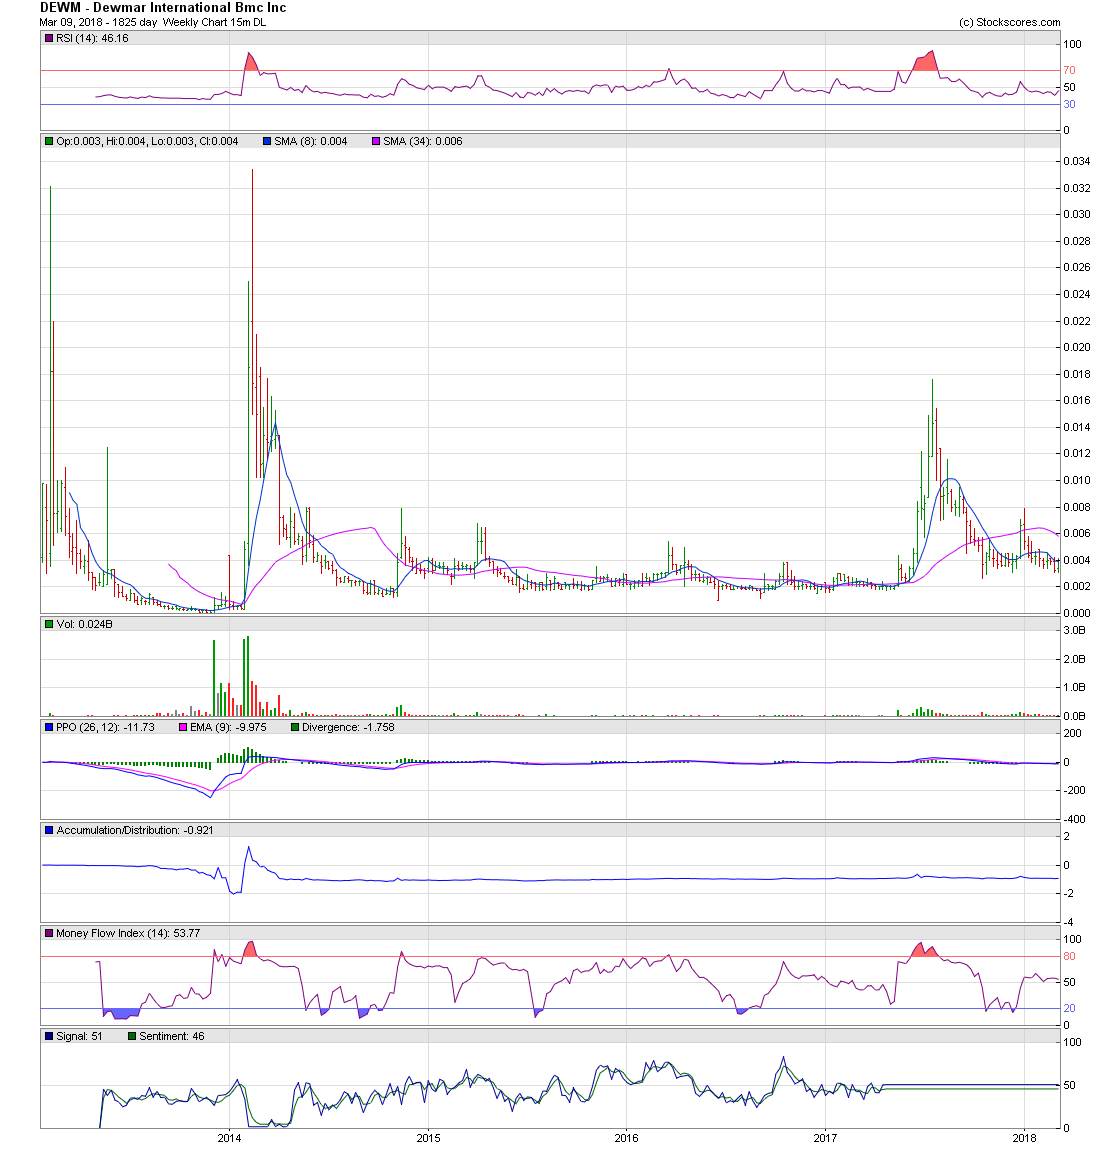
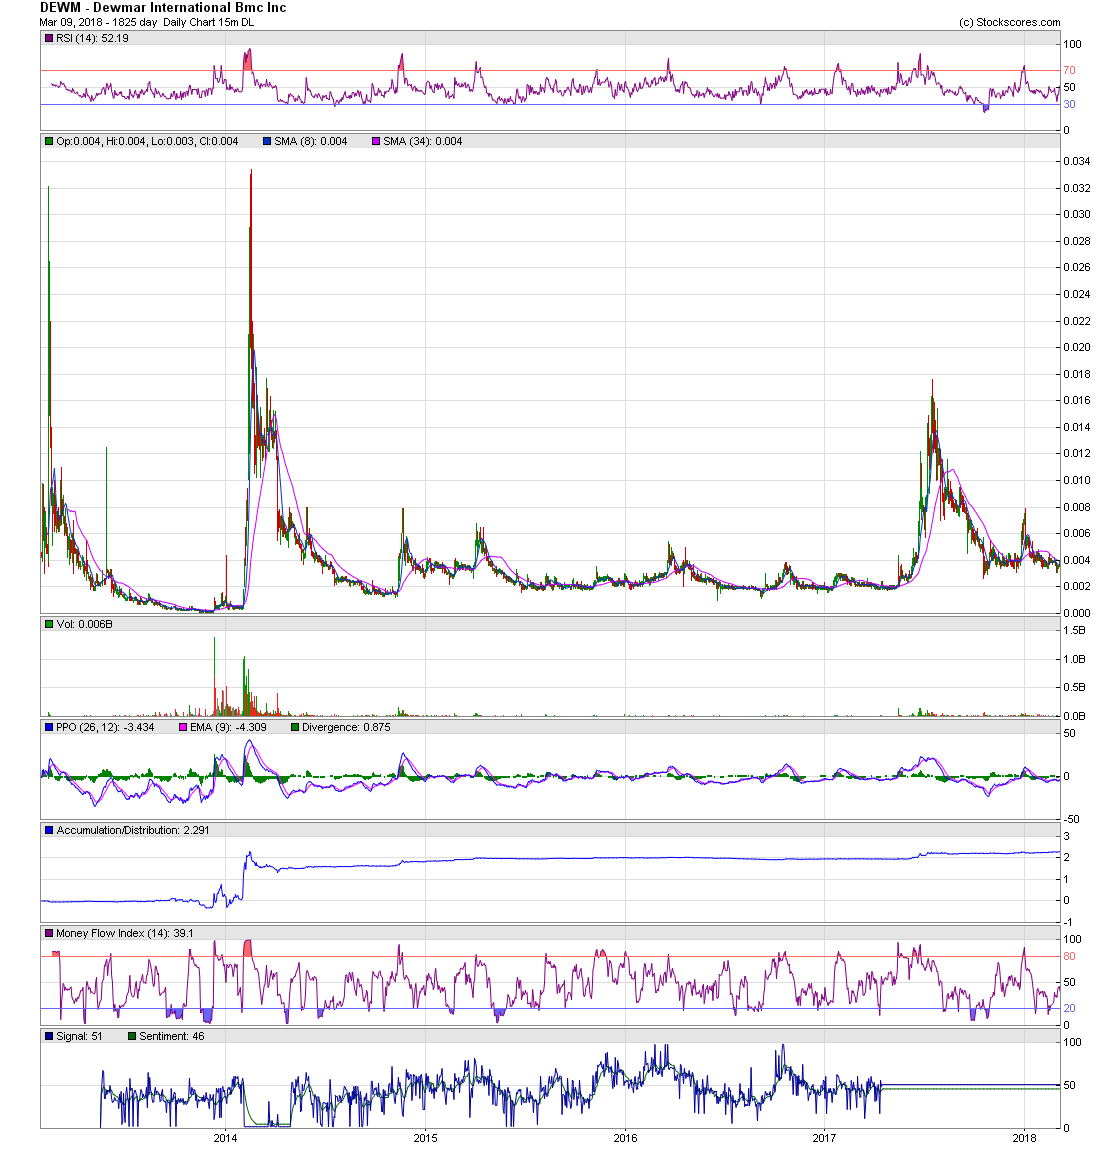
The Cup-with-Handle Chart Play ADTM - Our Feature Play ADTM - Live! Charts shown Learn How to Recognize its Pattern ! Profit by it https://investorshub.advfn.com/uimage/uploads/2018/3/7/volysMoney.jpg investorshub.advfn.com/uimage/uploads/2018/3/8/hygjbCoffee_Cup_to_show_Cup_with_Handle_to_use__for_ADTM.png ________________________________________________________________ https://investorshub.advfn.com/uicon/155361.png?cb=636360310707230000 * The Market is a "Forward-Looking Mechanism" * Traders move the Price of the stock Down 6-to-9 months in advance, to a Price Level that is seen as, a "Point of Maximum Opportunity" and "Fairly Valued". https://investorshub.advfn.com/uimage/uploads/2017/5/27/zjpwmPoint_of_Maximum_Financial_Opportunity.gif Cup with Handle (Continuation) http://stockcharts.com http://thepatternsite.com/cup.html http://thestockbandit.com/cup-handle/ https://d.stockcharts.com/school/data/media/chart_school/chart_analysis/chart_patterns/cuphandle-jbl.png https://www.stockscores.com/charts/charts/?ticker=ADTM ADTM - Live! Chart https://www.stockscores.com/chart.asp?TickerSymbol=ADTM&TimeRange=660&Interval=d&Volume=1&ChartType=OHLC&Stockscores=1&ChartWidth=1100&ChartHeight=480&LogScale=None&Band=None&avgType1=SMA&movAvg1=8&avgType2=SMA&movAvg2=34&Indicator1=RSI&Indicator2=PPO&Indicator3=AccDist&Indicator4=MFI&endDate=&CompareWith=&entryPrice=&stopLossPrice= https://investorshub.advfn.com/uimage/uploads/2014/3/29/jzzwvLVGI_Chart_5_climbs_to_0.015.png https://www.stockscores.com/chart.asp?TickerSymbol=ADTM&TimeRange=660&Interval=d&Volume=1&ChartType=OHLC&Stockscores=1&ChartWidth=1100&ChartHeight=480&LogScale=None&Band=None&avgType1=SMA&movAvg1=8&avgType2=SMA&movAvg2=34&Indicator1=RSI&Indicator2=PPO&Indicator3=AccDist&Indicator4=MFI&endDate=&CompareWith=&entryPrice=&stopLossPrice= https://investorshub.advfn.com/uimage/uploads/2018/4/7/sydjzIFXY_Apr_7_Chart_1_Daily.png https://www.stockscores.com/chart.asp?TickerSymbol=ADTM&TimeRange=660&Interval=d&Volume=1&ChartType=OHLC&Stockscores=1&ChartWidth=1100&ChartHeight=480&LogScale=None&Band=None&avgType1=SMA&movAvg1=8&avgType2=SMA&movAvg2=34&Indicator1=RSI&Indicator2=PPO&Indicator3=AccDist&Indicator4=MFI&endDate=&CompareWith=&entryPrice=&stopLossPrice= https://investorshub.advfn.com/uimage/uploads/2018/4/7/zupx[IFXY_Apr_7_Weekly_Chart_1_is_like_ADTM_Apr_7_Weekly_Chart.png https://www.stockscores.com/chart.asp?TickerSymbol=ADTM&TimeRange=660&Interval=w&Volume=1&ChartType=OHLC&Stockscores=1&ChartWidth=1100&ChartHeight=480&LogScale=None&Band=None&avgType1=SMA&movAvg1=8&avgType2=SMA&movAvg2=34&Indicator1=RSI&Indicator2=PPO&Indicator3=AccDist&Indicator4=MFI&endDate=&CompareWith=&entryPrice=&stopLossPrice= investorshub.advfn.com/uimage/uploads/2018/3/9/whngeDEWM_Mar_9_Weekly_Chart_2.png https://www.stockscores.com/chart.asp?TickerSymbol=ADTM&TimeRange=660&Interval=w&Volume=1&ChartType=OHLC&Stockscores=1&ChartWidth=1100&ChartHeight=480&LogScale=None&Band=None&avgType1=SMA&movAvg1=8&avgType2=SMA&movAvg2=34&Indicator1=RSI&Indicator2=PPO&Indicator3=AccDist&Indicator4=MFI&endDate=&CompareWith=&entryPrice=&stopLossPrice= investorshub.advfn.com/uimage/uploads/2018/3/9/ufslgDEWM_Mar_9_Chart_1.png https://www.stockscores.com/chart.asp?TickerSymbol=ADTM&TimeRange=660&Interval=d&Volume=1&ChartType=OHLC&Stockscores=1&ChartWidth=1100&ChartHeight=480&LogScale=None&Band=None&avgType1=SMA&movAvg1=8&avgType2=SMA&movAvg2=34&Indicator1=RSI&Indicator2=PPO&Indicator3=AccDist&Indicator4=MFI&endDate=&CompareWith=&entryPrice=&stopLossPrice= https://investorshub.advfn.com/uimage/uploads/2017/5/1/amcpgDOLV_May_1_Chart_1.png https://www.stockscores.com/chart.asp?TickerSymbol=ADTM&TimeRange=660&Interval=d&Volume=1&ChartType=OHLC&Stockscores=1&ChartWidth=1100&ChartHeight=480&LogScale=None&Band=None&avgType1=SMA&movAvg1=8&avgType2=SMA&movAvg2=34&Indicator1=RSI&Indicator2=PPO&Indicator3=AccDist&Indicator4=MFI&endDate=&CompareWith=&entryPrice=&stopLossPrice= https://investorshub.advfn.com/uimage/uploads/2017/1/2/duvccSPCL_Jan_2_Chart_1.png https://www.stockscores.com/chart.asp?TickerSymbol=ADTM&TimeRange=660&Interval=d&Volume=1&ChartType=OHLC&Stockscores=1&ChartWidth=1100&ChartHeight=480&LogScale=None&Band=None&avgType1=SMA&movAvg1=8&avgType2=SMA&movAvg2=34&Indicator1=RSI&Indicator2=PPO&Indicator3=AccDist&Indicator4=MFI&endDate=&CompareWith=&entryPrice=&stopLossPrice= https://investorshub.advfn.com/uimage/uploads/2017/1/7/fqa[nICNB_Jan_7_Chart_1.png https://www.stockscores.com/chart.asp?TickerSymbol=ADTM&TimeRange=660&Interval=d&Volume=1&ChartType=OHLC&Stockscores=1&ChartWidth=1100&ChartHeight=480&LogScale=None&Band=None&avgType1=SMA&movAvg1=8&avgType2=SMA&movAvg2=34&Indicator1=RSI&Indicator2=PPO&Indicator3=AccDist&Indicator4=MFI&endDate=&CompareWith=&entryPrice=&stopLossPrice= https://investorshub.advfn.com/uimage/uploads/2017/1/14/zqaqkERFB_Jan_14_Chart_1.png https://www.stockscores.com/chart.asp?TickerSymbol=ADTM&TimeRange=660&Interval=d&Volume=1&ChartType=OHLC&Stockscores=1&ChartWidth=1100&ChartHeight=480&LogScale=None&Band=None&avgType1=SMA&movAvg1=8&avgType2=SMA&movAvg2=34&Indicator1=RSI&Indicator2=PPO&Indicator3=AccDist&Indicator4=MFI&endDate=&CompareWith=&entryPrice=&stopLossPrice= https://investorshub.advfn.com/uimage/uploads/2017/3/4/ylckvADHC_Cup_with_Handle_Chart.png https://www.stockscores.com/chart.asp?TickerSymbol=ADTM&TimeRange=660&Interval=d&Volume=1&ChartType=OHLC&Stockscores=1&ChartWidth=1100&ChartHeight=480&LogScale=None&Band=None&avgType1=SMA&movAvg1=8&avgType2=SMA&movAvg2=34&Indicator1=RSI&Indicator2=PPO&Indicator3=AccDist&Indicator4=MFI&endDate=&CompareWith=&entryPrice=&stopLossPrice= https://investorshub.advfn.com/uicon/155361.png?cb=636360310707230000
 Market Data
  Markets