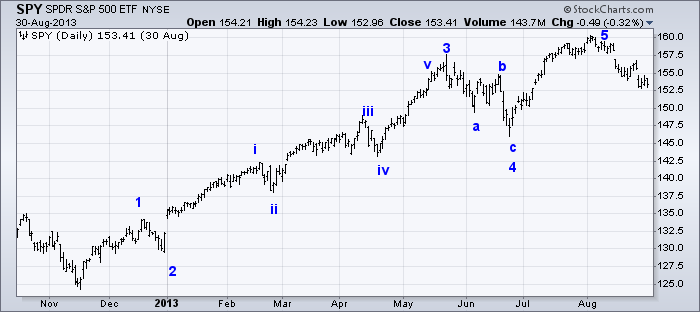
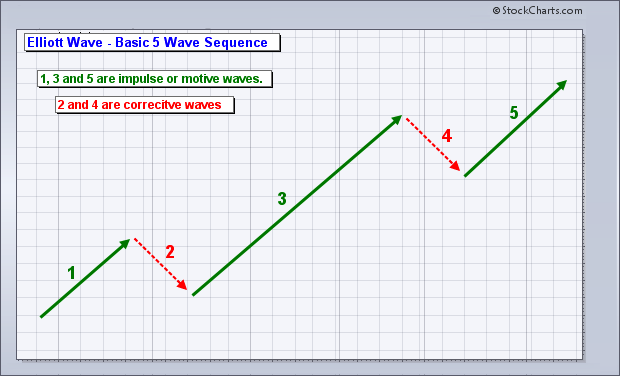
RNWF - BLLB RNWF - Elliott Wave-5 Coming - Got Tickets? I can show you, better than I can tell you ! RNWF - BLLB - Comparison Chart Analysis https://investorshub.advfn.com/uicon/155361.png?cb=636360310707230000 Buy after an Elliott Wave 5-Wave Decline https://investorshub.advfn.com/boards/read_msg.aspx?message_id=135552097 Elliott Wave Basics http://investorshub.advfn.com/boards/read_msg.aspx?message_id=113103065 Elliott Wave Principle http://www.forexhit.com/learn-forex/elliott-wave-principle.html Elliott Wave Theory http://ta.mql4.com/elliott_wave_theory Buy after an Elliott Wave, 5-Wave decline sequence ! A Basic "A,B,C Corrective Wave" Buy, ONLY when the stocks price, is trading under the Blue 8-day M.A. when the Blue 8-day M.A. is under the Red 34-day M.A. _________________________________________________________________ https://investorshub.advfn.com/uimage/uploads/2018/1/20/orvccElliott_Wave_Example_1_with_Wave_Count_shown.png https://investorshub.advfn.com/uimage/uploads/2018/1/20/fofsgElliott_Wave_Basic_5_Wave_Sequence.png https://d.stockcharts.com/school/data/media/chart_school/market_analysis/elliott_wave_theory/ew_basics/ewb-05-thewup.png https://www.stockscores.com/chart.asp?TickerSymbol=BLLB&TimeRange=600&Interval=d&Volume=1&ChartType=OHLC&Stockscores=1&ChartWidth=1100&ChartHeight=480&LogScale=None&Band=None&avgType1=SMA&movAvg1=8&avgType2=SMA&movAvg2=34&Indicator1=RSI&Indicator2=PPO&Indicator3=AccDist&Indicator4=MFI&endDate=&CompareWith=&entryPrice=&stopLossPrice= https://www.stockscores.com/chart.asp?TickerSymbol=RNWF&TimeRange=720&Interval=d&Volume=1&ChartType=OHLC&Stockscores=1&ChartWidth=1100&ChartHeight=480&LogScale=None&Band=None&avgType1=SMA&movAvg1=8&avgType2=SMA&movAvg2=34&Indicator1=RSI&Indicator2=PPO&Indicator3=AccDist&Indicator4=MFI&endDate=&CompareWith=&entryPrice=&stopLossPrice= https://www.stockscores.com/chart.asp?TickerSymbol=BLLB&TimeRange=1825&Interval=d&Volume=1&ChartType=OHLC&Stockscores=1&ChartWidth=1100&ChartHeight=480&LogScale=None&Band=None&avgType1=SMA&movAvg1=8&avgType2=SMA&movAvg2=34&Indicator1=RSI&Indicator2=PPO&Indicator3=AccDist&Indicator4=MFI&endDate=&CompareWith=&entryPrice=&stopLossPrice= https://www.stockscores.com/chart.asp?TickerSymbol=RNWF&TimeRange=1825&Interval=d&Volume=1&ChartType=OHLC&Stockscores=1&ChartWidth=1100&ChartHeight=480&LogScale=None&Band=None&avgType1=SMA&movAvg1=8&avgType2=SMA&movAvg2=34&Indicator1=RSI&Indicator2=PPO&Indicator3=AccDist&Indicator4=MFI&endDate=&CompareWith=&entryPrice=&stopLossPrice= https://www.stockscores.com/chart.asp?TickerSymbol=BLLB&TimeRange=1825&Interval=w&Volume=1&ChartType=OHLC&Stockscores=1&ChartWidth=1100&ChartHeight=480&LogScale=None&Band=None&avgType1=SMA&movAvg1=8&avgType2=SMA&movAvg2=34&Indicator1=RSI&Indicator2=PPO&Indicator3=AccDist&Indicator4=MFI&endDate=&CompareWith=&entryPrice=&stopLossPrice= https://www.stockscores.com/chart.asp?TickerSymbol=RNWF&TimeRange=1825&Interval=w&Volume=1&ChartType=OHLC&Stockscores=1&ChartWidth=1100&ChartHeight=480&LogScale=None&Band=None&avgType1=SMA&movAvg1=8&avgType2=SMA&movAvg2=34&Indicator1=RSI&Indicator2=PPO&Indicator3=AccDist&Indicator4=MFI&endDate=&CompareWith=&entryPrice=&stopLossPrice=
 Market Data
  Markets