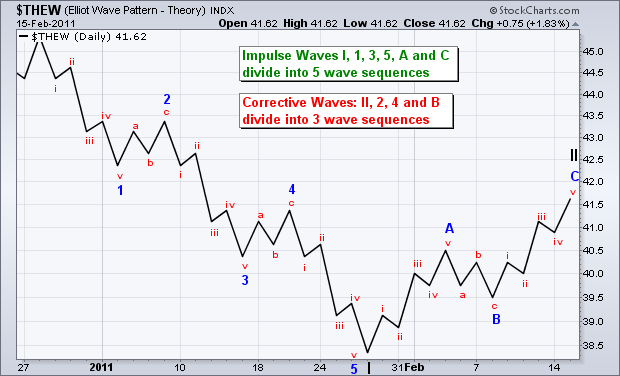
IFLM - BLLB - BUY after an Elliott 5-Wave Decline http://www.otcmarkets.com/stock/BLLB/profile http://www.allotcbb.com/quote.php?symbol=BLLB https://www.barchart.com/stocks/quotes/BLLB http://www.investorpoint.com/stock/BLLB-Bell+Buckle+Hldgs+Inc/price-history/ http://www.stockscores.com/quickreport.asp?ticker=BLLB&x=0&y=0 http://www.otcmarkets.com/stock/IFLM/profile http://www.allotcbb.com/quote.php?symbol=IFLM https://www.barchart.com/stocks/quotes/IFLM http://www.investorpoint.com/stock/IFLM-Independent+Film+Development+Corp/price-history/ http://www.stockscores.com/quickreport.asp?ticker=IFLM&x=0&y=0 _______________________________________________________________ Buy after an Elliott Wave 5-Wave Decline https://investorshub.advfn.com/boards/read_msg.aspx?message_id=133040947 https://investorshub.advfn.com/boards/read_msg.aspx?message_id=131958679 https://investorshub.advfn.com/uimage/uploads/2017/5/24/bhbbwElliott_Wave_Chart.png http://www.stockscores.com/chart.asp?TickerSymbol=BLLB&TimeRange=1825&Interval=d&Volume=1&ChartType=OHLC&Stockscores=1&ChartWidth=830&ChartHeight=500&LogScale=None&Band=None&avgType1=SMA&movAvg1=8&avgType2=SMA&movAvg2=34&Indicator1=RSI&Indicator2=PPO&Indicator3=AccDist&Indicator4=MFI&endDate=&CompareWith=&entryPrice=&stopLossPrice= http://www.stockscores.com/chart.asp?TickerSymbol=IFLM&TimeRange=365&Interval=d&Volume=1&ChartType=OHLC&Stockscores=1&ChartWidth=830&ChartHeight=500&LogScale=None&Band=None&avgType1=SMA&movAvg1=8&avgType2=SMA&movAvg2=34&Indicator1=RSI&Indicator2=PPO&Indicator3=AccDist&Indicator4=MFI&endDate=&CompareWith=&entryPrice=&stopLossPrice= https://investorshub.advfn.com/uimage/uploads/2017/5/24/bhbbwElliott_Wave_Chart.png https://www.stockscores.com/chart.asp?TickerSymbol=BLLB&TimeRange=720&Interval=d&Volume=1&ChartType=OHLC&Stockscores=1&ChartWidth=830&ChartHeight=500&LogScale=None&Band=None&avgType1=SMA&movAvg1=8&avgType2=SMA&movAvg2=34&Indicator1=RSI&Indicator2=PPO&Indicator3=AccDist&Indicator4=MFI&endDate=&CompareWith=&entryPrice=&stopLossPrice= https://www.stockscores.com/chart.asp?TickerSymbol=IFLM&TimeRange=365&Interval=d&Volume=1&ChartType=OHLC&Stockscores=1&ChartWidth=830&ChartHeight=500&LogScale=None&Band=None&avgType1=SMA&movAvg1=8&avgType2=SMA&movAvg2=34&Indicator1=RSI&Indicator2=PPO&Indicator3=AccDist&Indicator4=MFI&endDate=&CompareWith=&entryPrice=&stopLossPrice=
 Market Data
  Markets