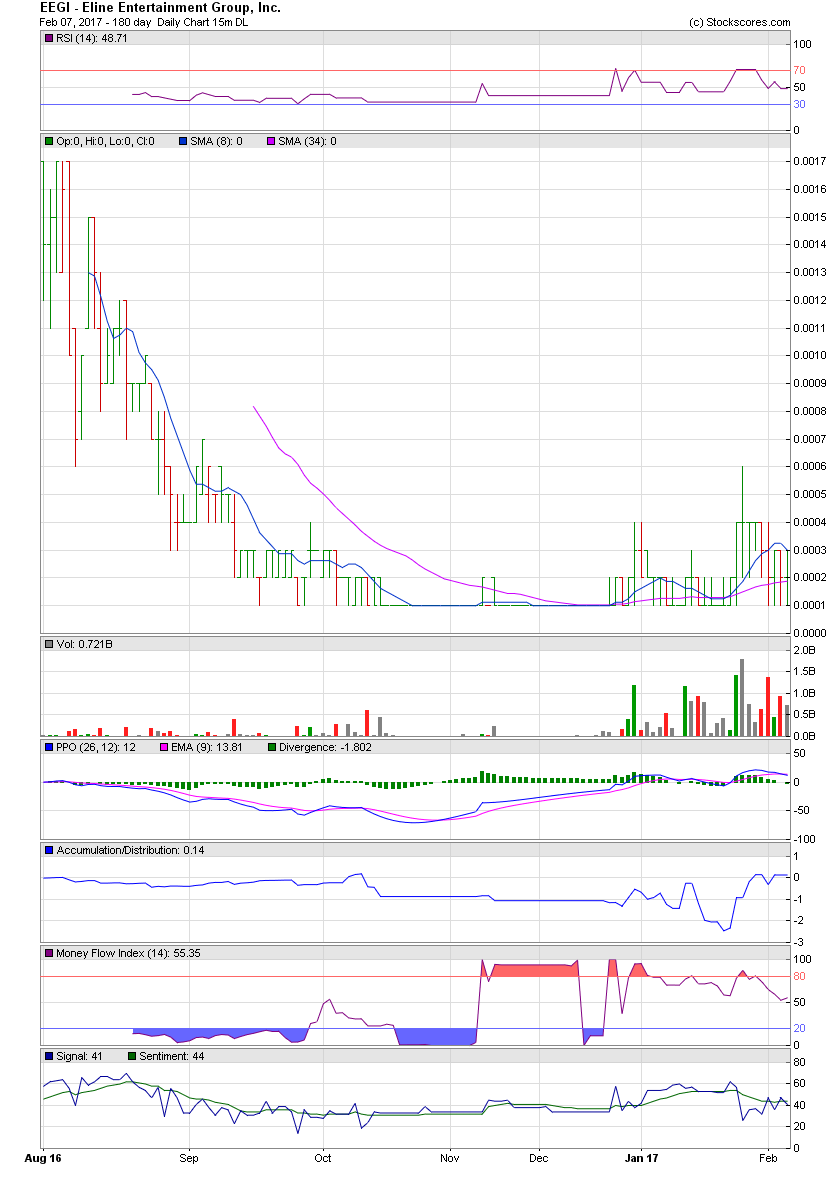
IFLM - EEGI EEGI - Alerted at 0.0001 - Climbs to 0.0006 https://investorshub.advfn.com/boards/read_msg.aspx?message_id=128484262&txt2find=EEGI IFLM - Charts / News / Targets https://investorshub.advfn.com/boards/read_msg.aspx?message_id=131521742 ________________________________________________________________ EEGI http://www.investorpoint.com/stock/EEGI-Eline+Entmt+Group+Inc/price-history/ http://www.stockscores.com/quickreport.asp?ticker=eegi&x=0&y=0 IFLM http://www.investorpoint.com/stock/IFLM-Independent+Film+Development+Corp/price-history/ http://www.stockscores.com/quickreport.asp?ticker=iflm&x=0&y=0 ________________________________________________________________ http://www.stockscores.com/chart.asp?TickerSymbol=EEGI&TimeRange=365&Interval=w&Volume=1&ChartType=OHLC&Stockscores=1&ChartWidth=830&ChartHeight=500&LogScale=None&Band=None&avgType1=SMA&movAvg1=8&avgType2=SMA&movAvg2=34&Indicator1=RSI&Indicator2=PPO&Indicator3=AccDist&Indicator4=MFI&endDate=&CompareWith=&entryPrice=&stopLossPrice= http://www.stockscores.com/chart.asp?TickerSymbol=IFLM&TimeRange=365&Interval=w&Volume=1&ChartType=OHLC&Stockscores=1&ChartWidth=830&ChartHeight=500&LogScale=None&Band=None&avgType1=SMA&movAvg1=8&avgType2=SMA&movAvg2=34&Indicator1=RSI&Indicator2=PPO&Indicator3=AccDist&Indicator4=MFI&endDate=&CompareWith=&entryPrice=&stopLossPrice= https://www.stockscores.com/chart.asp?TickerSymbol=EEGI&TimeRange=365&Interval=d&Volume=1&ChartType=OHLC&Stockscores=1&ChartWidth=830&ChartHeight=500&LogScale=None&Band=None&avgType1=SMA&movAvg1=8&avgType2=SMA&movAvg2=34&Indicator1=RSI&Indicator2=PPO&Indicator3=AccDist&Indicator4=MFI&endDate=&CompareWith=&entryPrice=&stopLossPrice= https://www.stockscores.com/chart.asp?TickerSymbol=IFLM&TimeRange=365&Interval=d&Volume=1&ChartType=OHLC&Stockscores=1&ChartWidth=830&ChartHeight=500&LogScale=None&Band=None&avgType1=SMA&movAvg1=8&avgType2=SMA&movAvg2=34&Indicator1=RSI&Indicator2=PPO&Indicator3=AccDist&Indicator4=MFI&endDate=&CompareWith=&entryPrice=&stopLossPrice= https://investorshub.advfn.com/uimage/uploads/2017/2/7/pjluuEEGI_Feb_7_Chart_1.png https://www.stockscores.com/chart.asp?TickerSymbol=IFLM&TimeRange=365&Interval=d&Volume=1&ChartType=OHLC&Stockscores=1&ChartWidth=830&ChartHeight=500&LogScale=None&Band=None&avgType1=SMA&movAvg1=8&avgType2=SMA&movAvg2=34&Indicator1=RSI&Indicator2=PPO&Indicator3=AccDist&Indicator4=MFI&endDate=&CompareWith=&entryPrice=&stopLossPrice= https://investorshub.advfn.com/uimage/uploads/2017/2/7/pjluuEEGI_Feb_7_Chart_1.png Date Open High Low Close Volume 01/30/17 0.0004 0.0004 0.0003 0.0004 328,847,753 01/27/17 0.0004 0.0004 0.0002 0.0004 738,317,342 01/26/17 0.0004 0.0006 0.0002 0.0004 1,796,074,112 01/25/17 0.00015 0.0004 0.0001 0.00035 1,414,040,169 01/24/17 0.0001 0.0002 0.0001 0.0002 129,812,350 01/23/17 0.0001 0.0002 0.000098 0.0001 414,228,600 https://www.stockscores.com/chart.asp?TickerSymbol=IFLM&TimeRange=180&Interval=60&Volume=1&ChartType=OHLC&Stockscores=1&ChartWidth=830&ChartHeight=500&LogScale=None&Band=None&avgType1=SMA&movAvg1=8&avgType2=SMA&movAvg2=34&Indicator1=RSI&Indicator2=PPO&Indicator3=AccDist&Indicator4=MFI&endDate=&CompareWith=&entryPrice=&stopLossPrice=
 Market Data
  Markets