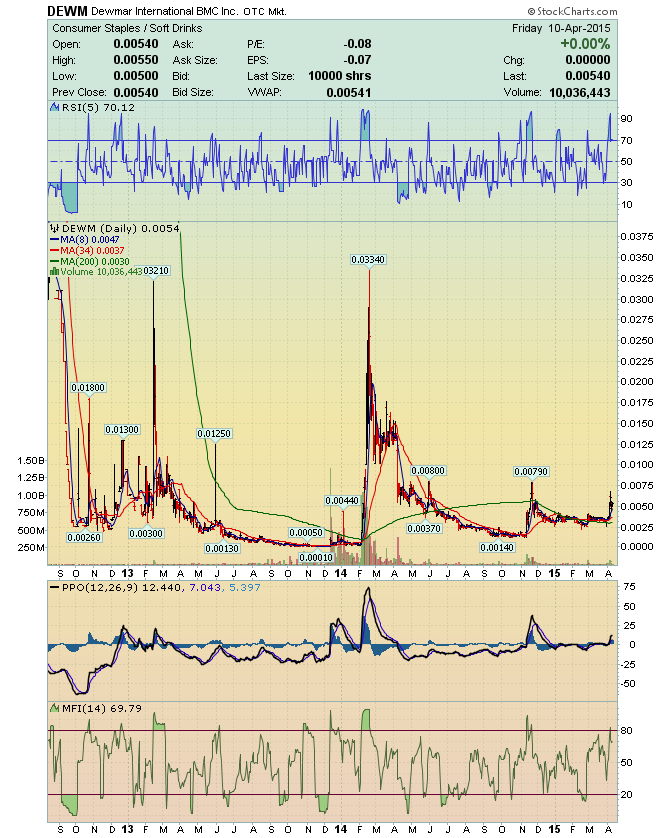
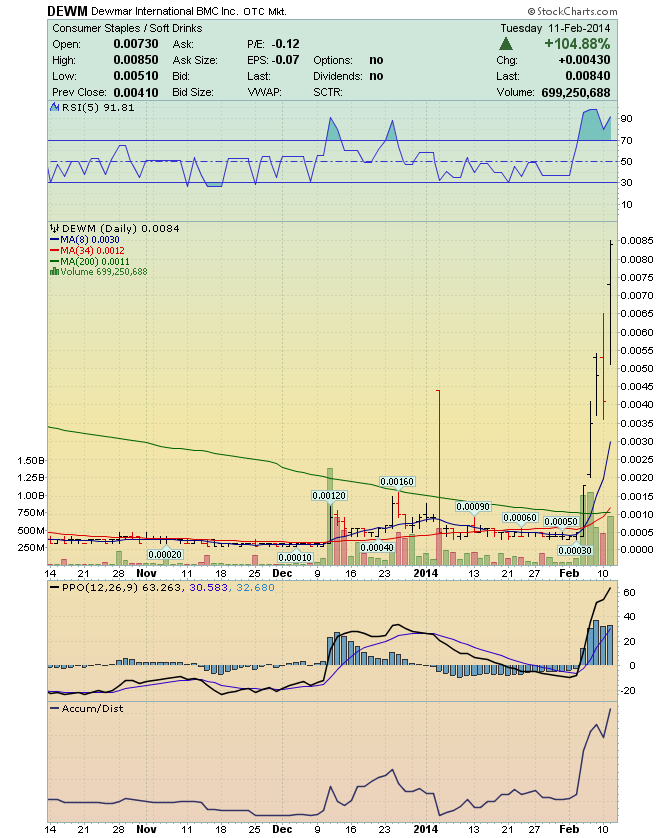
CUBV - Low Float vs Big - DEWM CUBV Can reach $0.024 in 10-Days like DEWM https://investorshub.advfn.com/boards/read_msg.aspx?message_id=130790404 https://investorshub.advfn.com/boards/read_msg.aspx?message_id=130749162 Pink Current Information CUBV Security Details Share Structure Market Value1...........$569,773 a/o May 05, 2017 Authorized Shares..3,000,000,000 a/o Dec 31, 2016 Outstanding Shares 2,294,070,787 a/o Dec 31, 2016 Float................ 330,202,673 a/o Dec 31, 2016 Par Value 0.0001 News / Filings http://www.otcmarkets.com/stock/CUBV/profile http://www.otcmarkets.com/stock/CUBV/news http://www.otcmarkets.com/stock/CUBV/filings http://www.allotcbb.com/quote.php?symbol=cubv Time & Sales / Historical Prices http://www.investorpoint.com/stock/CUBV-Cuba+Beverage+Co/market-makers-level2/ http://www.investorpoint.com/stock/CUBV-Cuba+Beverage+Co/price-history/ ________________________________________________________________ DEWM Security Details Share Structure Market Value1.........$4,609,711 a/o Dec 16, 2016 Authorized Shares..4,500,000,000 a/o Dec 26, 2013 Outstanding Shares 2,426,163,513 a/o Nov 05, 2015 Float.............. 2,225,613,590 a/o Nov 05, 2015 Par Value 0.001 http://www.dewmarinternational.com/ http://www.otcmarkets.com/stock/DEWM/profile ________________________________________________________________ https://investorshub.advfn.com/uimage/uploads/2017/1/13/ekxzlDEWM_Alerted_at_0.0002_October_28_2013.png https://www.stockscores.com/chart.asp?TickerSymbol=CUBV&TimeRange=720&Interval=d&Volume=1&ChartType=OHLC&Stockscores=1&ChartWidth=830&ChartHeight=500&LogScale=None&Band=None&avgType1=SMA&movAvg1=8&avgType2=SMA&movAvg2=34&Indicator1=RSI&Indicator2=PPO&Indicator3=AccDist&Indicator4=MFI&endDate=&CompareWith=&entryPrice=&stopLossPrice= https://investorshub.advfn.com/uimage/uploads/2016/12/18/cezezDEWM_Chart_0.0001.png https://www.stockscores.com/chart.asp?TickerSymbol=CUBV&TimeRange=365&Interval=d&Volume=1&ChartType=OHLC&Stockscores=1&ChartWidth=830&ChartHeight=500&LogScale=None&Band=None&avgType1=SMA&movAvg1=8&avgType2=SMA&movAvg2=34&Indicator1=RSI&Indicator2=PPO&Indicator3=AccDist&Indicator4=MFI&endDate=&CompareWith=&entryPrice=&stopLossPrice=
 Market Data
  Markets