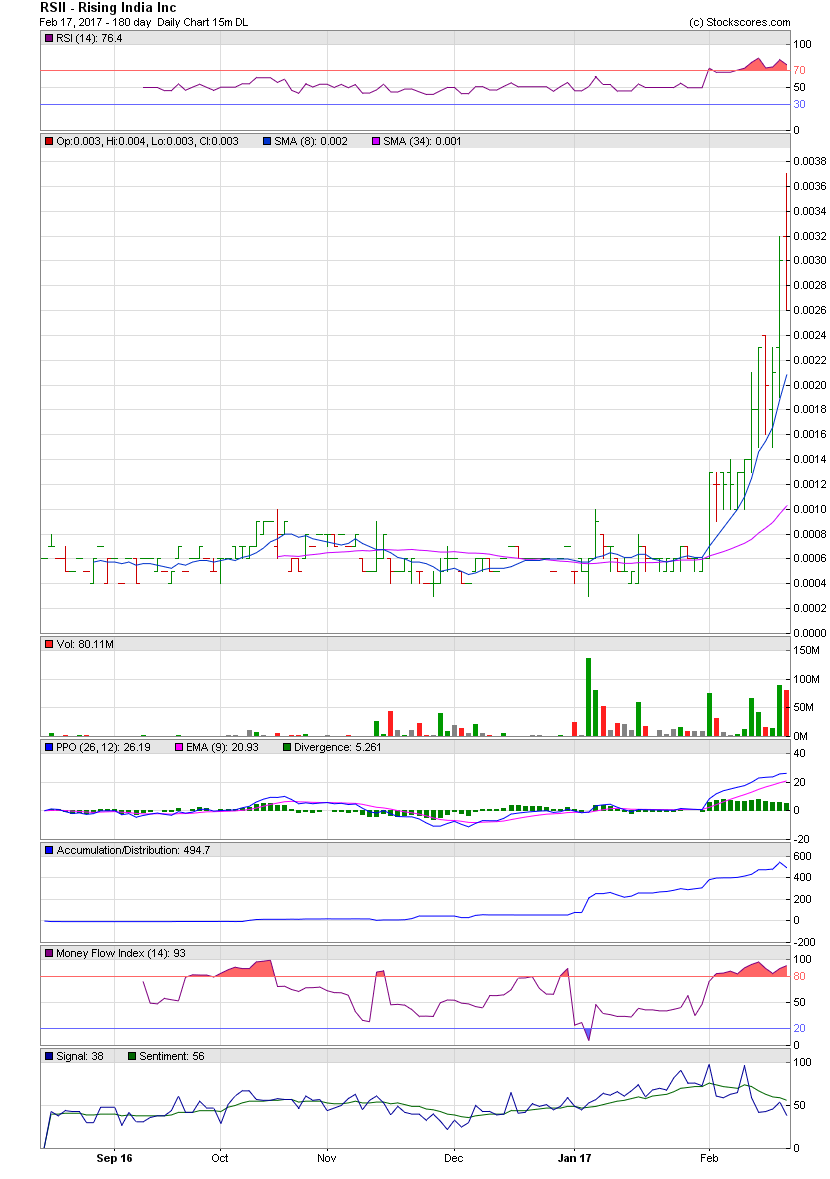
RSII Alerted at 0.0007 - Climbs to $0.029 I'll Alert you of stocks to Buy, before the Run Happens ! Trader53's - Wealth Strategy for 2017 http://investorshub.advfn.com/boards/read_msg.aspx?message_id=127515287 Wealth Strategy: Hit the 0.0002's http://investorshub.advfn.com/boards/read_msg.aspx?message_id=125580980 Educational Post: Trading All OTC stocks http://investorshub.advfn.com/boards/read_msg.aspx?message_id=125559651 Alternative Reporting Pink Current Information RSII Security Details Share Structure Market Value1.......$1,084,007 a/o Feb 16, 2017 Authorized Shares..500,000,000 a/o Jun 30, 2016 Outstanding Shares 387,145,348 a/o Jun 30, 2016 Float.............. 158,396,690 a/o Jun 30, 2016 Par Value 0.001 News / Filings http://www.allotcbb.com/quote.php?symbol=RSII http://www.otcmarkets.com/stock/RSII/profile http://www.otcmarkets.com/stock/RSII/news http://www.otcmarkets.com/stock/RSII/filings Time & Sales / Historical Prices http://www.investorpoint.com/stock/RSII-Rising+India+Inc/market-makers-level2/ http://www.investorpoint.com/stock/RSII-Rising+India+Inc/price-history/ http://shortsqueeze.com/?symbol=RSII&submit=Short+Quote%E2%84%A2 http://otcshortreport.com/?index=RSII&action=view https://www.interactivebrokers.com/en/index.php?key=RSII&cntry=usa&tag=United+States&ib_entity=llc&ln=&asset=&f=4587&conf=am&amref=1 Alerted Tuesday, 11/01/16 RSII 0.00076 - Targets 0.0012 / 0.0014 http://investorshub.advfn.com/boards/read_msg.aspx?message_id=126210481&txt2find=rsii Embedded Chart https://investorshub.advfn.com/uimage/uploads/2017/2/17/anmhhRSII_Feb_16_Chart_1.png investorshub.advfn.com/uimage/uploads/2017/3/1/wpwzvRSII_Feb_28_Chart_1.png Live! Charts https://www.stockscores.com/chart.asp?TickerSymbol=RSII&TimeRange=180&Interval=d&Volume=1&ChartType=OHLC&Stockscores=1&ChartWidth=830&ChartHeight=500&LogScale=None&Band=None&avgType1=SMA&movAvg1=8&avgType2=SMA&movAvg2=34&Indicator1=RSI&Indicator2=PPO&Indicator3=AccDist&Indicator4=MFI&endDate=&CompareWith=&entryPrice=&stopLossPrice= https://www.stockscores.com/chart.asp?TickerSymbol=RSII&TimeRange=365&Interval=d&Volume=1&ChartType=OHLC&Stockscores=1&ChartWidth=830&ChartHeight=500&LogScale=None&Band=None&avgType1=SMA&movAvg1=8&avgType2=SMA&movAvg2=34&Indicator1=RSI&Indicator2=PPO&Indicator3=AccDist&Indicator4=MFI&endDate=&CompareWith=&entryPrice=&stopLossPrice= https://www.stockscores.com/chart.asp?TickerSymbol=RSII&TimeRange=720&Interval=d&Volume=1&ChartType=OHLC&Stockscores=1&ChartWidth=830&ChartHeight=500&LogScale=None&Band=None&avgType1=SMA&movAvg1=8&avgType2=SMA&movAvg2=34&Indicator1=RSI&Indicator2=PPO&Indicator3=AccDist&Indicator4=MFI&endDate=&CompareWith=&entryPrice=&stopLossPrice= https://www.stockscores.com/chart.asp?TickerSymbol=RSII&TimeRange=1095&Interval=w&Volume=1&ChartType=OHLC&Stockscores=1&ChartWidth=830&ChartHeight=500&LogScale=None&Band=None&avgType1=SMA&movAvg1=8&avgType2=SMA&movAvg2=34&Indicator1=RSI&Indicator2=PPO&Indicator3=AccDist&Indicator4=MFI&endDate=&CompareWith=&entryPrice=&stopLossPrice=
 Market Data
  Markets