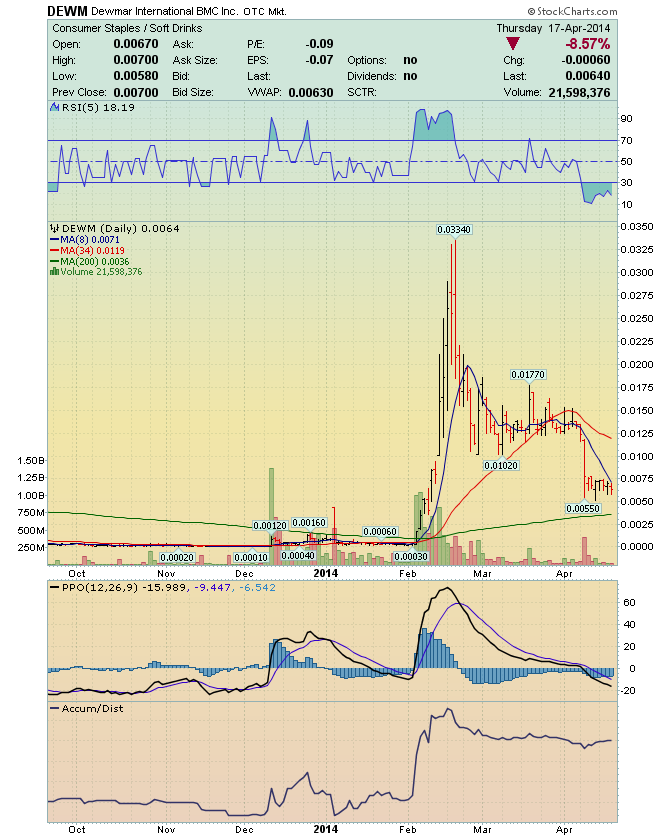
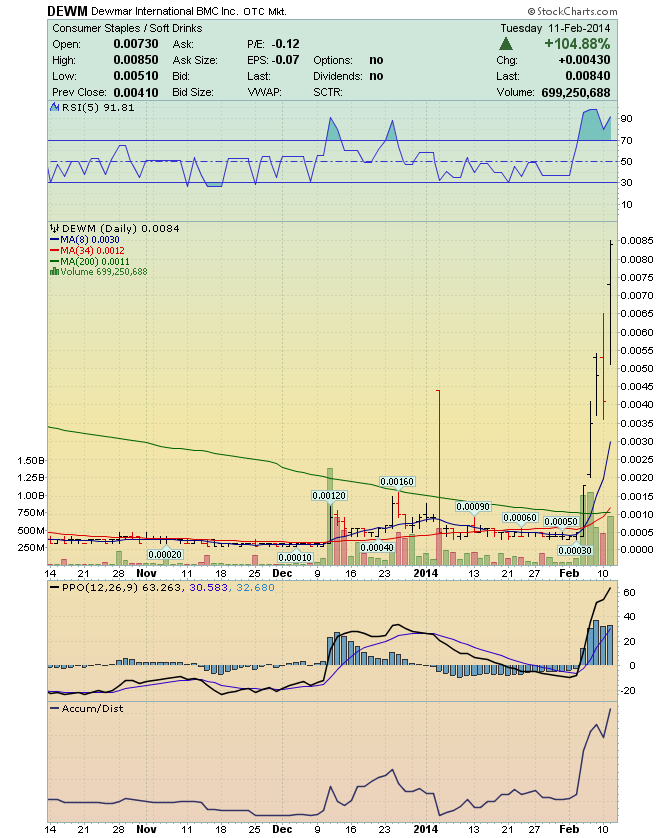
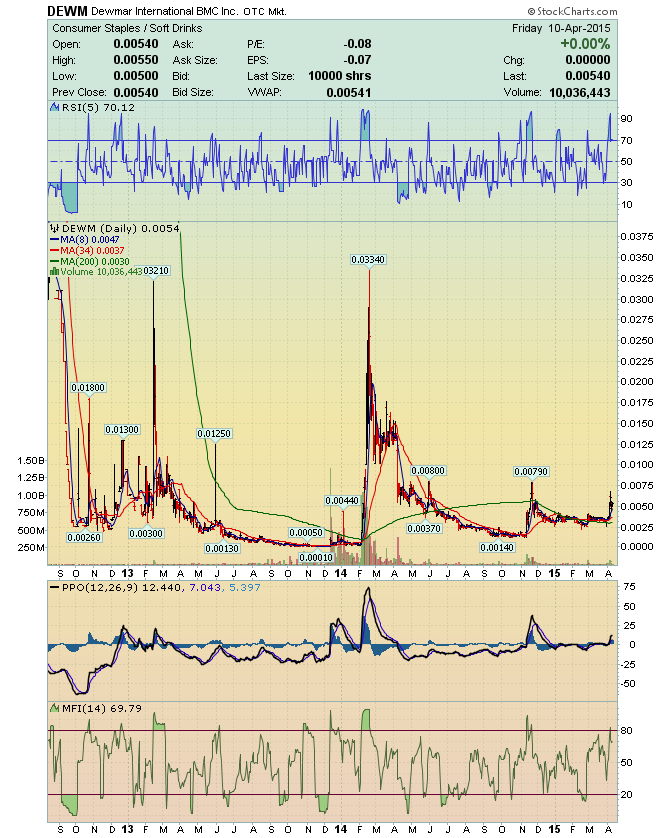
RDAR - DEWM I'll Alert you of stocks to Buy, before the Run happens ! Trader53's - Wealth Strategy for 2017 http://investorshub.advfn.com/boards/read_msg.aspx?message_id=127515287 Wealth Strategy: Hit the 0.0002's http://investorshub.advfn.com/boards/read_msg.aspx?message_id=125580980 Educational Post: Trading All OTC stocks http://investorshub.advfn.com/boards/read_msg.aspx?message_id=125559651 ________________________________________________________________ Low Floater RDAR Security Details Share Structure Market Value1...........$65,720 a/o Jan 12, 2017 Authorized Shares 5,000,000,000 a/o Jun 15, 2016 Outstanding Shares..206,983,104 a/o Jun 15, 2016 Float............... 103,186,208 a/o Apr 27, 2016 Par Value 0.001 http://www.otcmarkets.com/stock/RDAR/profile http://www.allotcbb.com/quote.php?symbol=rdar http://www.investorpoint.com/stock/RDAR-RAADR+Inc/market-makers-level2/ http://www.investorpoint.com/stock/RDAR-RAADR+Inc/price-history/ http://otcshortreport.com/?index=RDAR&action=view Low Floater DEWM Security Details Share Structure Authorized Shares..4,500,000,000 a/o Dec 26, 2013 Shares Outstanding 1,638,150,311 a/o Dec 26, 2013 Float................ 595,745,696 a/o Dec 13, 2013 http://www.dewmarinternational.com/ http://www.otcmarkets.com/stock/DEWM/profile https://investorshub.advfn.com/uimage/uploads/2014/4/21/iunpwDEWM_Chart_2_from_0.0001_to_0.0334.png http://investorshub.advfn.com/uimage/uploads/2016/12/18/cezezDEWM_Chart_0.0001.png investorshub.advfn.com/uimage/uploads/2017/1/13/ryzdgDEWM_from_the_Price_Pivot_High_of_0.0125_down_to_0.0001.png investorshub.advfn.com/uimage/uploads/2017/1/13/igvyyDEWM_Chart_3_from_0.0001_to_0.0334.png investorshub.advfn.com/uimage/uploads/2017/1/13/ekxzlDEWM_Alerted_at_0.0002_October_28_2013.png http://www.stockscores.com/chart.asp?TickerSymbol=RDAR&TimeRange=365&Interval=d&Volume=1&ChartType=OHLC&Stockscores=1&ChartWidth=830&ChartHeight=500&LogScale=None&Band=None&avgType1=SMA&movAvg1=8&avgType2=SMA&movAvg2=34&Indicator1=RSI&Indicator2=PPO&Indicator3=AccDist&Indicator4=MFI&endDate=&CompareWith=&entryPrice=&stopLossPrice= http://www.stockscores.com/chart.asp?TickerSymbol=RDAR&TimeRange=180&Interval=d&Volume=1&ChartType=OHLC&Stockscores=1&ChartWidth=830&ChartHeight=500&LogScale=None&Band=None&avgType1=SMA&movAvg1=8&avgType2=SMA&movAvg2=34&Indicator1=RSI&Indicator2=PPO&Indicator3=AccDist&Indicator4=MFI&endDate=&CompareWith=&entryPrice=&stopLossPrice=
 Market Data
  Markets