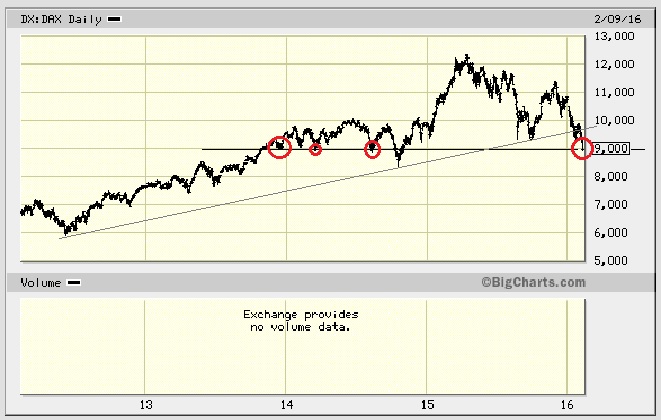
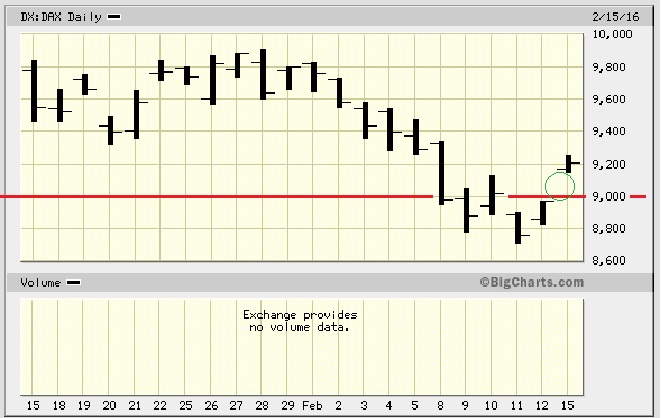
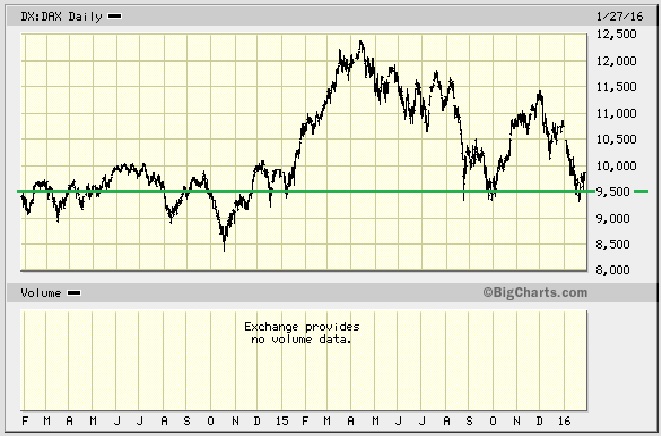
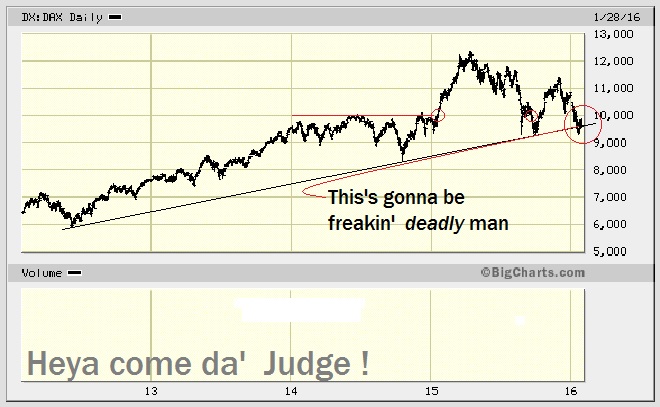
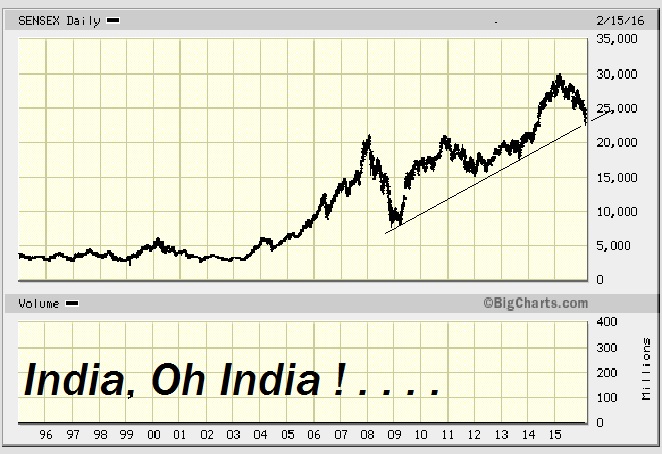
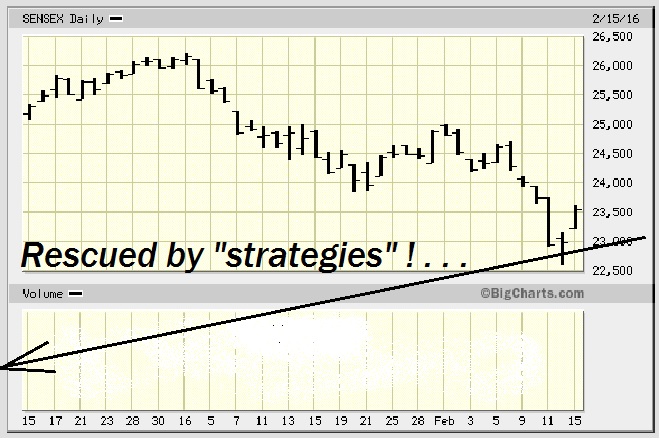
Last week I wrote about Frankfurts' 9000 Level : images.investorshub.advfn.com/images/uploads/2016/2/15/[hcrwdx_feb_9_4yr_9000_CIRCLES.jpg So today it makes sense to incorporate an update : images.investorshub.advfn.com/images/uploads/2016/2/15/v[kqidx_feb_15_2mo_9000_upgap.jpg 2 weeks ago I posted this information : images.investorshub.advfn.com/images/uploads/2016/2/15/mngkidx_jan_27_2yr_9500_sup.jpg And the very next day posted THIS : images.investorshub.advfn.com/images/uploads/2016/2/15/xwidtdx_jan_28_4yr_deadly_man.jpg Now compare that bottom chart, with the one at the top . . . . . And ask y'self : Can any conclusions be drawn from these ? Aside from the fact that nowwhat's a real lousy chartist ? . Note : Or just compare the 2 charts here : [chart]images.investorshub.advfn.com/images/uploads/2016/2/15/xwidtdx_jan_28_4yr_deadly_man.jpg LoL.... Ten days later : WHUMP !.... images.investorshub.advfn.com/images/uploads/2016/2/15/[hcrwdx_feb_9_4yr_9000_CIRCLES.jpg 5 days later : Presidents' Day in the States today (US markets closed) : images.investorshub.advfn.com/images/uploads/2016/2/15/v[kqidx_feb_15_2mo_9000_upgap.jpg -------------------------------------------- Meanstwhilst : images.investorshub.advfn.com/images/uploads/2016/2/15/ut[[bsensex_feb_15_ALL_OH_INDIA.jpg images.investorshub.advfn.com/images/uploads/2016/2/15/kmenisensex_feb_15_2mo_rescue_strategy.jpg
 Market Data
  Markets