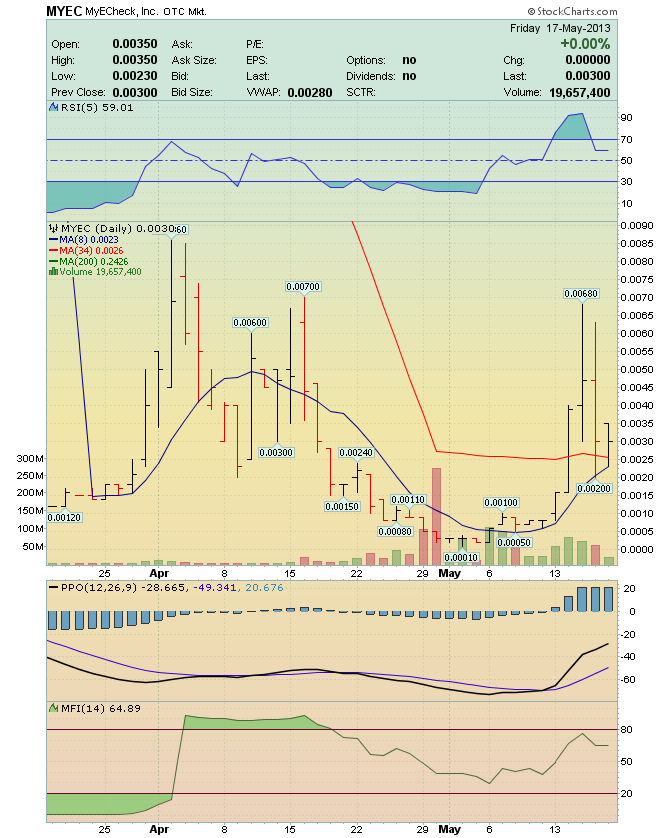
CTLE - MYEC - Buy after an Elliott 5-Wave Decline Sequence * Note Both the 5-Wave decline, and the A,B,C Retrace, are marked by Chart "Price" labels The Planned Trade http://investorshub.advfn.com/boards/read_msg.aspx?message_id=79687151 http://investorshub.advfn.com/boards/read_msg.aspx?message_id=89492500 http://i44.tinypic.com/w0ooe1.gif http://stockcharts.com/school/data/media/chart_school/market_analysis/elliott_wave_theory/ew_basics/ewb-04-down8.png http://stockcharts.com/school/data/media/chart_school/market_analysis/elliott_wave_theory/ew_basics/ewb-06-thewdown.png * Embedded ChartS http://images.investorshub.advfn.com/images/uploads/2013/5/18/obfopMYEC_Chart_2_has_a,b,c_after_5-wave_decline.png http://images.investorshub.advfn.com/images/uploads/2015/8/9/jkbtxCTLE_Chart_compared_to_OLIE_chart_2.png http://stockcharts.com/school/data/media/chart_school/market_analysis/elliott_wave_theory/ew_basics/ewb-06-thewdown.png Live! Chart http://stockcharts.com/c-sc/sc?s=CTLE&p=D&yr=0&mn=2&dy=0&i=p81157010403&r=1438723175461 http://images.investorshub.advfn.com/images/uploads/2013/5/18/obfopMYEC_Chart_2_has_a,b,c_after_5-wave_decline.png http://stockcharts.com/h-sc/ui?s=CTLE&p=D&yr=0&mn=2&dy=18&id=p86515299034
 Market Data
  Markets