


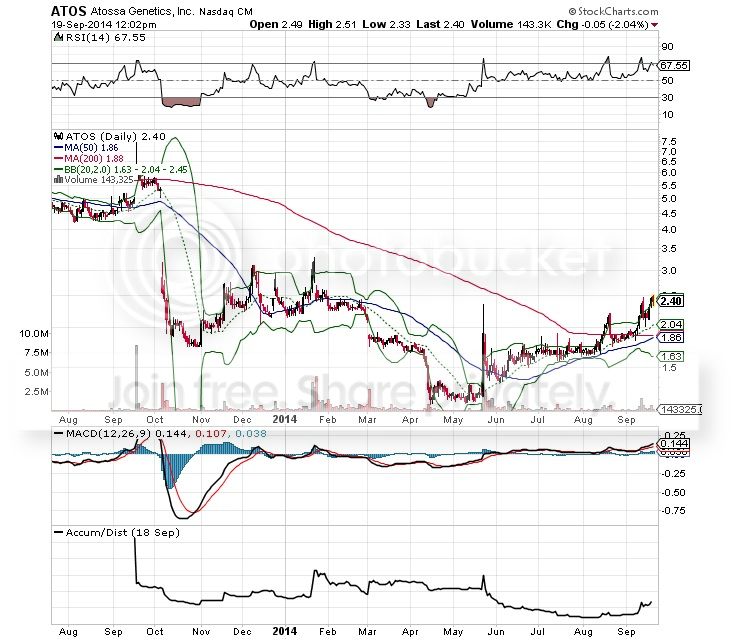
Golden Cross coming next week (blue 50 day moving average crosses the slower moving, red 200 day moving average)! This is one of the strongest bullish indicators used in technical analyses. We’re also still in breakout mode with the chart riding the upper Bollinger band for guidance. Additionally the MACD is positive and the Accumulation/Distribution line at the bottom has finally uptrended enough to confirm a trend reversal, meaning buyers are starting to accumulate and hold their shares instead of dumping them on the Market Makers. This tells me that the market is starting to be taken over by longs instead of flippers, which is very important for sustained growth. The Parabolic SAR (not pictured) is still holding a “buy” indicator.
The only concern with the chart is that its pretty top heavy right now; the RSI sitting right below 70 meaning the stock is over bought. With that said, if we get FDA approval news next week then it’ll blow this chart open and we’ll enter what’s called the “power zone.” This is when the RSI shoots past 70 into the 80’s, thus breaking the RSI 70 resistance. Some of you probably remember from when we first started trading this at $1.20 that the most exciting aspect of the chart are the “gaps” we were hoping to fill. The chart has just finished filling the first gap from early March with this latest uptrend, which is a major development because we’ll now be ready to potentially take on the biggest gap if the FDA approves 510(k) filing. This gap I’m referring to is on the left of the chart, from roughly $3 to $4.75.
Fingers crossed for good news next week!


Do your own DD and do not trust anything without verifying it yourself.
Recent ATOS News
- Form 8-K - Current report • Edgar (US Regulatory) • 04/16/2026 12:30:24 PM
- Form 4 - Statement of changes in beneficial ownership of securities • Edgar (US Regulatory) • 03/30/2026 11:22:50 PM
- Form ARS - Annual Report to Security Holders • Edgar (US Regulatory) • 03/30/2026 09:33:51 PM
- Form DEF 14A - Other definitive proxy statements • Edgar (US Regulatory) • 03/30/2026 09:30:46 PM
- Atossa Therapeutics Reports Fourth Quarter and Year-End 2025 Financial Results and Provides a Corporate Update • PR Newswire (US) • 03/25/2026 09:30:00 PM
- Form 10-K - Annual report [Section 13 and 15(d), not S-K Item 405] • Edgar (US Regulatory) • 03/25/2026 09:21:23 PM
- Form 8-K - Current report • Edgar (US Regulatory) • 03/25/2026 09:20:21 PM
- Form PRE 14A - Other preliminary proxy statements • Edgar (US Regulatory) • 03/20/2026 08:52:24 PM
- The Patent Cliff is Coming, Driving Smart Money Towards Precision Oncology • GlobeNewswire Inc. • 03/19/2026 03:00:00 PM
- Atossa Therapeutics Strengthens Clinical Leadership Team with the Addition of Two Experienced Biopharma Executives • PR Newswire (US) • 03/19/2026 12:00:00 PM
- Atossa Therapeutics Presents Clinical Trial Update Highlighting (Z)-Endoxifen Research at the 2026 MDA Clinical & Scientific Conference • PR Newswire (US) • 03/12/2026 12:00:00 PM
- Form 8-K - Current report • Edgar (US Regulatory) • 02/20/2026 09:22:08 PM
- Form 424B5 - Prospectus [Rule 424(b)(5)] • Edgar (US Regulatory) • 02/20/2026 09:16:05 PM
- Form 424B3 - Prospectus [Rule 424(b)(3)] • Edgar (US Regulatory) • 02/20/2026 09:07:14 PM
- Form 8-K - Current report • Edgar (US Regulatory) • 02/17/2026 09:30:28 PM
- Form 8-K - Current report • Edgar (US Regulatory) • 02/11/2026 01:45:24 PM
- Atossa Therapeutics Issues Letter to Shareholders Highlighting 2025 Accomplishments and 2026 Outlook • PR Newswire (US) • 02/11/2026 01:30:00 PM
- Atossa Therapeutics Maintains Strong Market Position for (Z)-Endoxifen for Duchenne Muscular Dystrophy as Congress Reauthorizes Priority Review Voucher Program • PR Newswire (US) • 02/05/2026 01:30:00 PM
- Form 8-K - Current report • Edgar (US Regulatory) • 01/26/2026 01:00:26 PM
- Atossa Therapeutics Receives FDA Orphan Drug Designation for (Z)-Endoxifen for the Treatment of Duchenne Muscular Dystrophy • PR Newswire (US) • 01/16/2026 09:40:00 PM
- Form 8-K - Current report • Edgar (US Regulatory) • 01/09/2026 01:15:27 PM
- Form 8-K - Current report • Edgar (US Regulatory) • 01/06/2026 01:30:24 PM
- Atossa Therapeutics Receives FDA "Study May Proceed" Letter for (Z)-Endoxifen Investigational New Drug Application for Metastatic Breast Cancer • PR Newswire (US) • 01/06/2026 01:15:00 PM
- Form DEF 14A - Other definitive proxy statements • Edgar (US Regulatory) • 12/22/2025 01:30:27 PM
- Atossa Therapeutics Wins 2025 Clinical Trials Arena Research and Development Excellence Award in Precision Endocrine Therapy Category • PR Newswire (US) • 12/17/2025 01:15:00 PM


