 News
News  Market Data
  Discover
Support: 888-992-3836
Copyright © 2023 InvestorsHub Inc.


In the markets, what goes down must go up
sharpshorts
![]()
In the markets, what goes down must go up
Register for free to join our community of investors and share your ideas. You will also get access to streaming quotes, interactive charts, trades, portfolio, live options flow and more tools.
Register for free to join our community of investors and share your ideas. You will also get access to streaming quotes, interactive charts, trades, portfolio, live options flow and more tools.
In the markets, what goes down must go up
Any Paint experts ?
Is there a way to turn off this Alert pop-up when you "Save As" a PNG, JPEG, BMP or GIF?
I did find that the warning doesn't pop-up if you select TIFF
(from the "Save As Type" drop-down box in the dialog pop-up window.)
...Or...
is there a way to add TIFF to Paint's "Save As" selection menu?

RU kidding? A MS OS that's trouble free?
The reality is that Microsoft's Windows operating systems have been obsolete junk for many years...
MS is adept at stifling completion -- they don't allow it.
They either buy-out any "NEW better mouse trap" to keep it from developing and getting to market...
or they just kill it.
Time Frames ... patterns ... signals = ENTRY
What's it like to make $200 a minute?
The BLUE LINE is just pointing out WHEN the signals could be seen

All day...every day...take 'em when you see 'em
Separated by seconds, who needs to go short?

Another practice trade / guess

More examples of Practice Trading.
It can be a way to measure how in tune you are to current price action.
Sometimes the signals talk to you, sometimes you just guess or anticipate a reversal...

Practice Trades -- training the hands and mind
I have Gadwin's "print-screen" program installed on my machine.
It is set to capture a .jpeg or .PMG image of the window that's under the cursor. It will automatically
name all captured images and save them by date and time to a designated file of my choosing.
I use the following method to "train" my fingers and test my reaction time while also determining
what bracket order levels will work best in the current market pace conditions.
Make sure ON-CHART-TRADING is OFF before trying this...

You can see how fast the market is by comparing the time stamps on each chart...
and this was BEFORE the major markets were open.
Gadwin's PrintScreen allows you to add time stamps and-or add't text to your snapshots.
Note: I have an older version and the current free versions installed.. The newer version
does not have a one click "save window" option.
I does have a one click "save full screen" option and will also add a camera sound when it's used.
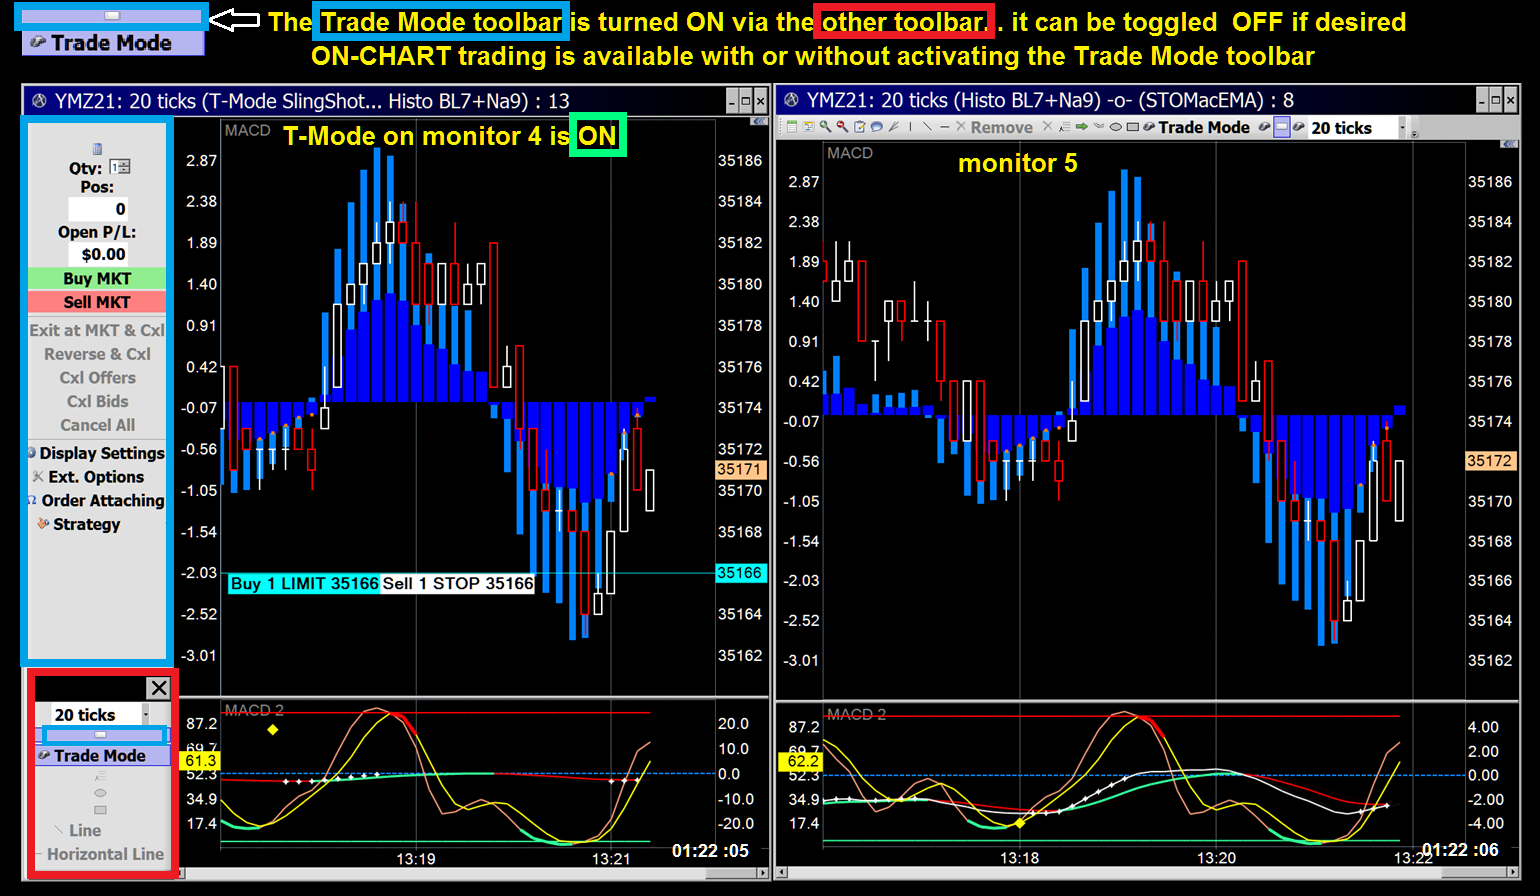
Multiple Toolbars & multiple charts on multiple monitors
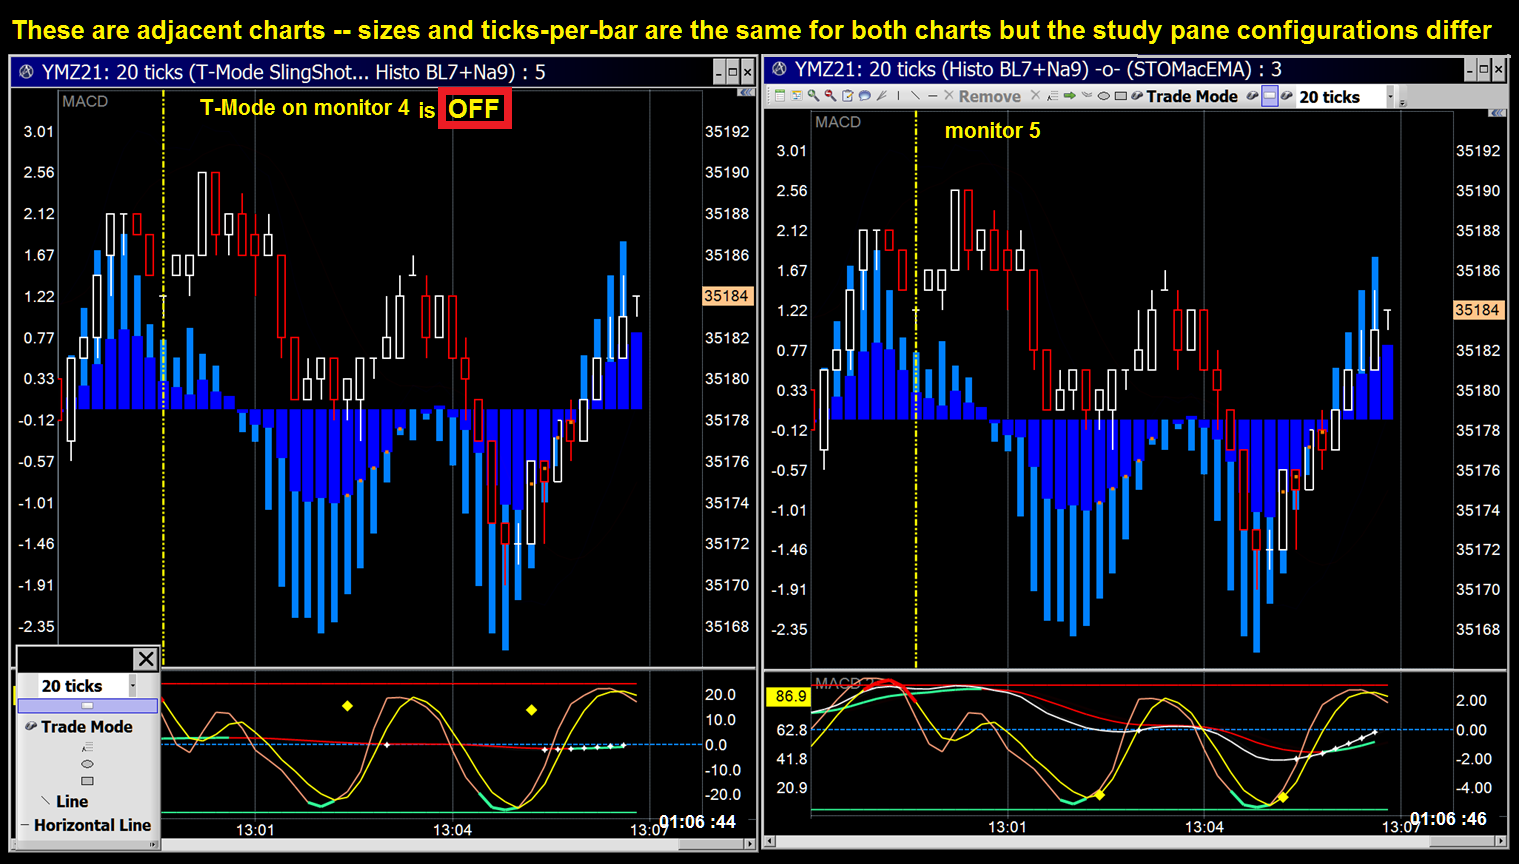
The gray-ed out items on the Trade Mode toolbar become active once an order is submitted or filled
Certain items in the "other toolbar" become gray-ed out when-ever Trade Mode is activated
Clever people are those software engineers...
I'm constantly changing & adding chart templates

Current "Saved Templates" to ApexTrader program and to a separate file on my machine.

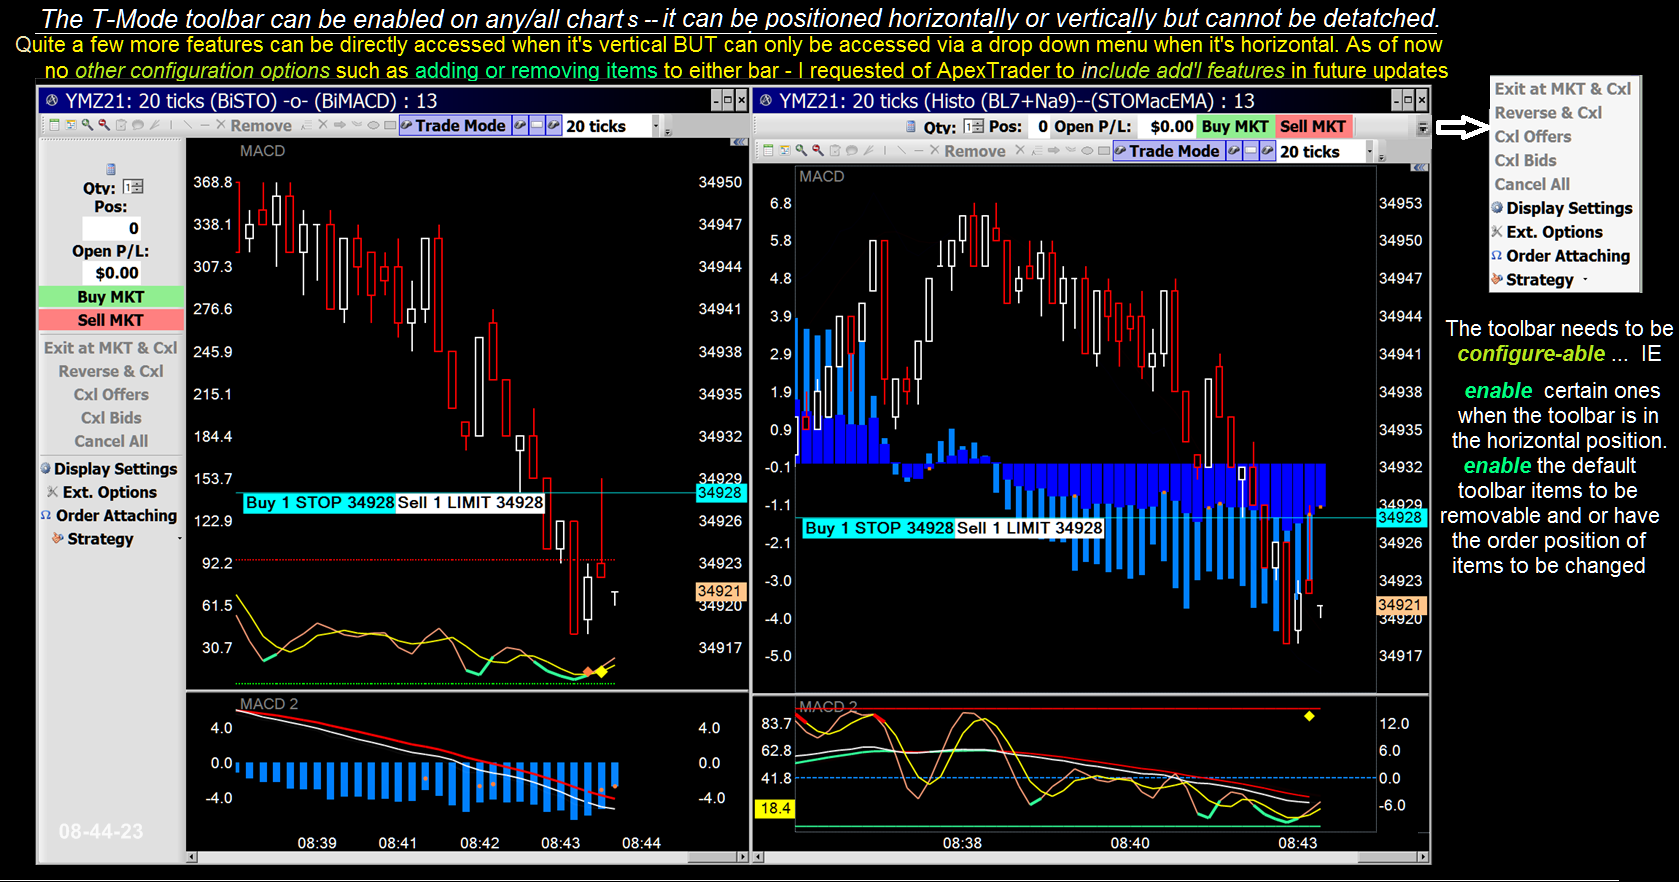
Trade-Mode Toolbar - just recently discovered it 's movable
... to the left, right, top or bottom of the chart.
Unless you run full screen , some of the items are not easily accessed on the fly
when you enable the horizontal mode. Note how much space it takes up in the vertical mode.
So I've sent in an email request to info@apexfutures.com in hopes they'll consider
some changes when they next upgrade ApexTrader
I advocate taking bits-and-pieces out at a time ... and using relatively tight bracket orders to keep me honest...
Sometimes there's enough time after an entry to adjust the auto-closing sides in your favor...but not always.
Hit-'em-and-run ... and don't give back when you've gained.

STO HOOK... BUT THE 1-2 PUNCH FOR THE MONEY

The importance of knowing your software's capabilities...CUSTOMIZING
An explanation...using MACD of one on my templates...There are many other indicators used as well...
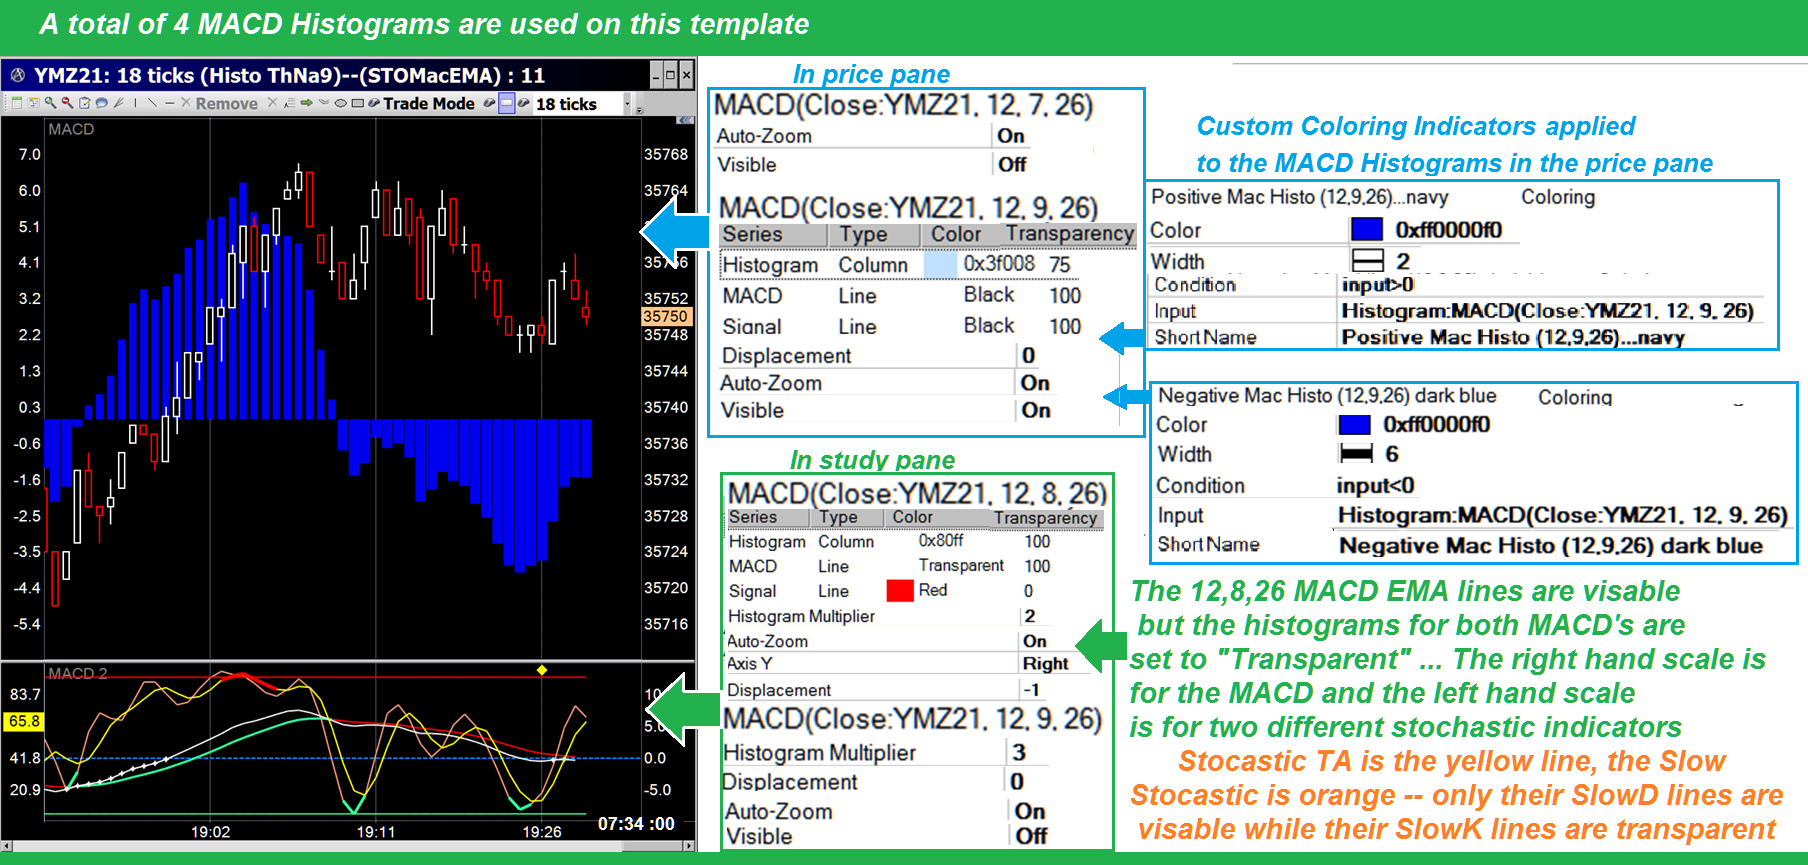
All the Active Indicators that make up this chart:
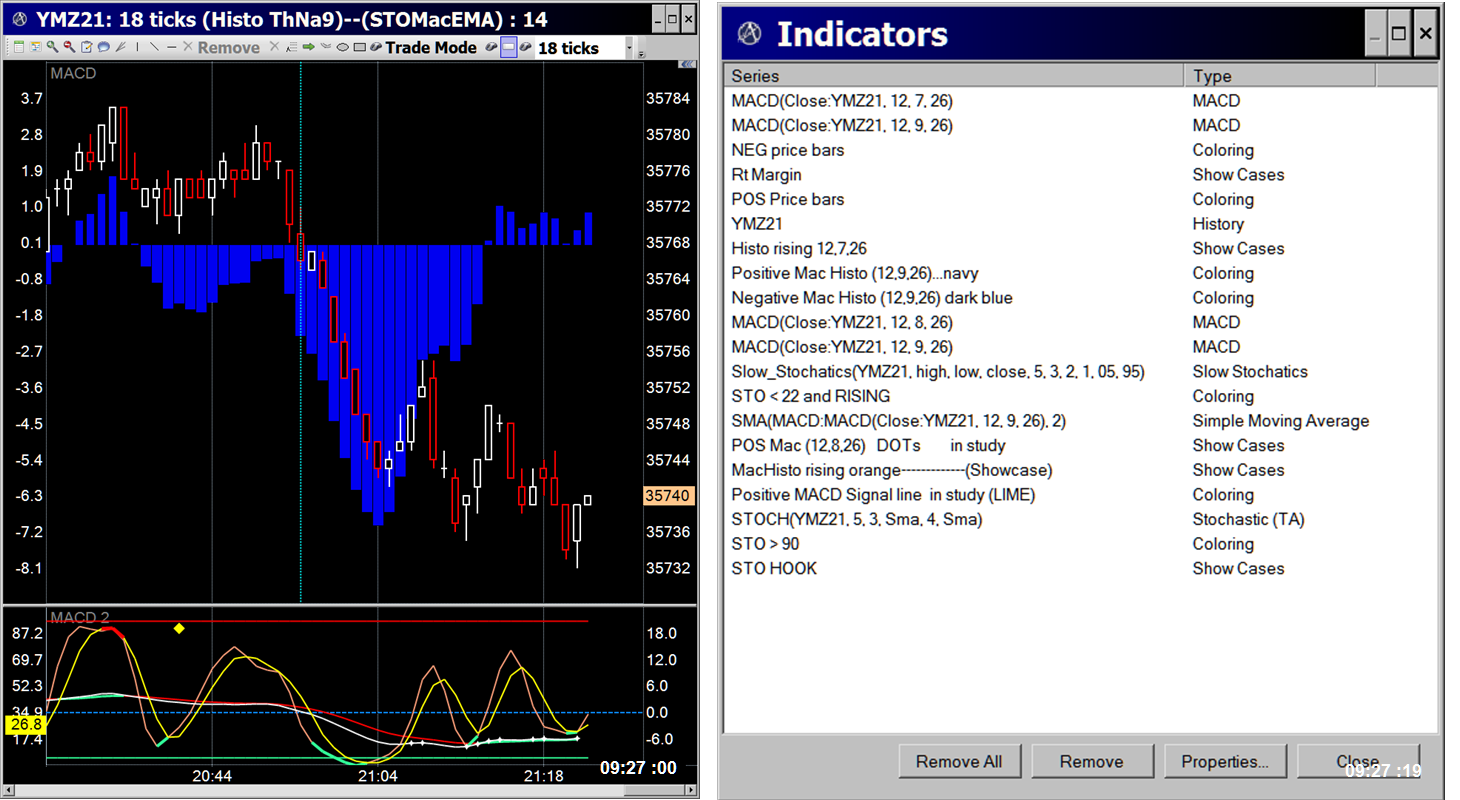
The STO HOOK is working tonight...

Bracket orders - Initial STOP is 5 points under ENTRY, inital TARGET set to 12 points above...
Sometimes there's time to raise the STOP and sometimes the TARGET can also be raised.
The (Price Bihisto NaNaBB 15m TL)--(STOMacEMA) -- higher time frames...


Tweeking indicators and time-frames to see patterns...better
20 ticks-per-bar

32 ticks-per-bar

Couple more STO-HOOK entry signals are shown here --
these came AFTER the one shown in the previous post...
Both had ranges well over $100 .. easy money but you gotta pay attention

The (Price Bihisto NaNaBB 15m TL)--(STOMacEMA) -APPLIED-

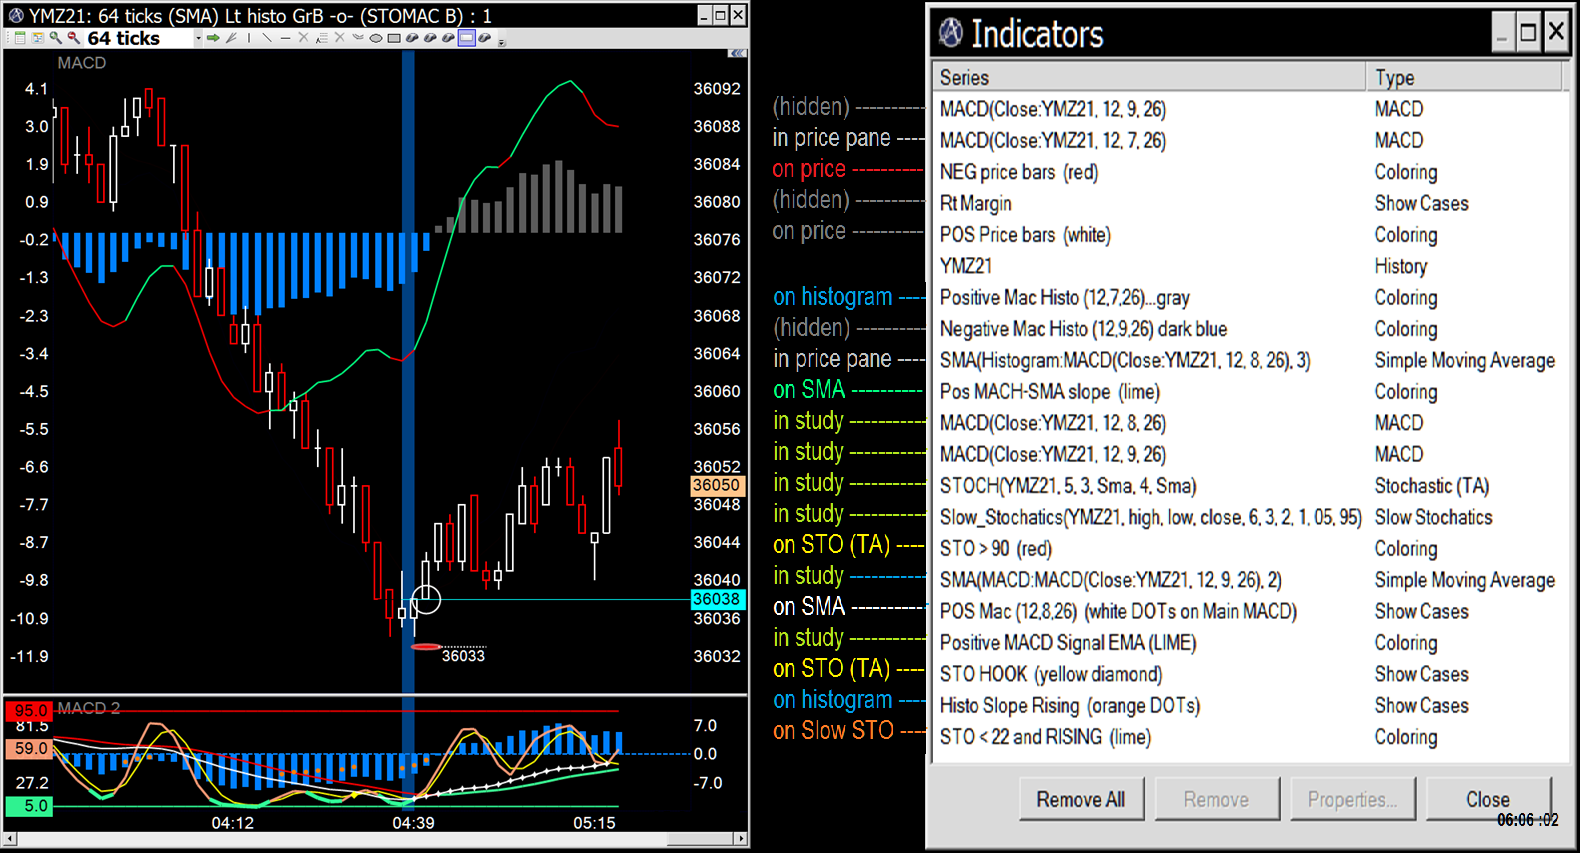
Chart template Titlebar & an indicator explanation...ApexTrader software.
The template name is shown in the tilebar for each chart you have open.
(Price Bihisto NaNaBB 15m TL)--(STOMacEMA)
I use some abbreviations to ID my collection of templates:
In the price pane there are two MACD Histograms (BiHisto) colored NavyNavy and BlueBlue (NaNaBB) .
Also shown are Vertical Time Lines auto-drawn every 15 minutes (m TL)
--
In the study are two stochastic indicators (STO) with MACD EMAs (MacEMA)

ApexTrader -- adjust-ability options
The are many property windows for setting up your charts for how they suit your eye...
Most of the properties of the menu items can also be modified for what you tend to use the most... 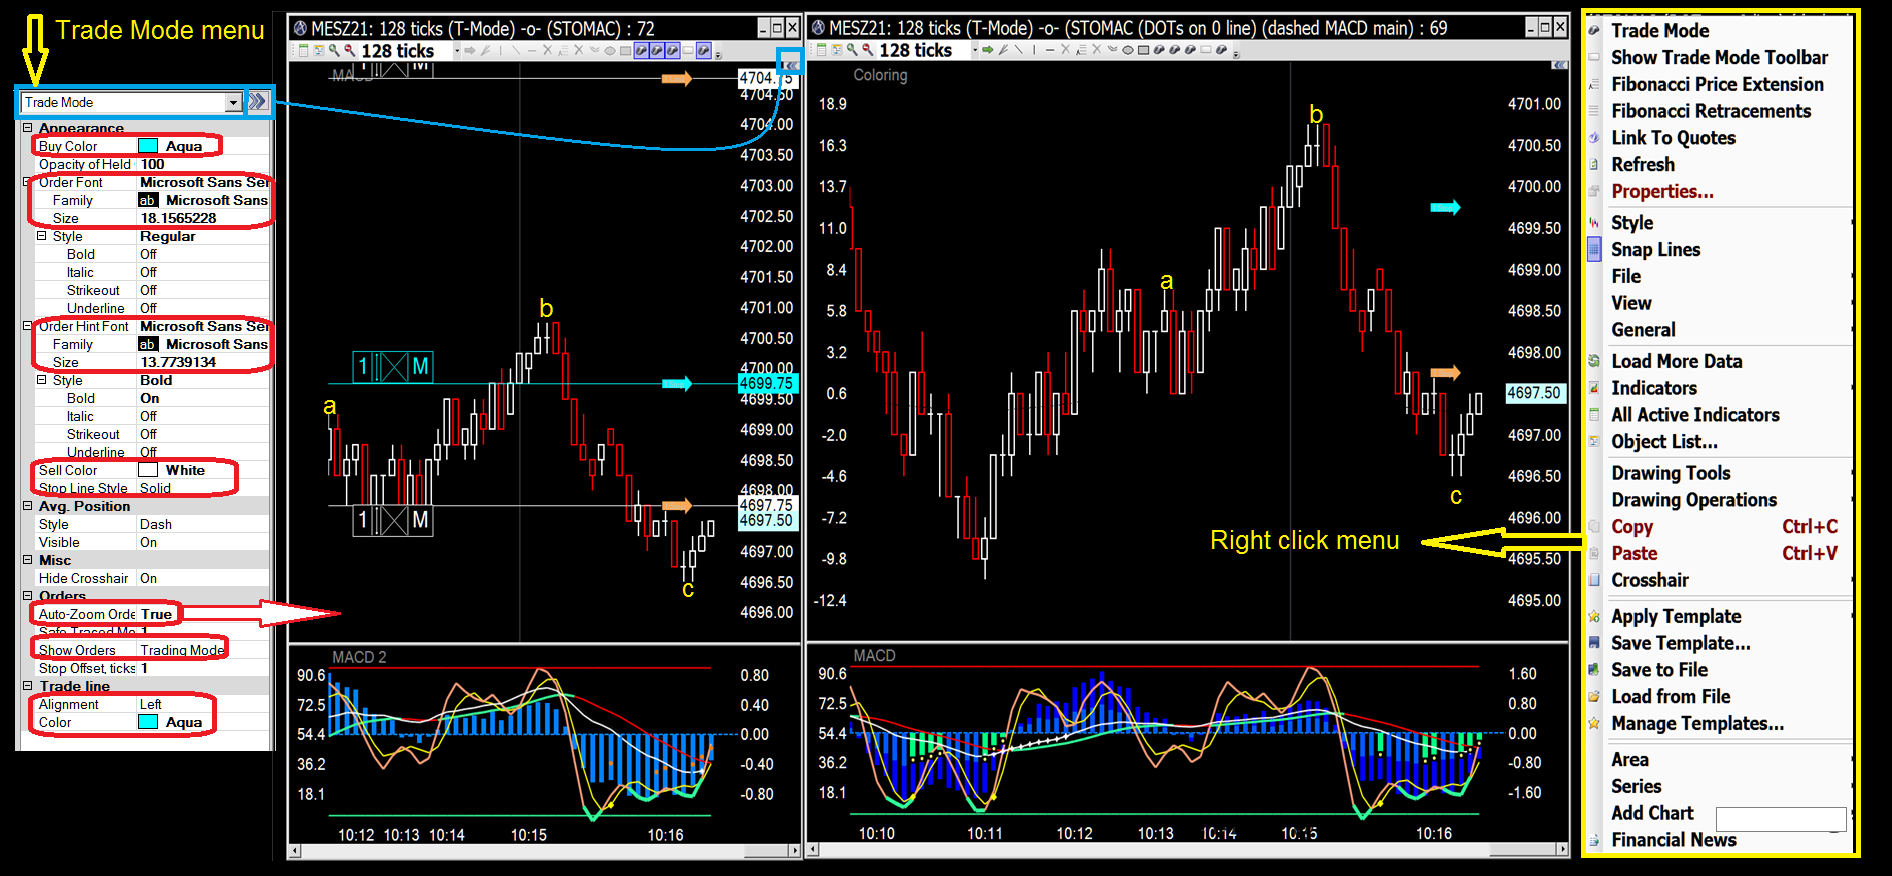
More blue line specials ...

Another divergence signal B4 the blue line -- --
$100 range - shown on two time frame charts with different indicators

Buy signals before the blue-line give the heads-up...
Divergence can be seen in the MACD histogram (Gray+Navy)
in the SMA of the MACD main EMA line (White with DOTs)
in the Williams Wiseman Step Line (Lime+Gray)
and in the stochastic lines (Orange+Yellow)

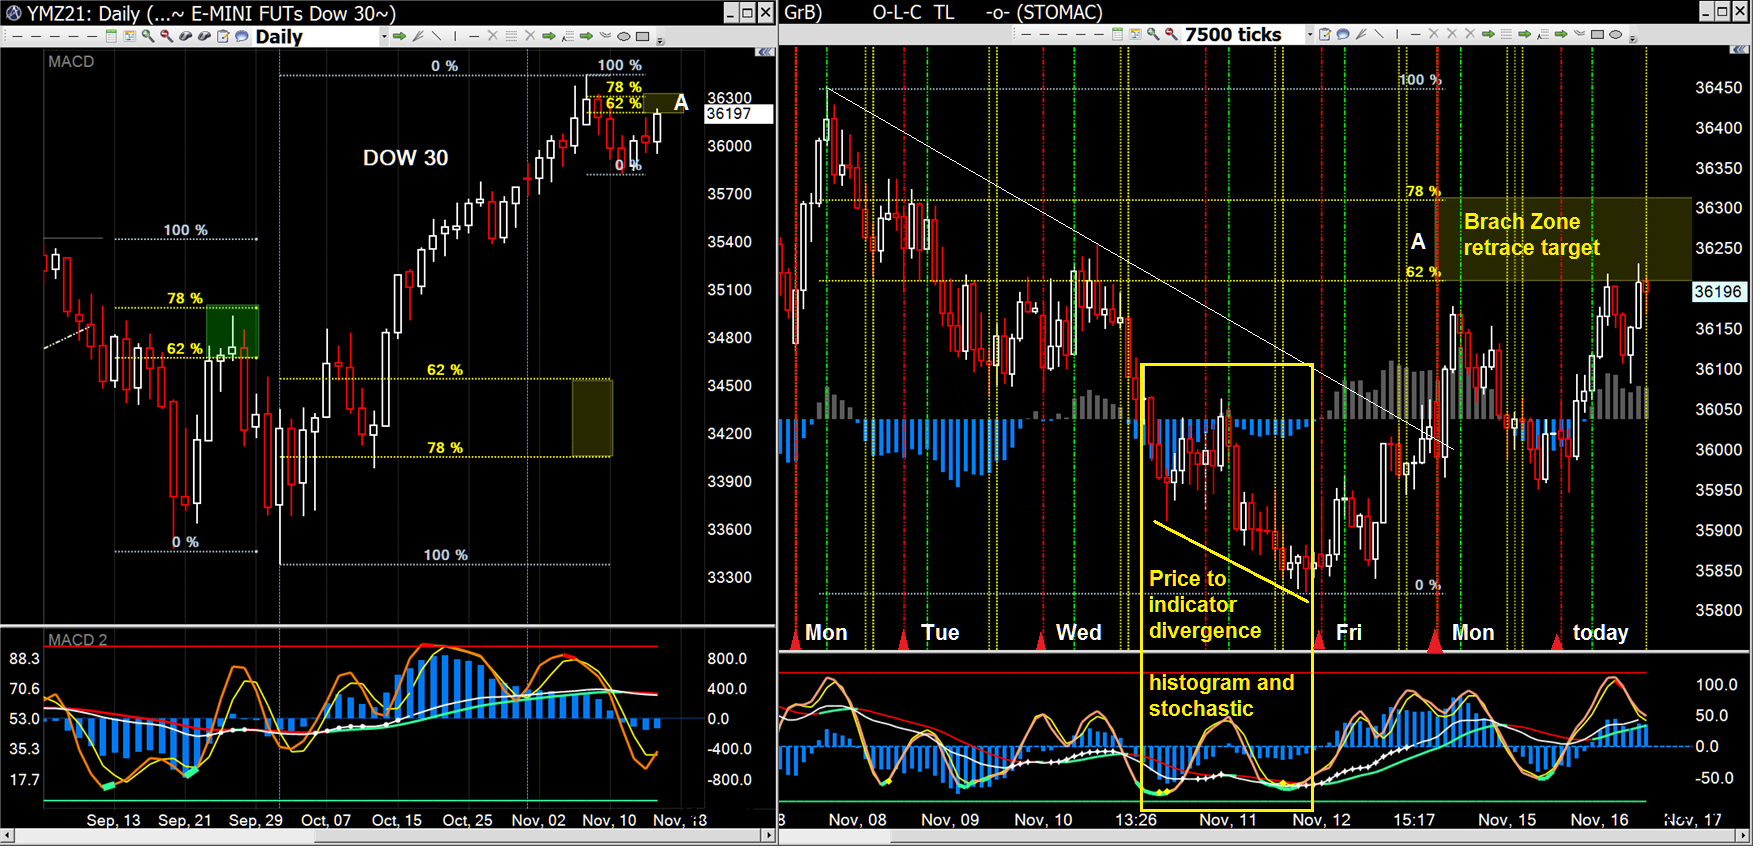
Apex custom chart set up - an example
Brach Zone target for this leg - achieved
Divergence signals last Thursday marked the bottom...
That's when you draw your Brach Zone Fibonacci grid and place your order.
This reversal was good for 350 points so far - $1750 per contract
Not too shabby for 2 1/2 sessions.
There's gold in them-thar Slingshots
The Mac Trend Sling

Buffy's BLine indicator (from daCharts.com)
Not exactly as she designed but I'm still working on it to get as close to hers as I can...
A nice MOF - Slingshot pattern is highlighted at point A (also from daCharts.com)

Brach Zone target area for this leg up
The subtle, little differences can make big differences...
Chart widths and time frame ticks-per-bar adjustments can help gauge changing "market pace"
...on a day to day basis AND throughout the current session you're trading...
I don't think watching volume is very useful when scalping the e-mini futures
compared to when you're scalping equities or ETF's.


New layout to accommodate the micro and e-mini
Centrally located order management screen for both the MES and YM ...


Micro MES vs. E-mini ES . . .
$5 per point for the micro...4647.50 to 4655 potential gross $37.50

vs. $50 per point for the E-mini...4647.50 to 4655 potential gross $375.00

The only pre-market prep I do is open my trade station
...then I look for price action and patterns...
(across multiple charts that show multiple time frames).
I'm a visual trader and have my favorite patterns:
...My trade station multi-monitor layout...

Heads up signals before an upturn - - to the left of the blue line
in advance of a 50 point+ reversal :
Dots building on the MACD main ema with the histos diverging from price direction
and the stochastic 1-2 Punch pattern...Plenty of time to enter an order.

S&P micro futures...bits and pieces at a time

A long taken in a down market

$100 minimum move

Read the Price/Action and Indicator patterns for good scalps
Left - 20 tick chart...price spikes up out of a down trend while MACD EMAs have stopped going down.
The dots on the main ema suggest that selling pressure has been slowing.
Stochastic has bottomed and is turning up.
Right - 36 tick chart...the histo slope has been moving up as price continued down (price-to-indicator divergence).
You can also see the stochastic 1-2 Punch pattern price-to-indicator divergence

Still going ...


The higher the time-frame, the more indicators lag...
Divergence is a leading Price/Action pattern, it's not an indicator per say.
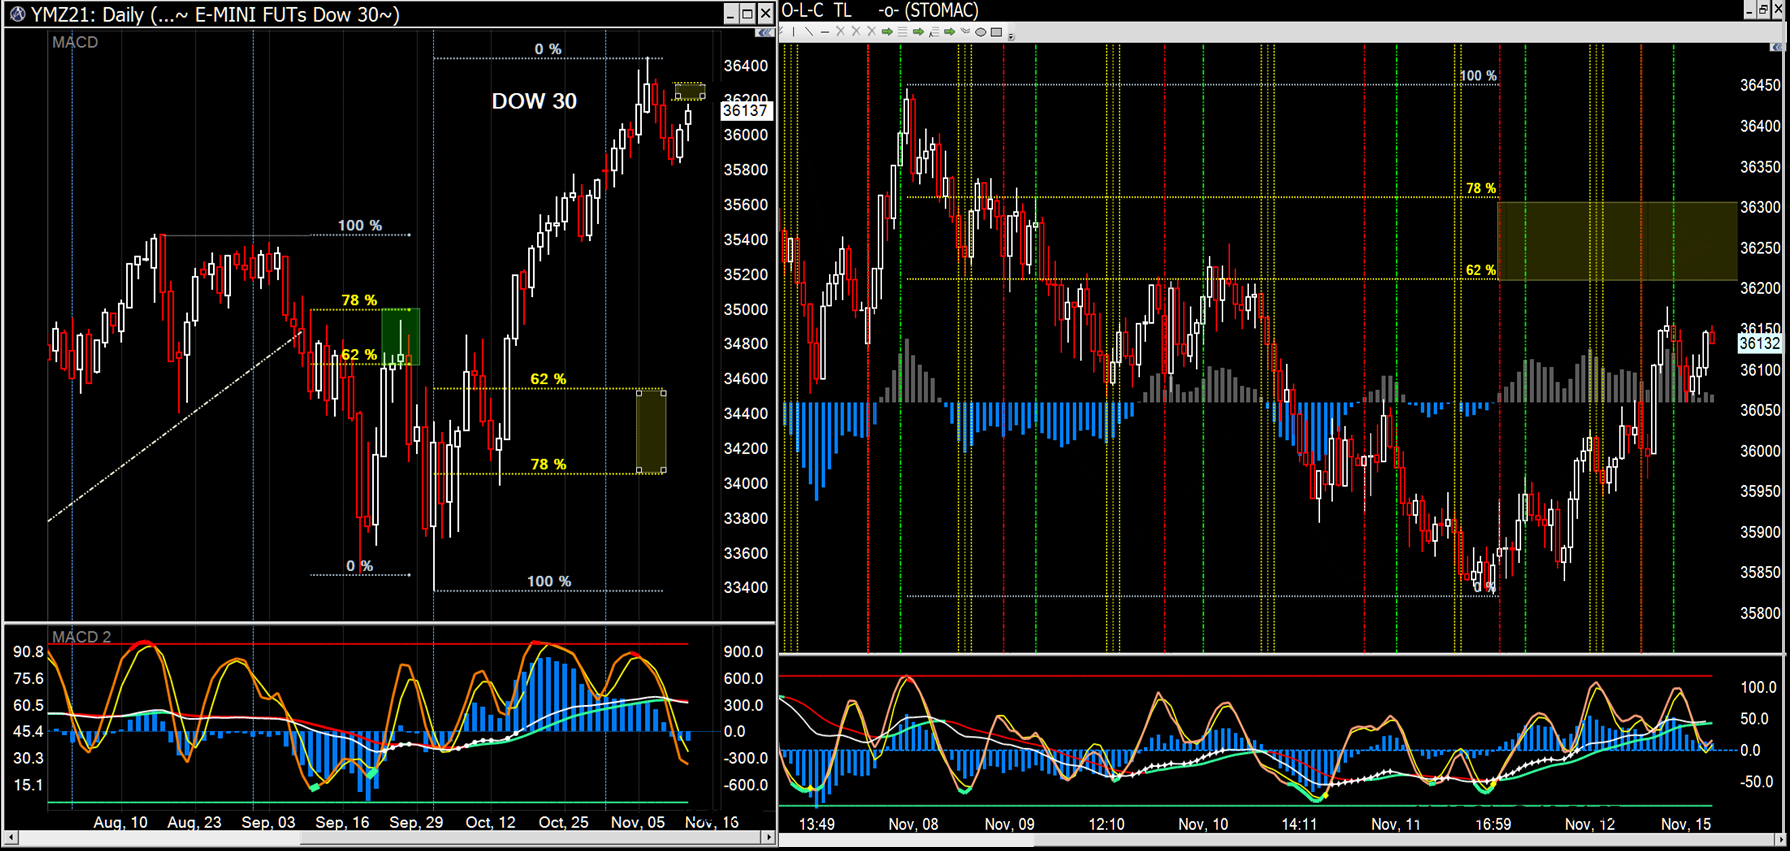
The beginning of October shows when divergence patterns can hint at potential price reversals...
Where-as currently, the MACD indicator (EMAs) is showing the strong up trend
while the stochastic indicator is over bought - - -
but neither is giving hints as to when price will reverse.
...a hill of beans..."Maybe not today, but soon"


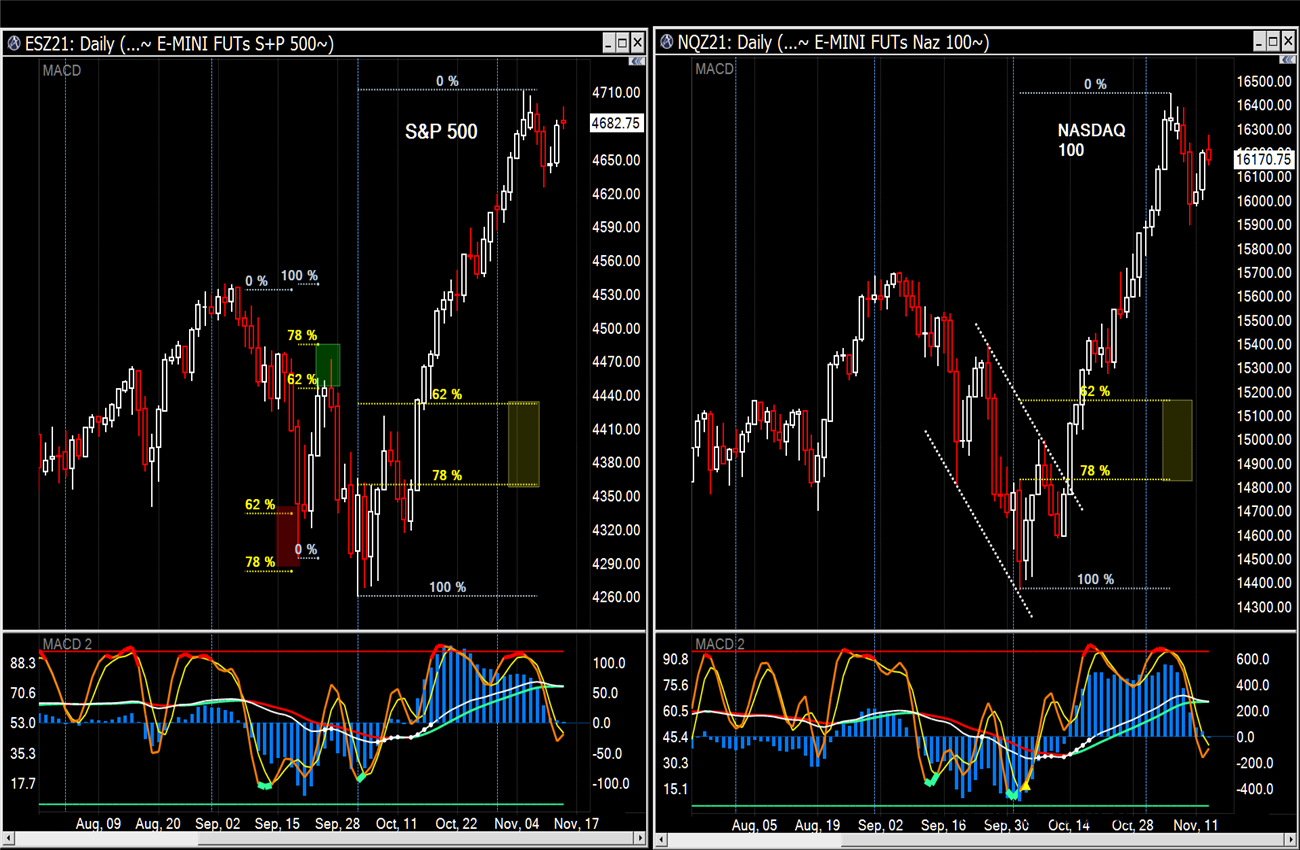
Sizing chart ticks-per-bar and widths helps spotting P/A


Price to Indicator DIVERGENCE...a LEADING indicator.
I'm enamored with divergence for giving hints of potential price reversals...It may not be 100% effective
nor 100% reliable but it has a much higher winning rate of predicting than any other that I know...
Even as these two charts show, divergence CAN show up across major differences in time frames simultaneously...
I use the longer time frame for anticipating potential reversals and the shorter for entering trades...
In this case divergence was good for about $100. 
An aversion to shorting...but need to overcome this


