Register for free to join our community of investors and share your ideas. You will also get access to streaming quotes, interactive charts, trades, portfolio, live options flow and more tools.
CONFIGURE ApexTrader's MENUs, TOOLBARs and DRAWING TOOLS
--- Add or remove items to a chart's right-click-menu. Drag & Drop from the configuration list
into the Context Menu for items that are used the most.
--- Drag & Drop to add or remove items to the drawing toolbar which can be set to always
show or be hidden...It can be placed on the top, bottom or sides of the chart. Show items
as an icon, as text or as a combination of both.
--- Configure the properties of the drawing tools to suit your requirements.
Some examples:


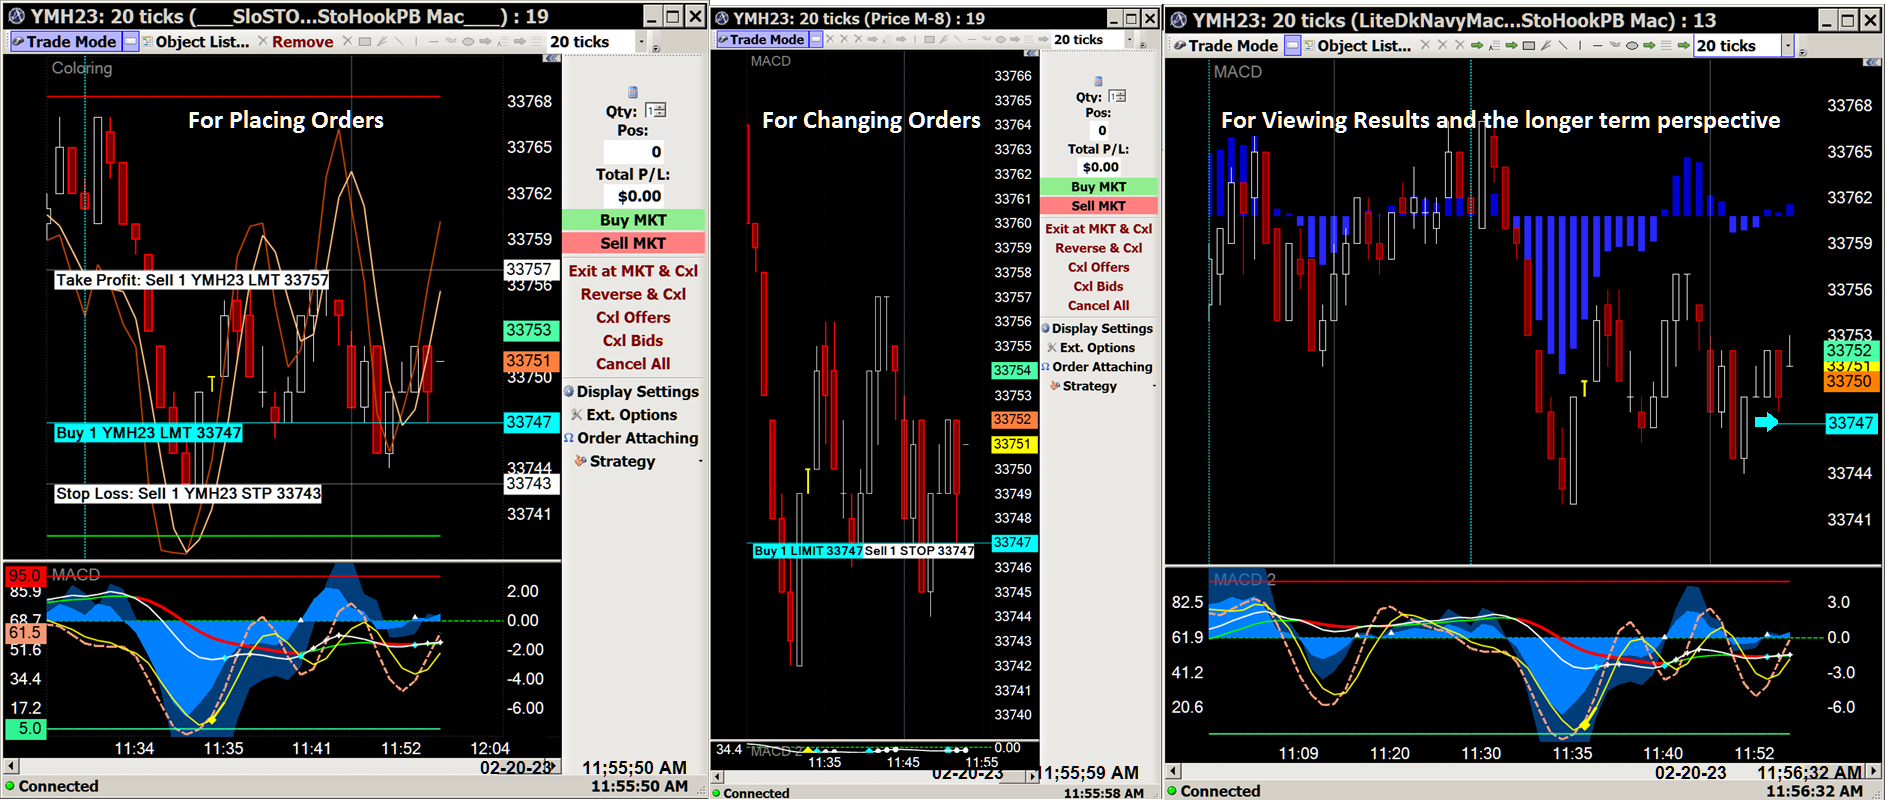
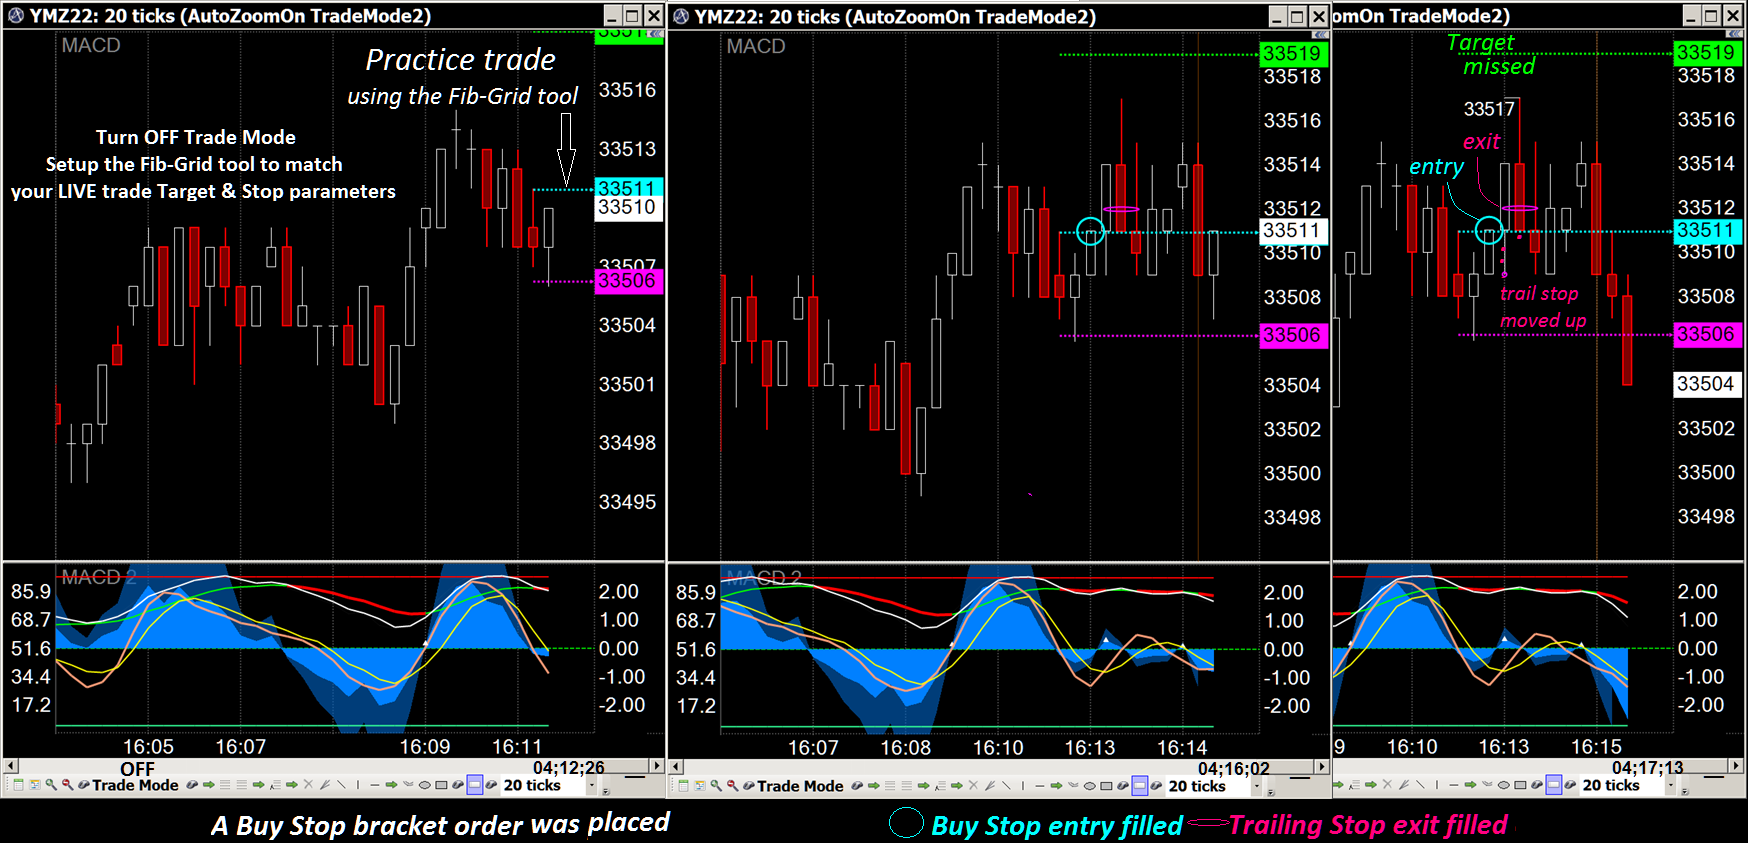
Three chart ENTRY - EXIT perspectives
These are showing orders before being sent to the market.
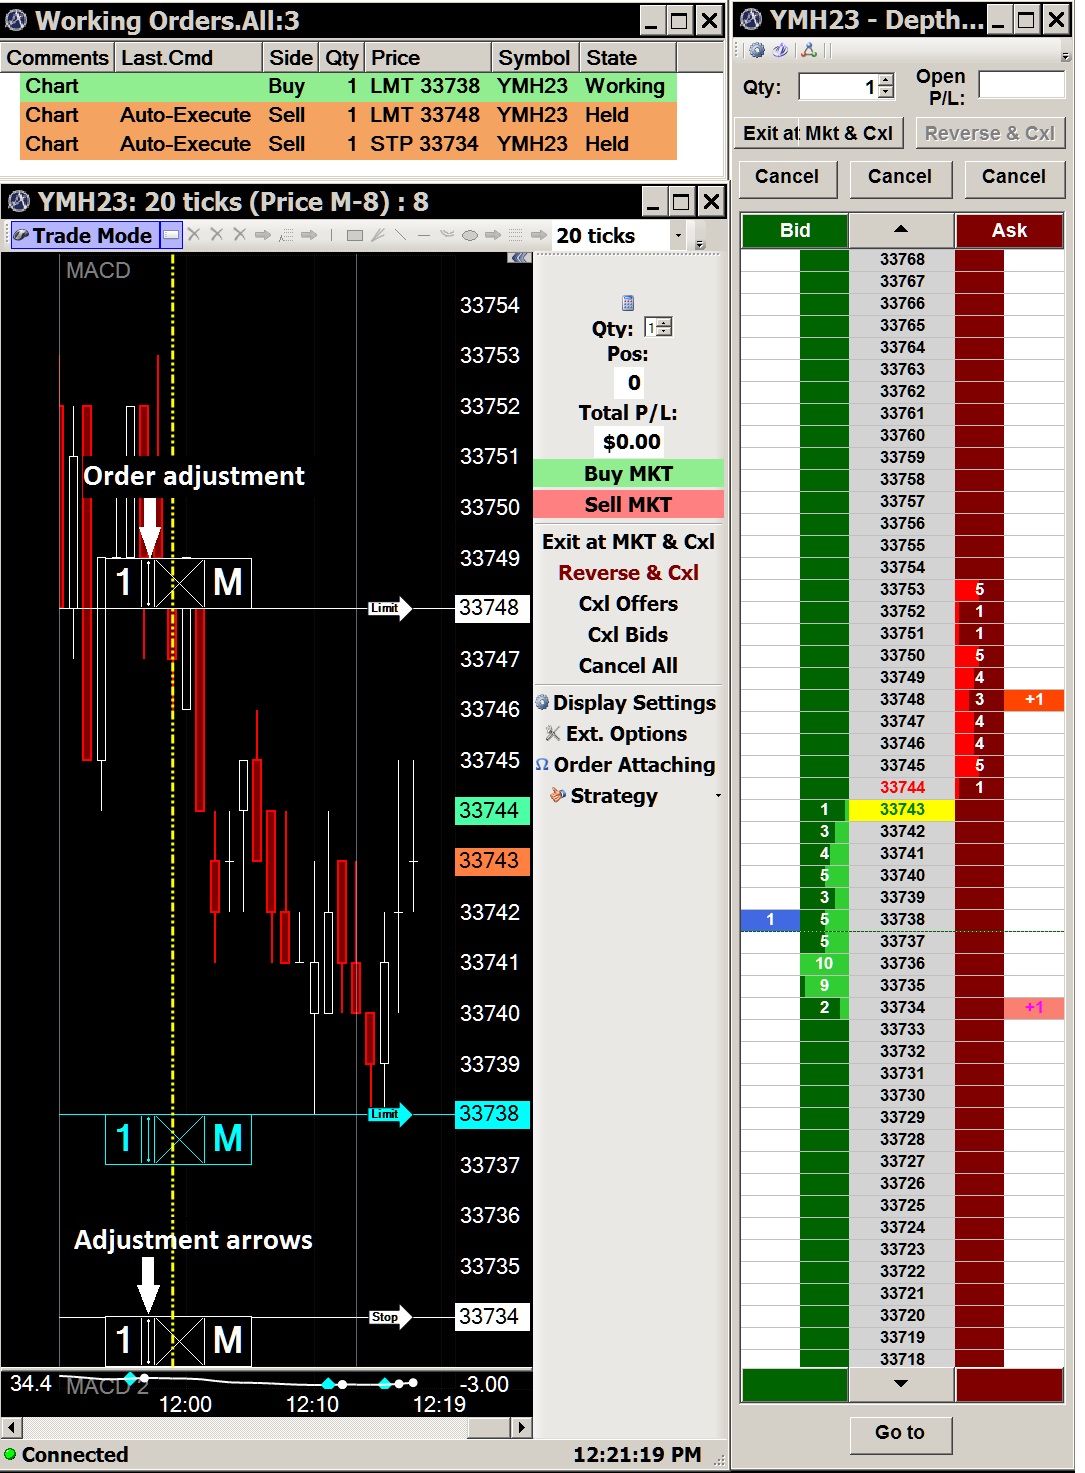
Once sent and filled, the markers change to a larger size which makes it easier to grab
the adjustment arrows to change the auto-execute feature of the offset bracket orders.
Even with the larger markers it's still easier to grab and move the markers on the DOM.
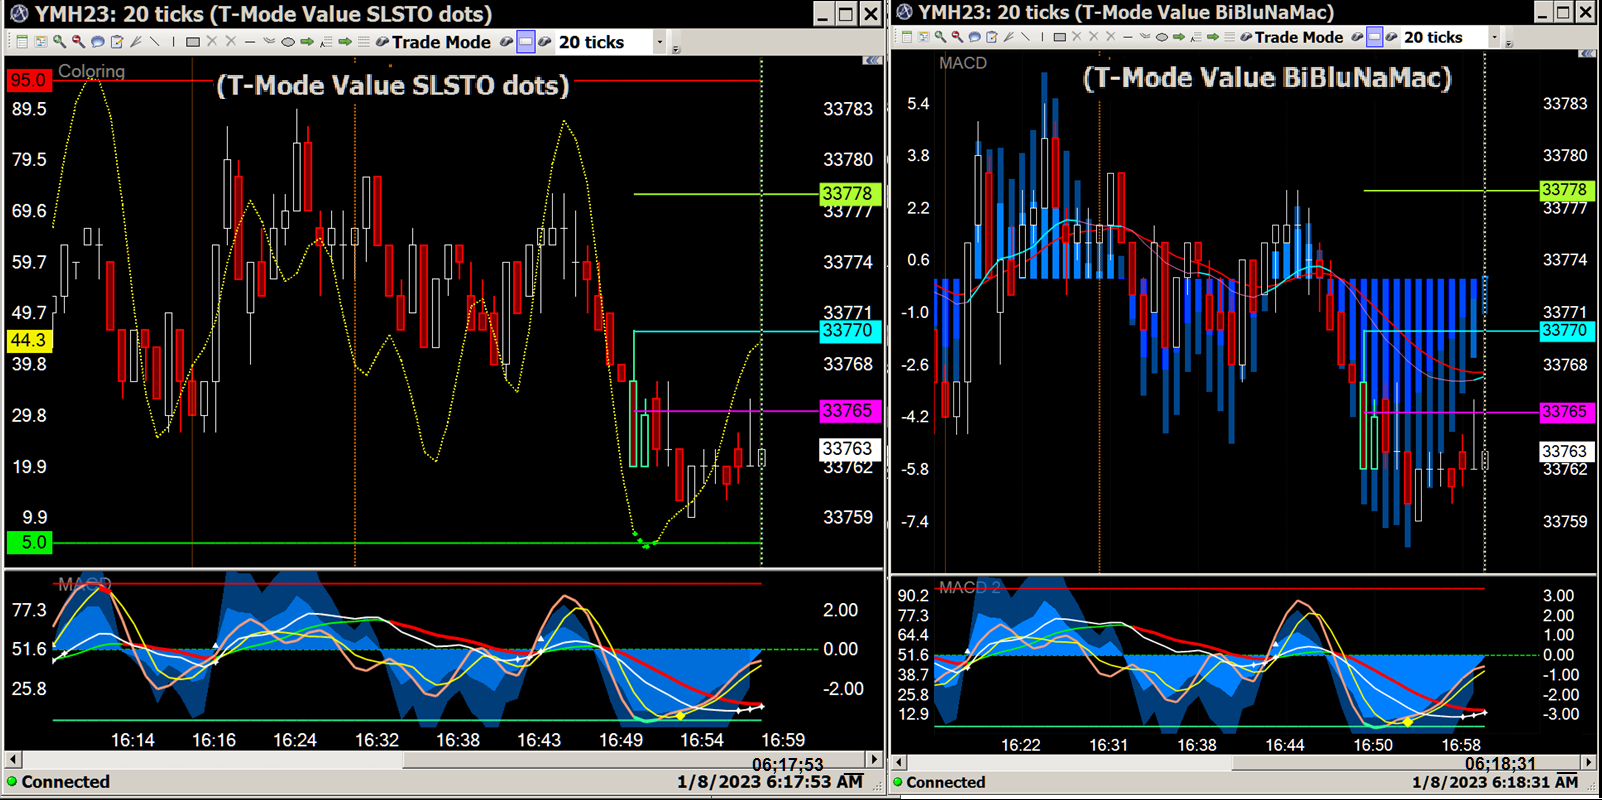
4 examples of chart templates created with ApexTrader software...
These are all 20 ticks-per-bar of varying widths that are used
for Stochastic Signal Bar T-Mode entries...
These are slightly different from each other in regard to the indicator(s)
that are included within the price panes. They all share the same indicators
that show within the study pane.
Also included on each chart is a Bracket Order Grid which is drawn separately
using an ApexTrader drawing tool:
Entry level in Cyan
Initial Target level in Light Green
Initial Stop level in Magenta

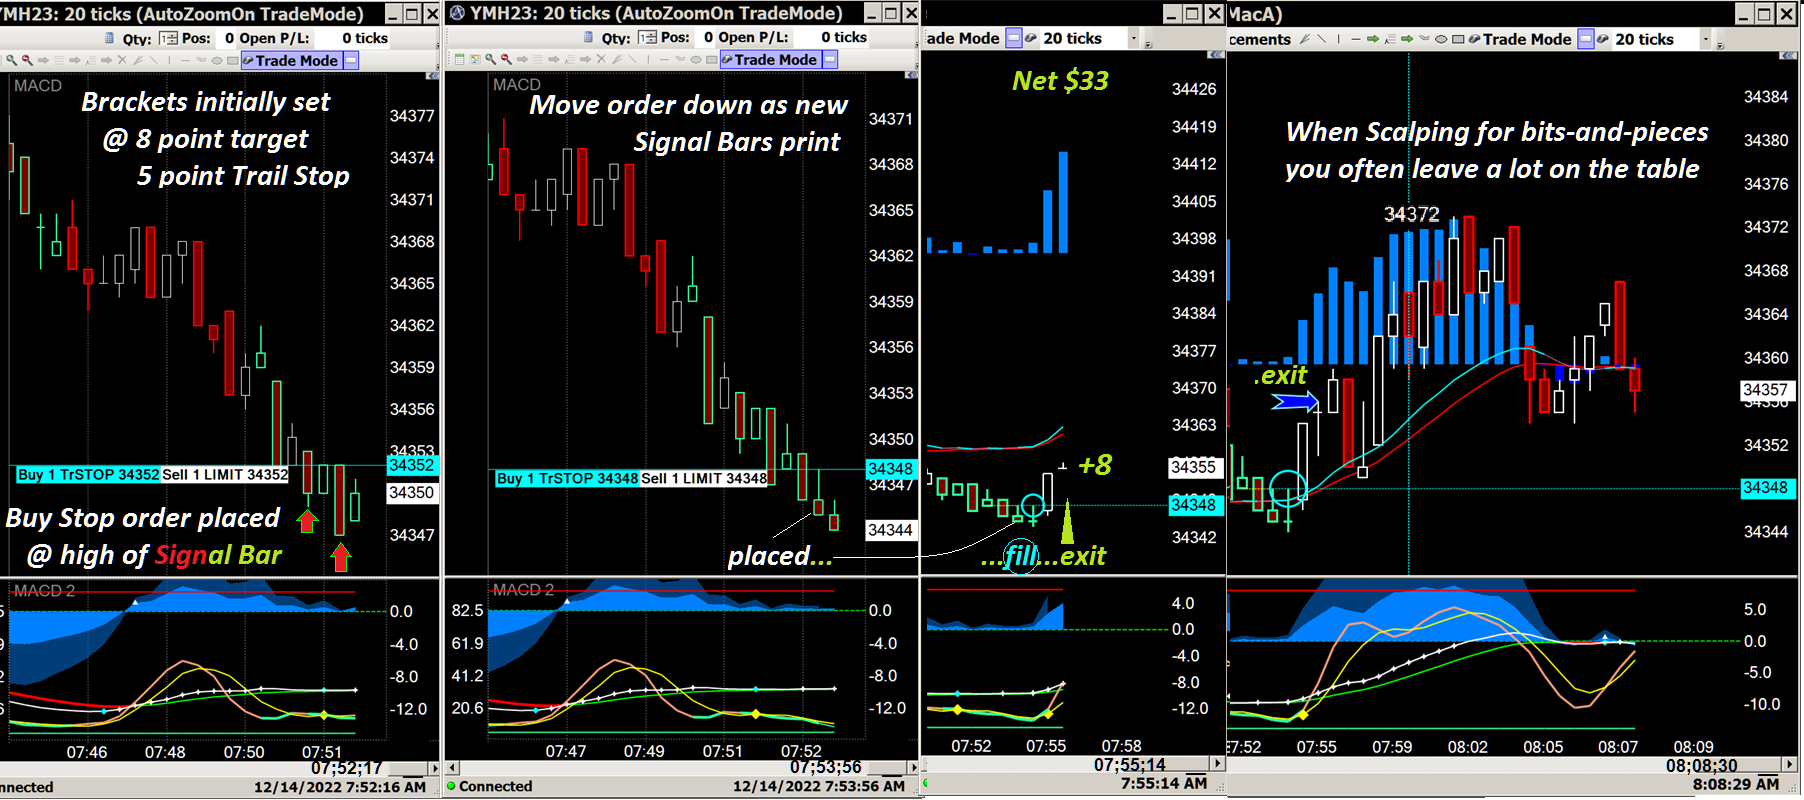
Explanation of a very short term methodology -
Enter using Buy-Stop brackets placed at the high of a completed Signal Bar.
The idea is that price must move up in the proper direction to catch a fill but will not fill if price drops.
Signal Bars are negative and high-lighted with lime outlines when an oversold stochastic is turning up...(created with paint bars)
"Practice trades"...essential tools to have in your bag-of-tricks
Use practice trades to gauge current market conditions
and to test your methodologies without risking your trading capital.
Switch between "practice and live" throughout the session...
Fine tune your feel for the trade
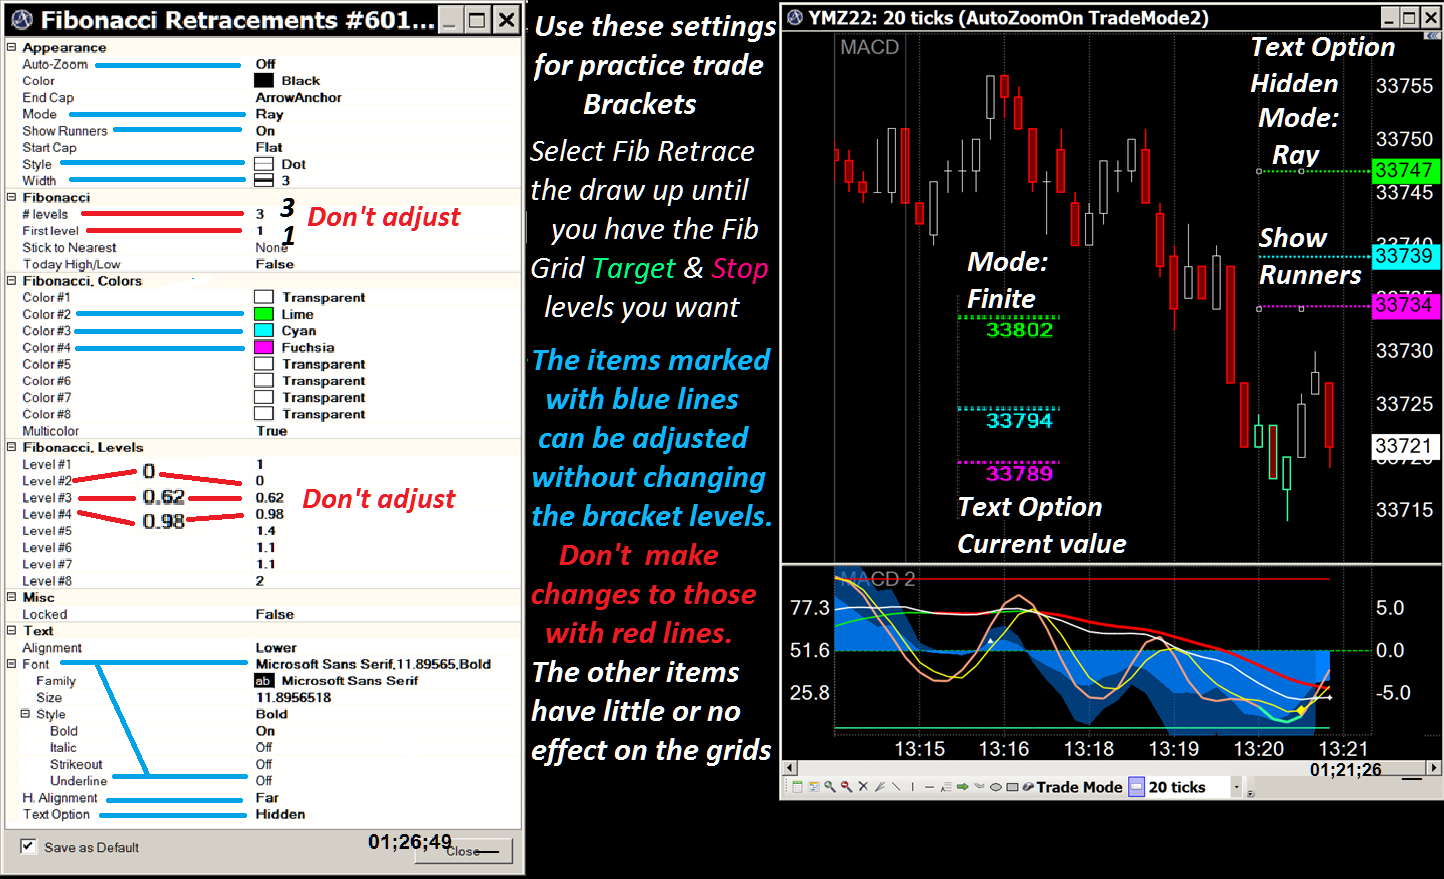
Setup properties to change the Fibonacci Retracement drawing tool into the Fib-Grid tool
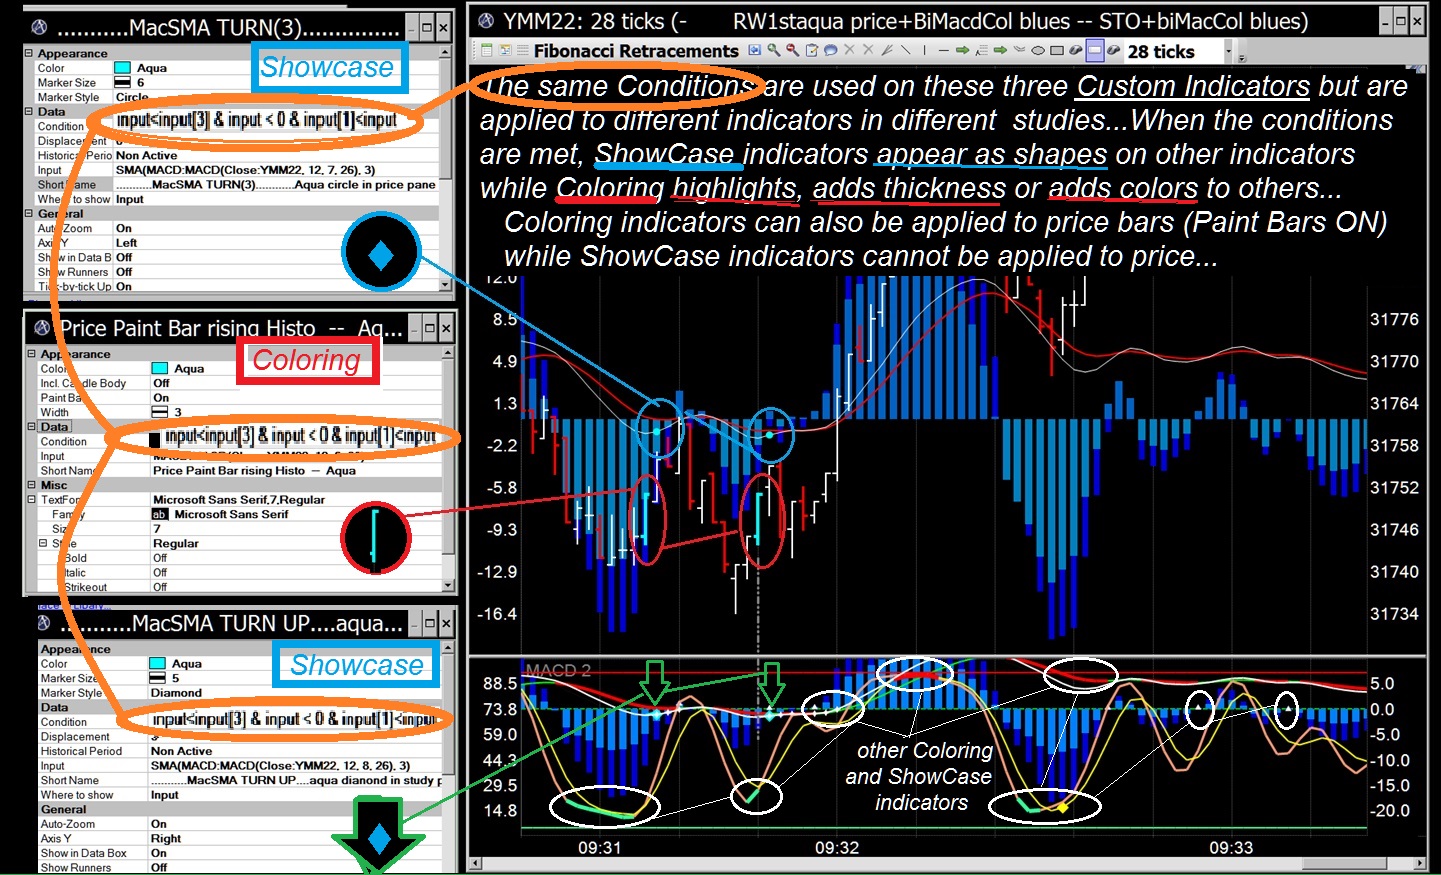
Custom Indicators - Coloring and ShowCase
These allow ApexTrader users to add formulas for high-lighting aspects of
their charts that they may find interesting, regularly occurring or important
They differ from drawing tools which must be manually chosen and placed on charts...
Custom Indicators get shown automatically if they are saved to a particular template.
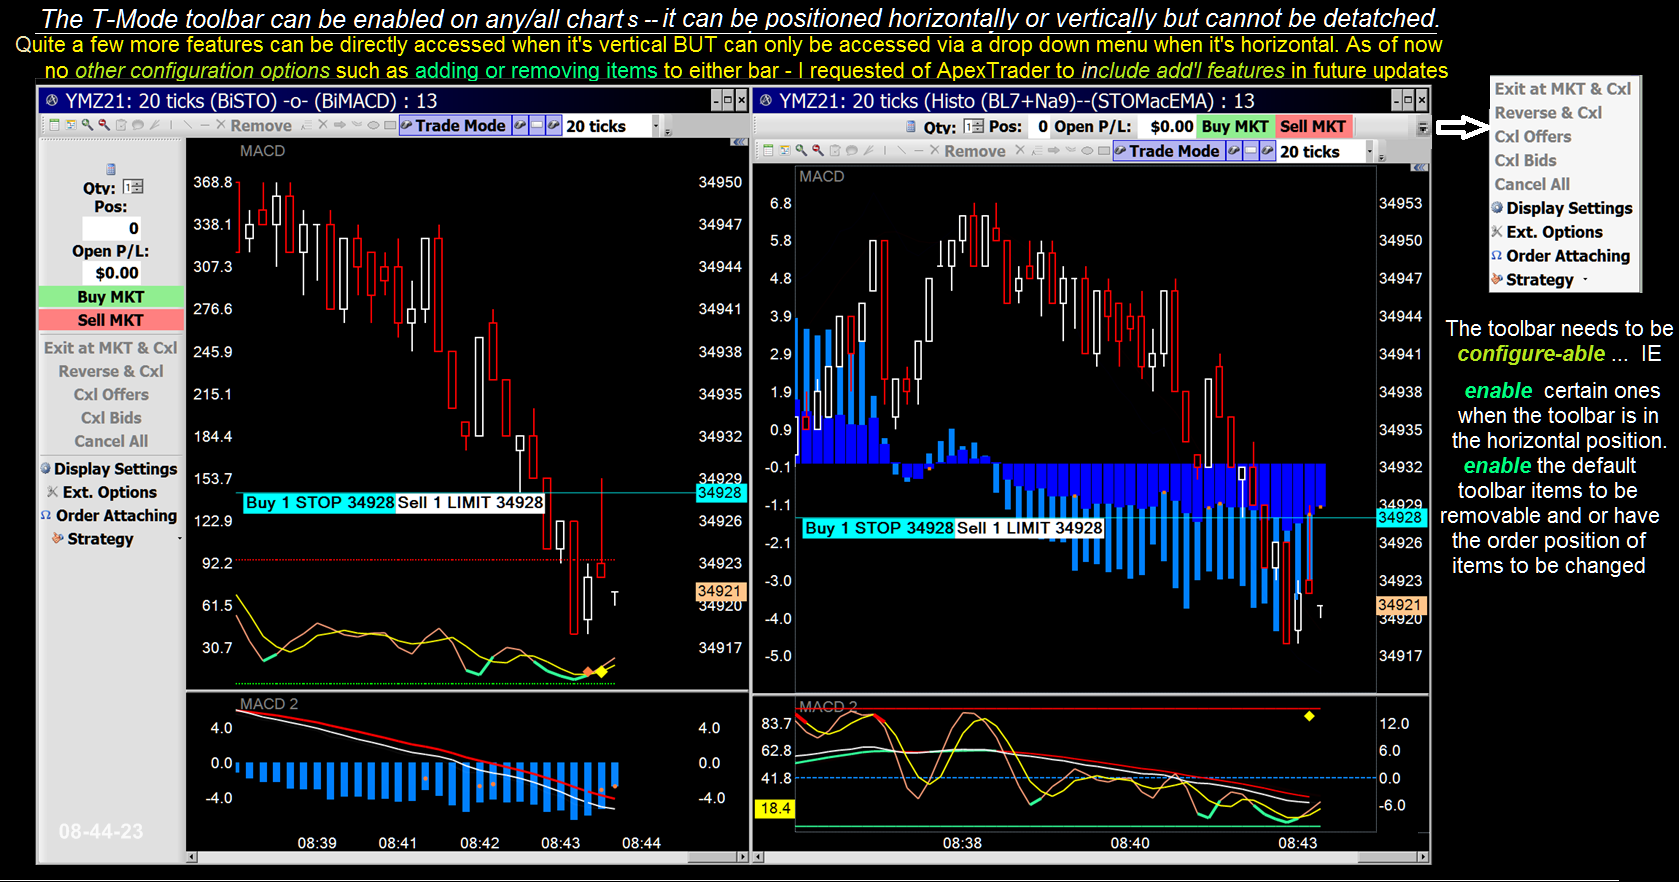
Trade-Mode Toolbar - just recently discovered it 's movable
... to the left, right, top or bottom of the chart.
Unless you run full screen , some of the items are not easily accessed on the fly
when you enable the horizontal mode. Note how much space it takes up in the vertical mode.
So I've sent in an email request to info@apexfutures.com in hopes they'll consider
some changes when they next upgrade ApexTrader
Develop methods to cut thru the madness
Mine are explained on my free blog - no sign-up, no ads or tracing
There are many different ways to obtain multiple monitor trade stations...
You can buy one from a company that specializes in making them:
This link goes to Day Trading Computers as an example of what is available.
Or build one yourself - do you have some older unused monitors laying around?
If your current machine has extra video strips on the motherboard, you can install video cards and hook up more monitors.
Or
You can buy inexpensive video adapters that use USB connections and install up to 6 more screens...This link goes to a TigerDirect page with many different adapters that are available
Windows 7 and 10 operating systems can accommodate more than 10 monitors of differing sizes and resolutions.
Below shows my trade station set up - it was built in 2012 running Win 7...it has 2 Dual Video cards and 4 video adapters for operating 8 monitors in total...
Still running fine after all those years.
Trade Station layouts and configurations . . .
How many monitors and charts do you really need?
In the past I've used 10-11 monitors and 10-15 charts but I've narrowed
them both down quite a bit over the years...currently 7 monitors with 5 charts are used.
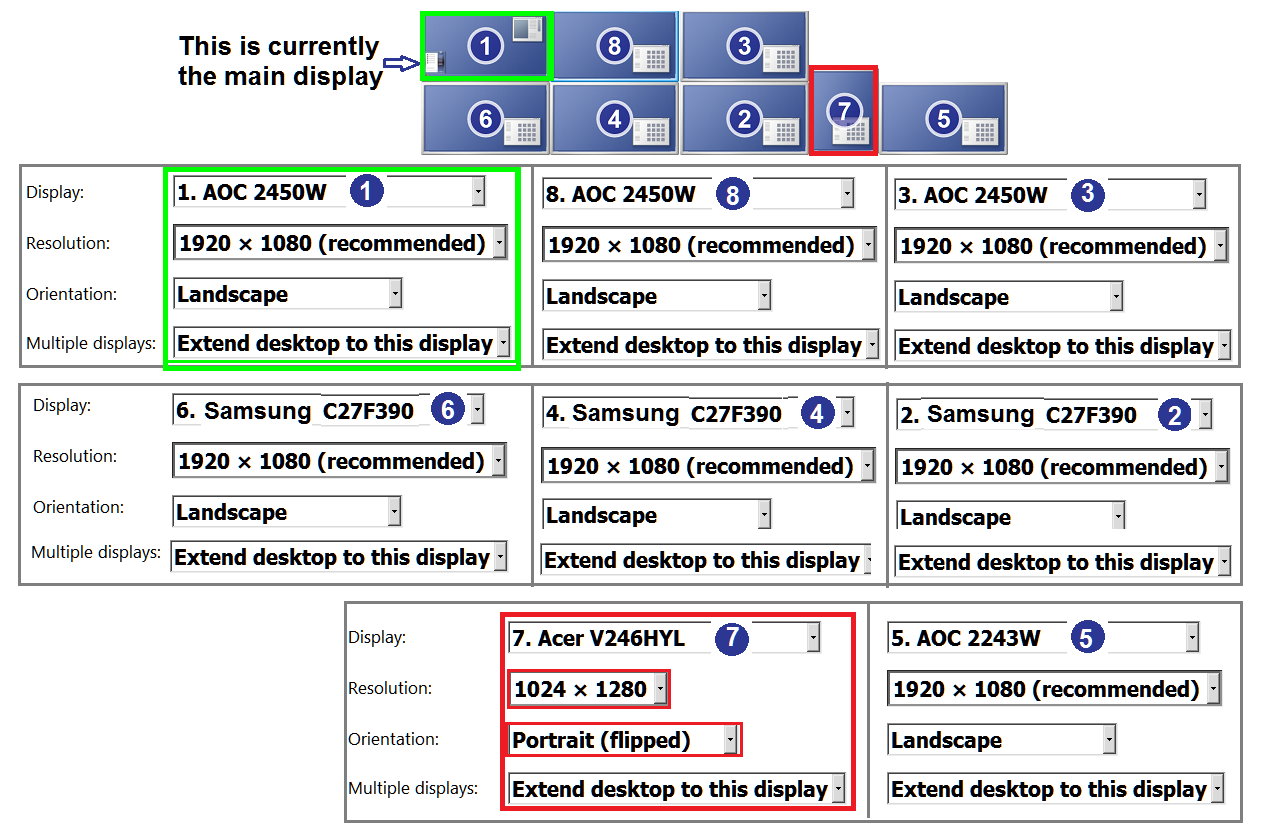
All monitors are the same diagonal sizes and are set to 1920 x 1080 resolution
but #6 is rotated 90º with a lower resolution...
.png)
I use monitor 6 as my main trading screen.
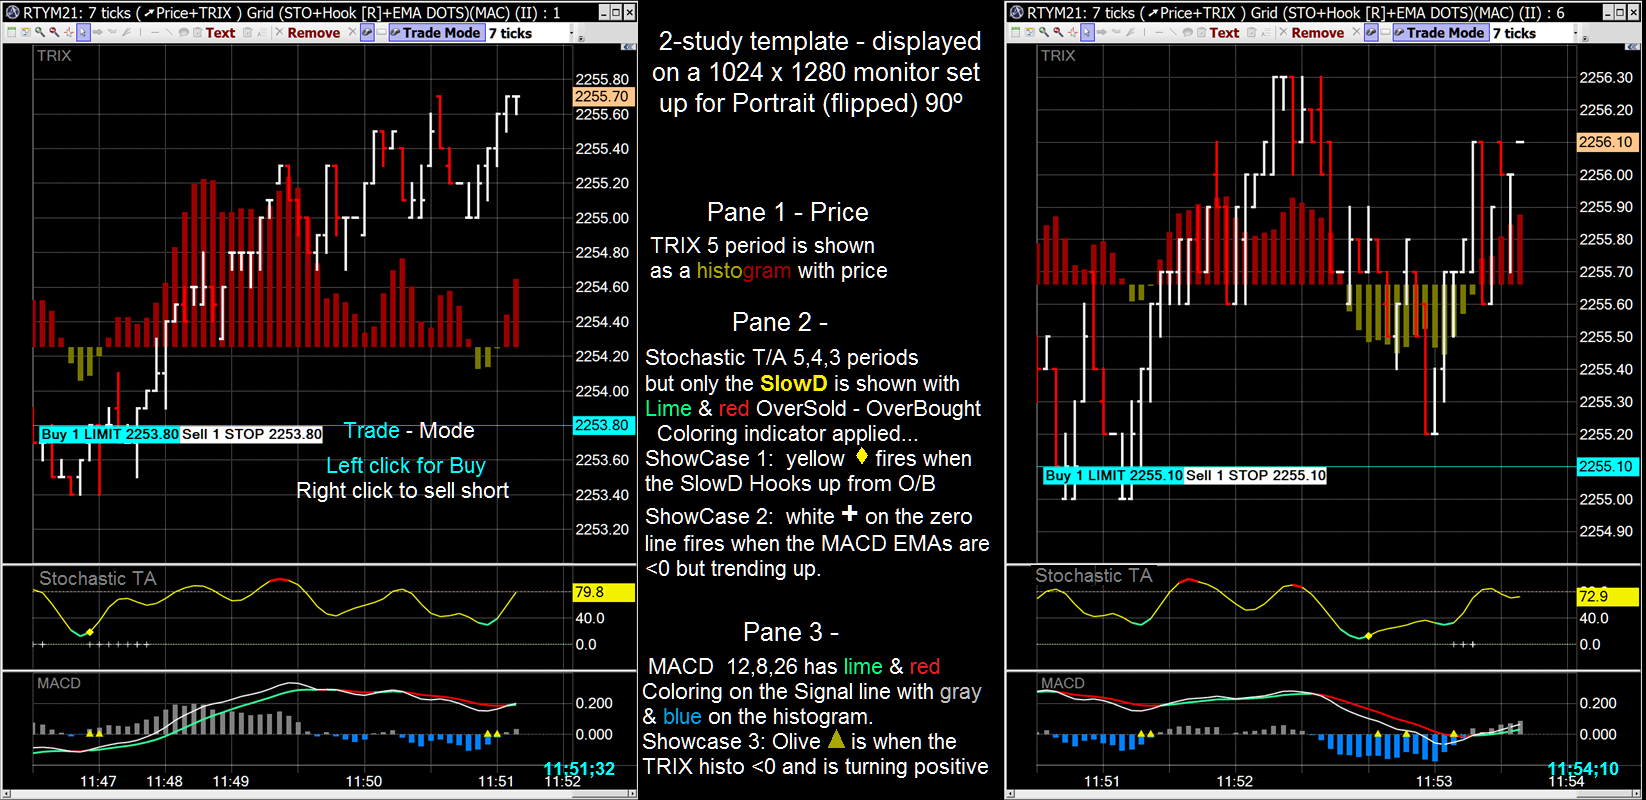
I like viewing two of the same (or similar) tick-per-bar charts with differing
widths...it can be helpful for perspective when deciding to place an order.
The right hand chart below shows about twice the activity of the left hand chart
Although the indicator parameters are the same on both charts it's sometimes
easier to see price-to-indicator relationships with separate studies.
Compare the charts on #6 monitor (LH chart) and #2 monitor (RH chart)...
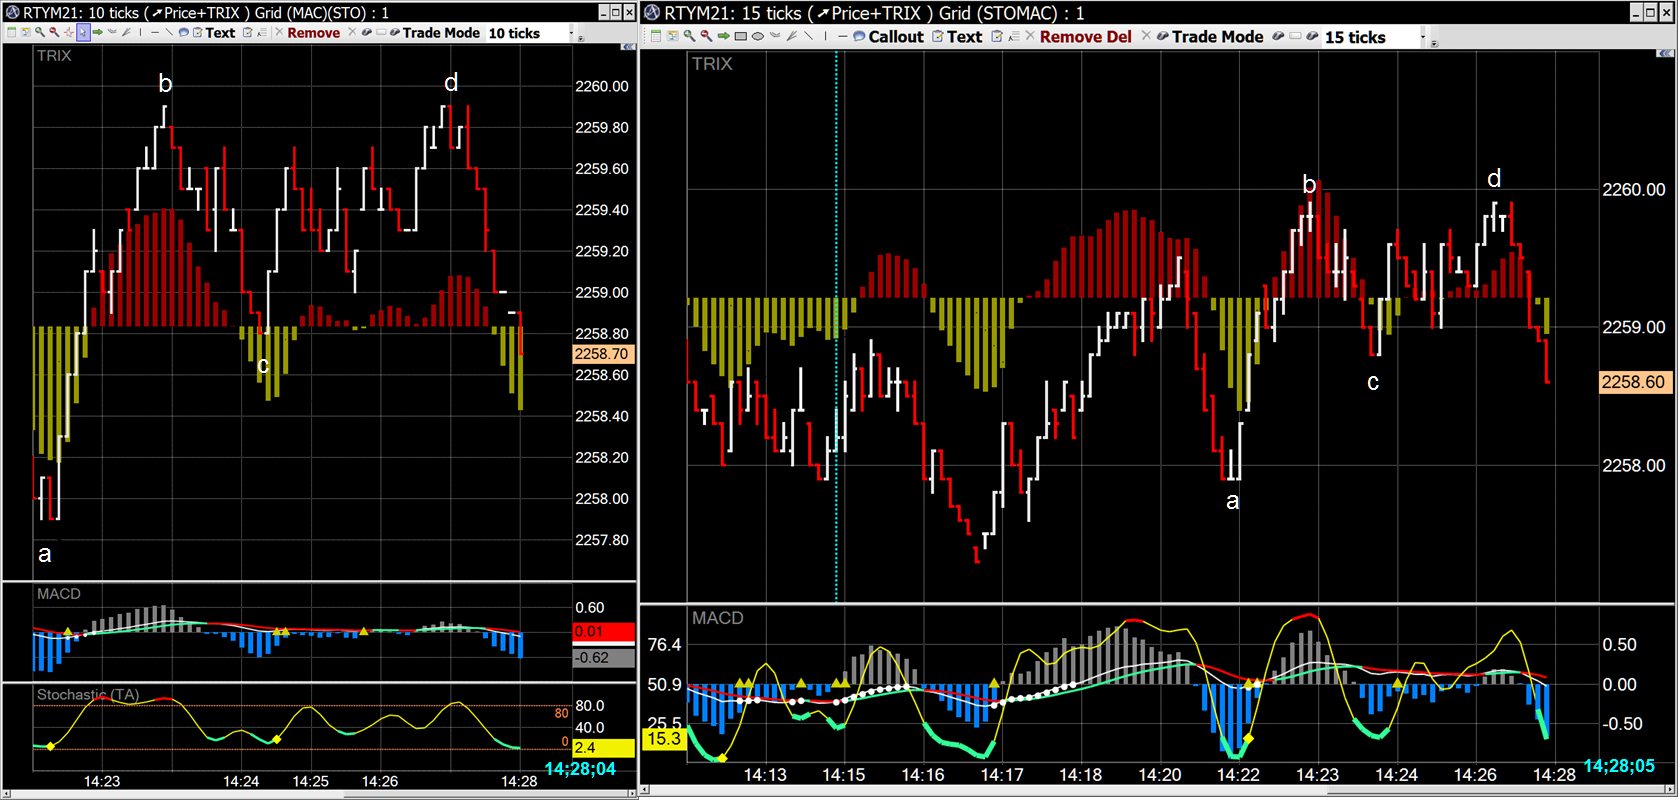
Admittedly I suffer from a mild case of dyslexia - I read whats on my trade Station monitors from right to left...
This malady is most apparent when I offer driving directions to people - my words come out correct
but my hand signals fail me (I point with my left hand when I say go to the right).

|
Followers
|
1
|
Posters
|
|
|
Posts (Today)
|
0
|
Posts (Total)
|
46
|
|
Created
|
02/18/20
|
Type
|
Free
|
| Moderator sharpshorts | |||
| Assistants | |||
ApexFutures broker and ApexTrader chart software
A reliable system for trading Futures, e-mini Futures and options on Futures.
There are no Pattern-Day-Trading requirements with futures trading.
Very low computer resources are required to operate the software.
Link to my system specs, built on Win 7 platform in 2012
Multiple chart layouts can be saved with many chart indicators available. Up to 10 charts
can be displayed on your trade station along with Quote windows, Account windows etc.
There's no problem running browsers and other programs with ApexTrader.
Link to layout examples
I've used ApexTrader since 2005. Before then I used MBT Trading
which was also a very good broker.
Many different chart types can be rendered: Line, OHLC, Area, Column, Range, Step Line.
I prefer candlestick tick charts for multi-session through short term trading charts
| Volume | |
| Day Range: | |
| Bid Price | |
| Ask Price | |
| Last Trade Time: |
