News
News  Market Data
  Discover
Support: 888-992-3836
Copyright © 2023 InvestorsHub Inc.


Register for free to join our community of investors and share your ideas. You will also get access to streaming quotes, interactive charts, trades, portfolio, live options flow and more tools.
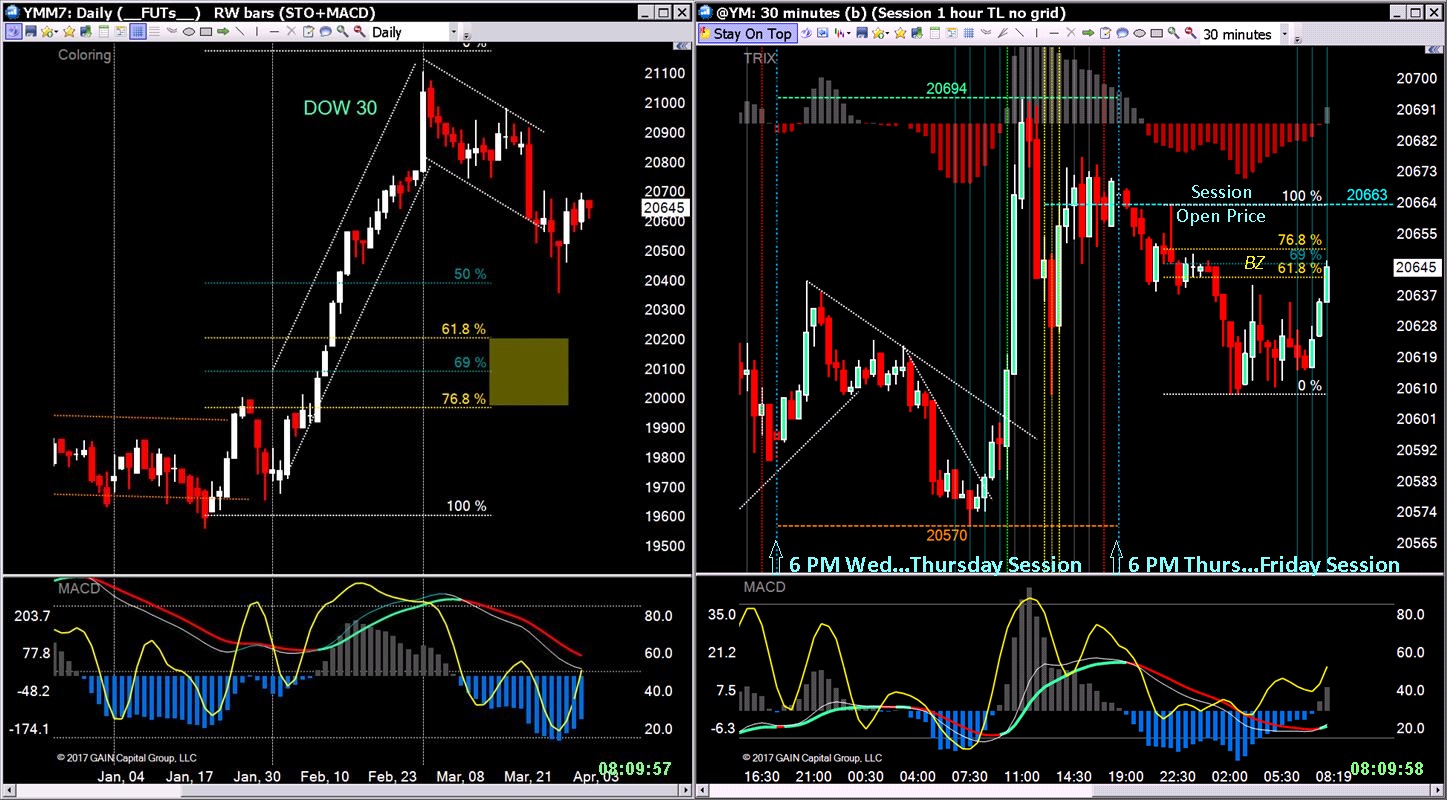
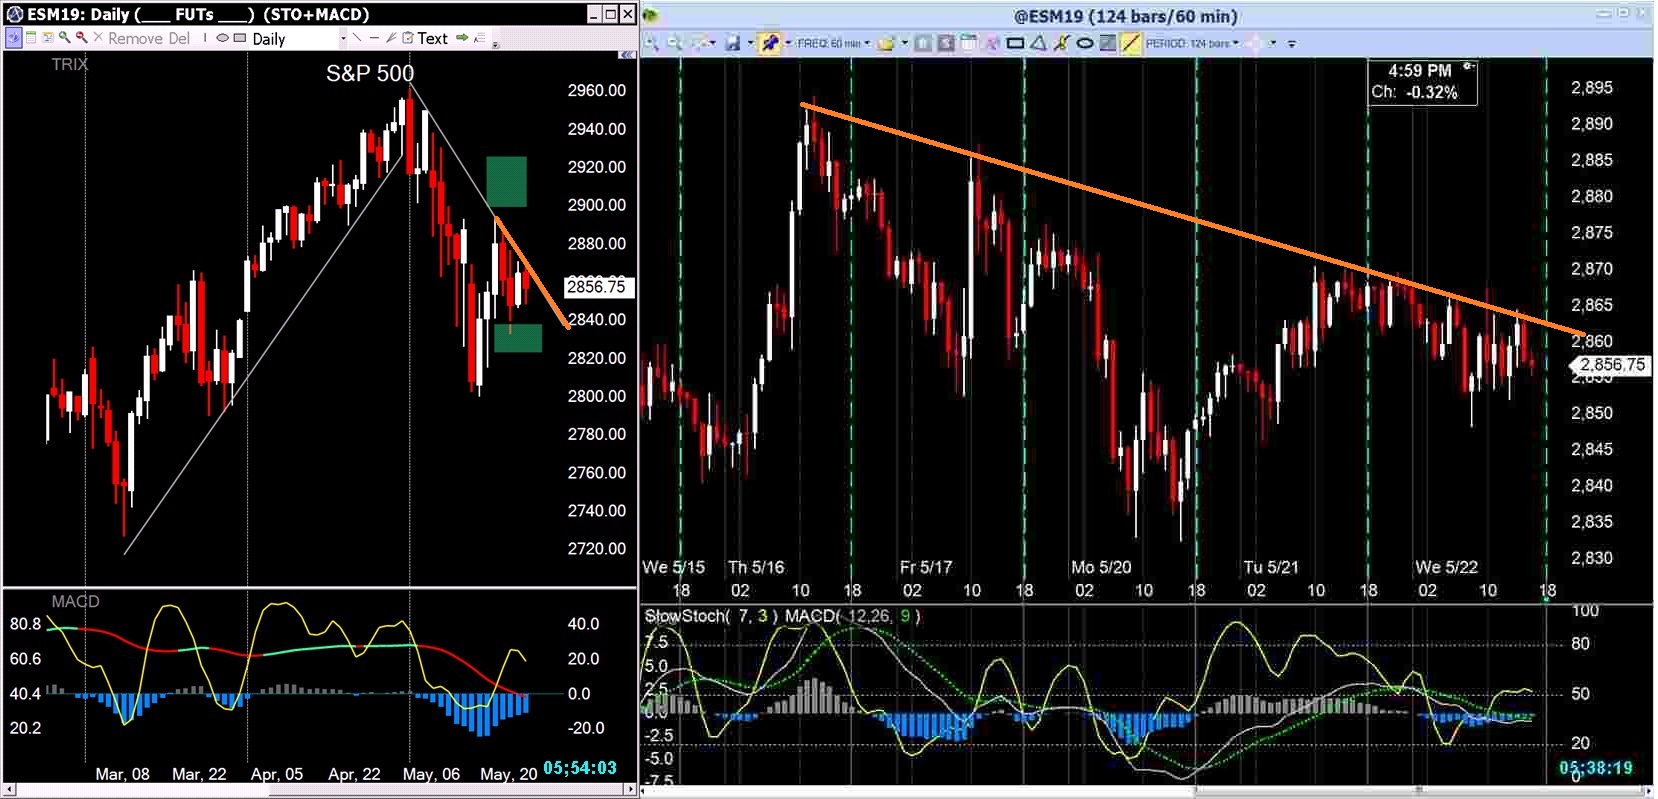
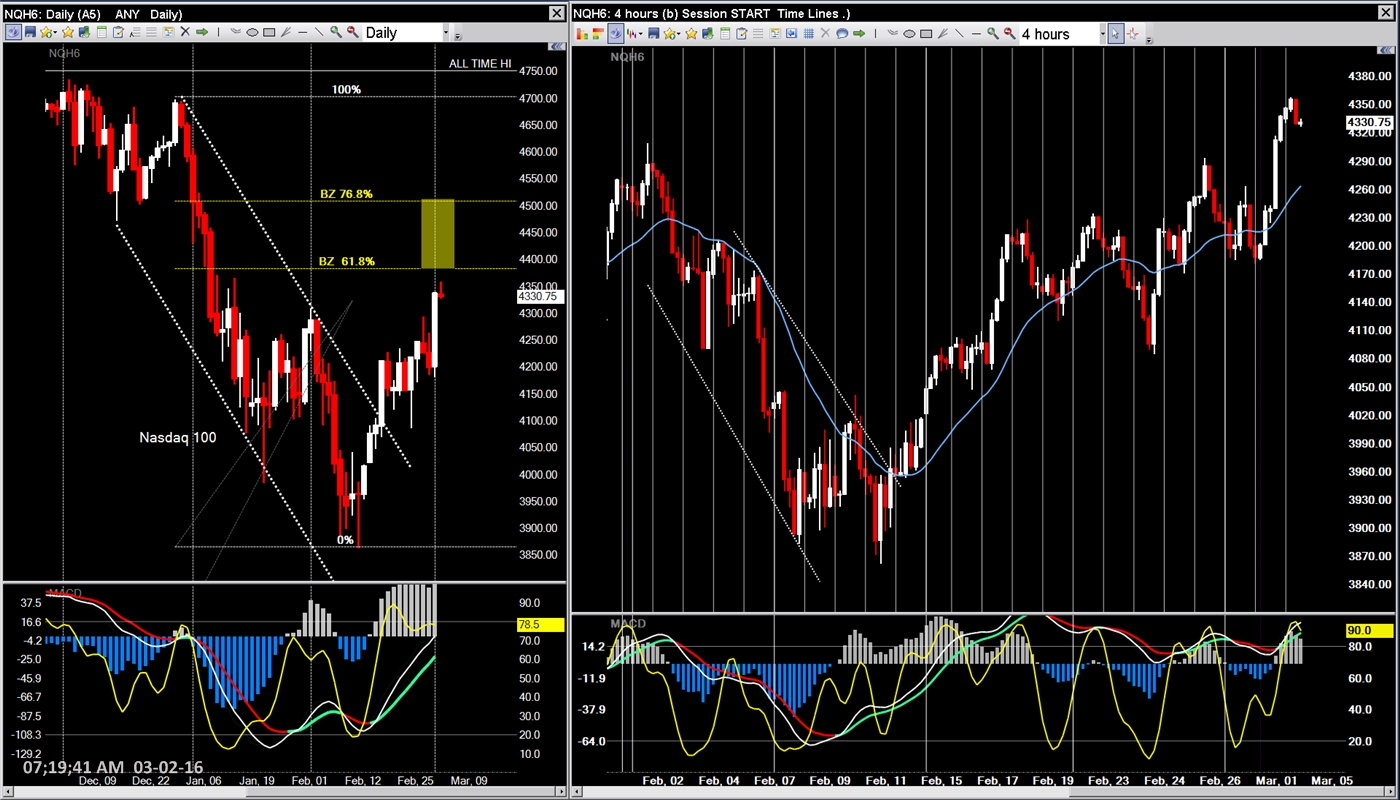
Retraces since the election of a moron...Weekly

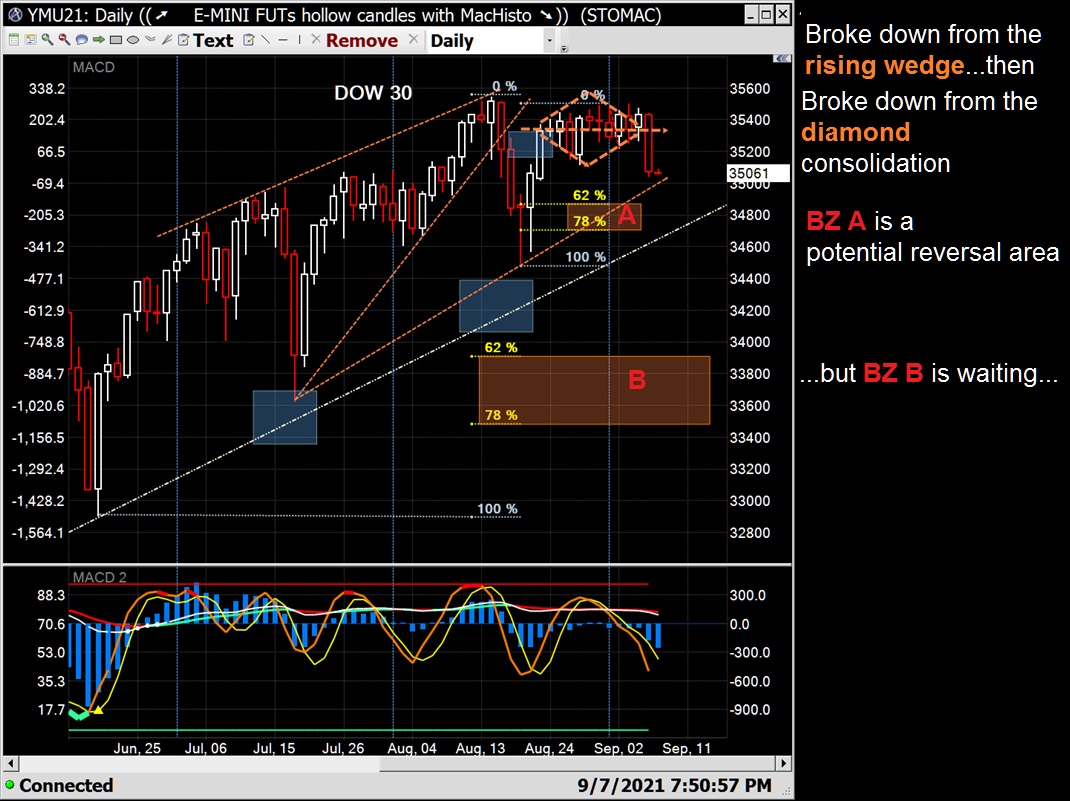
Channel break - anticipating a drop here

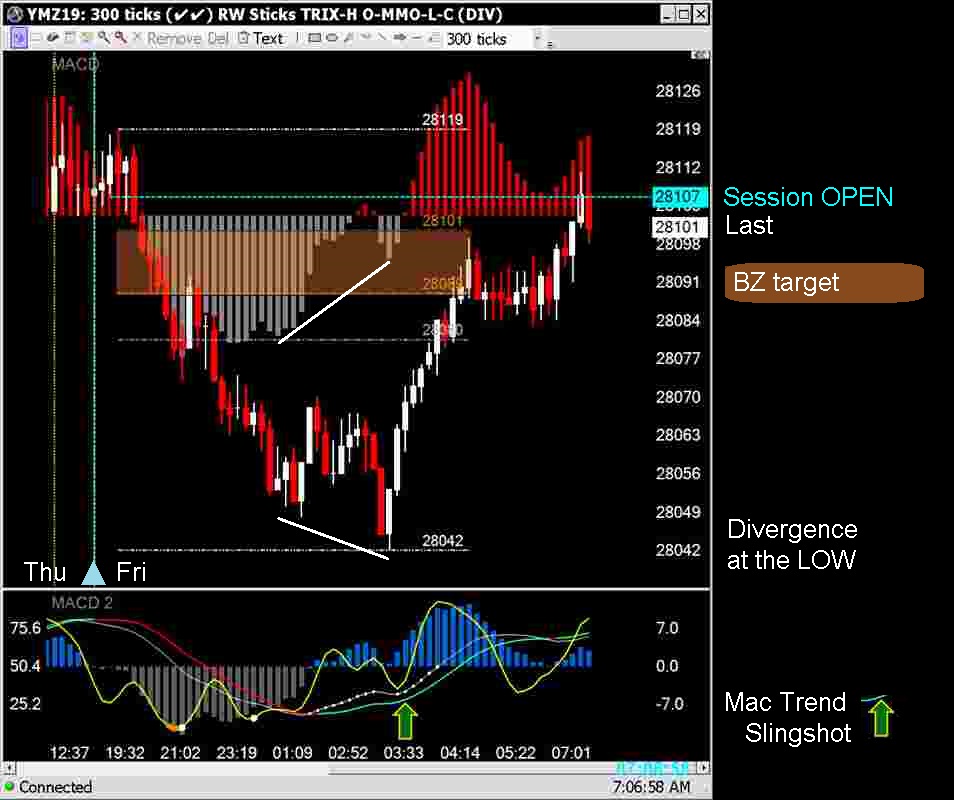
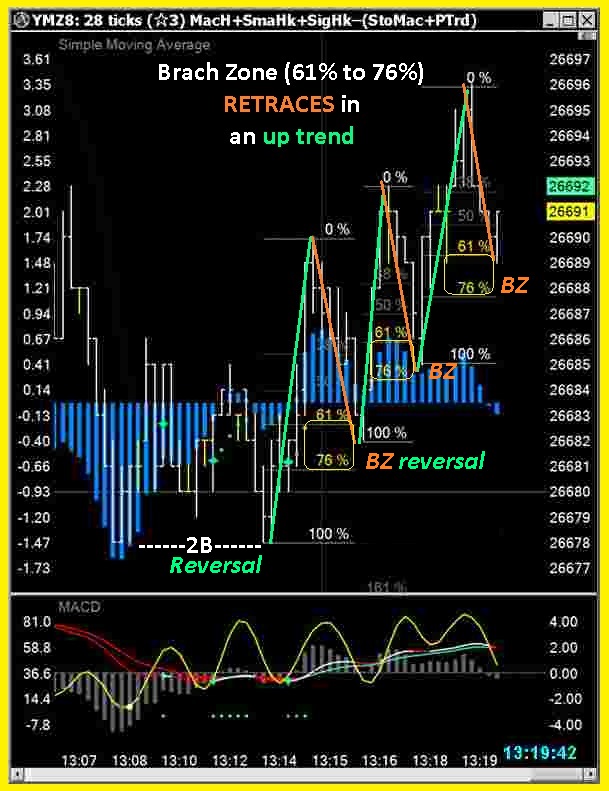
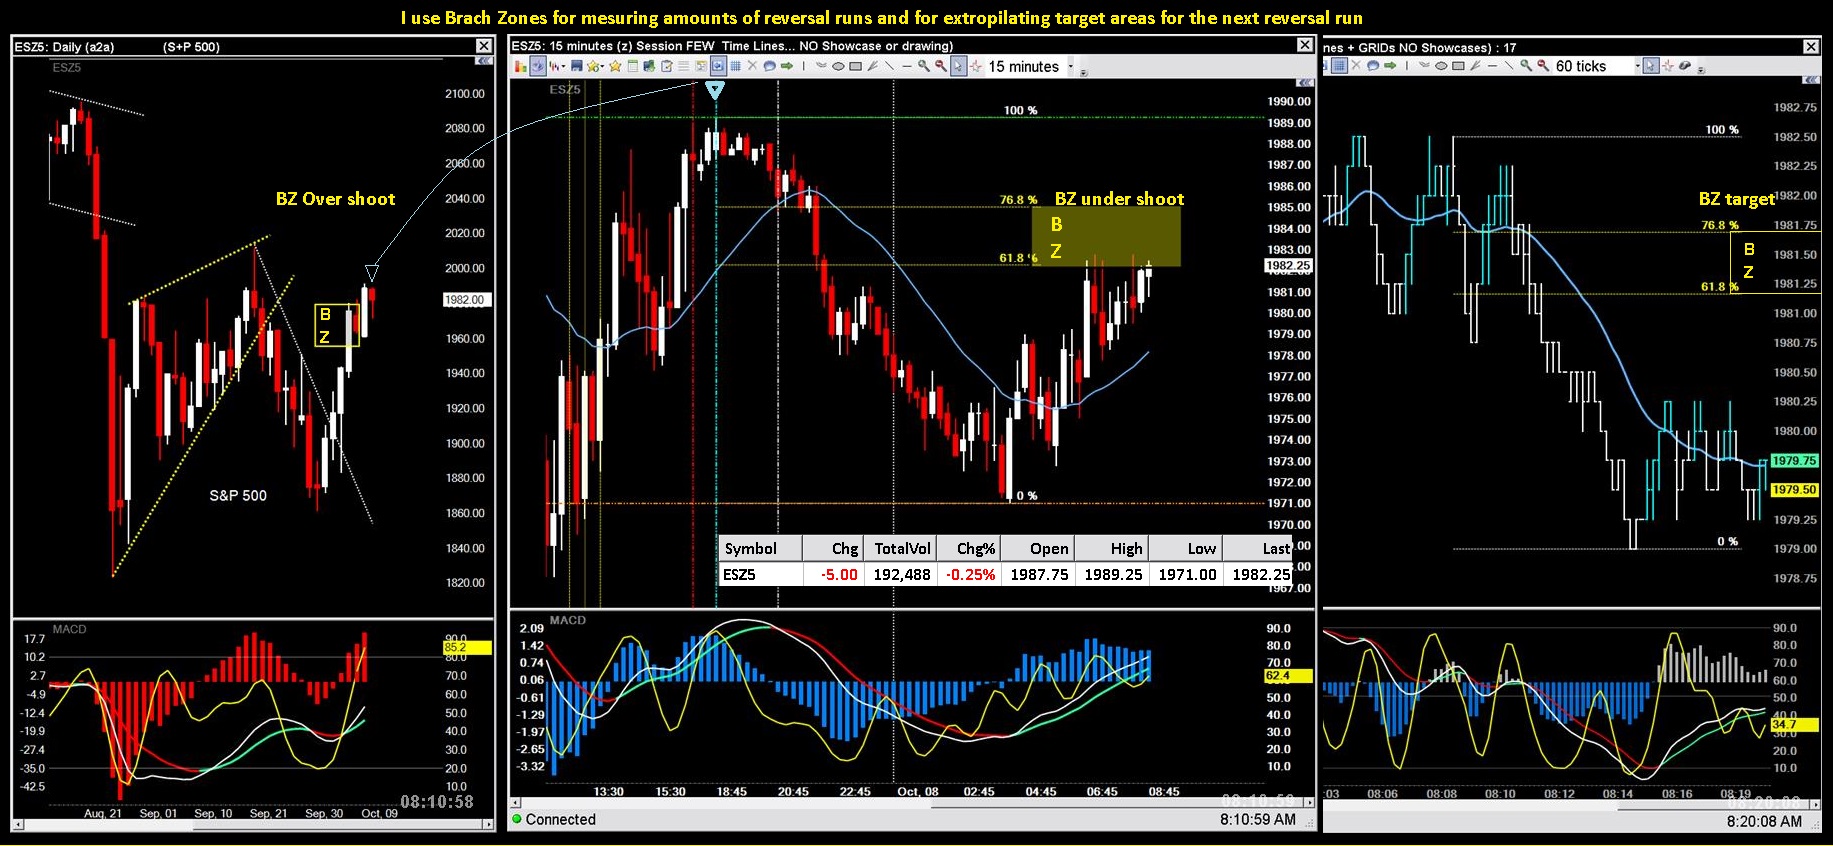
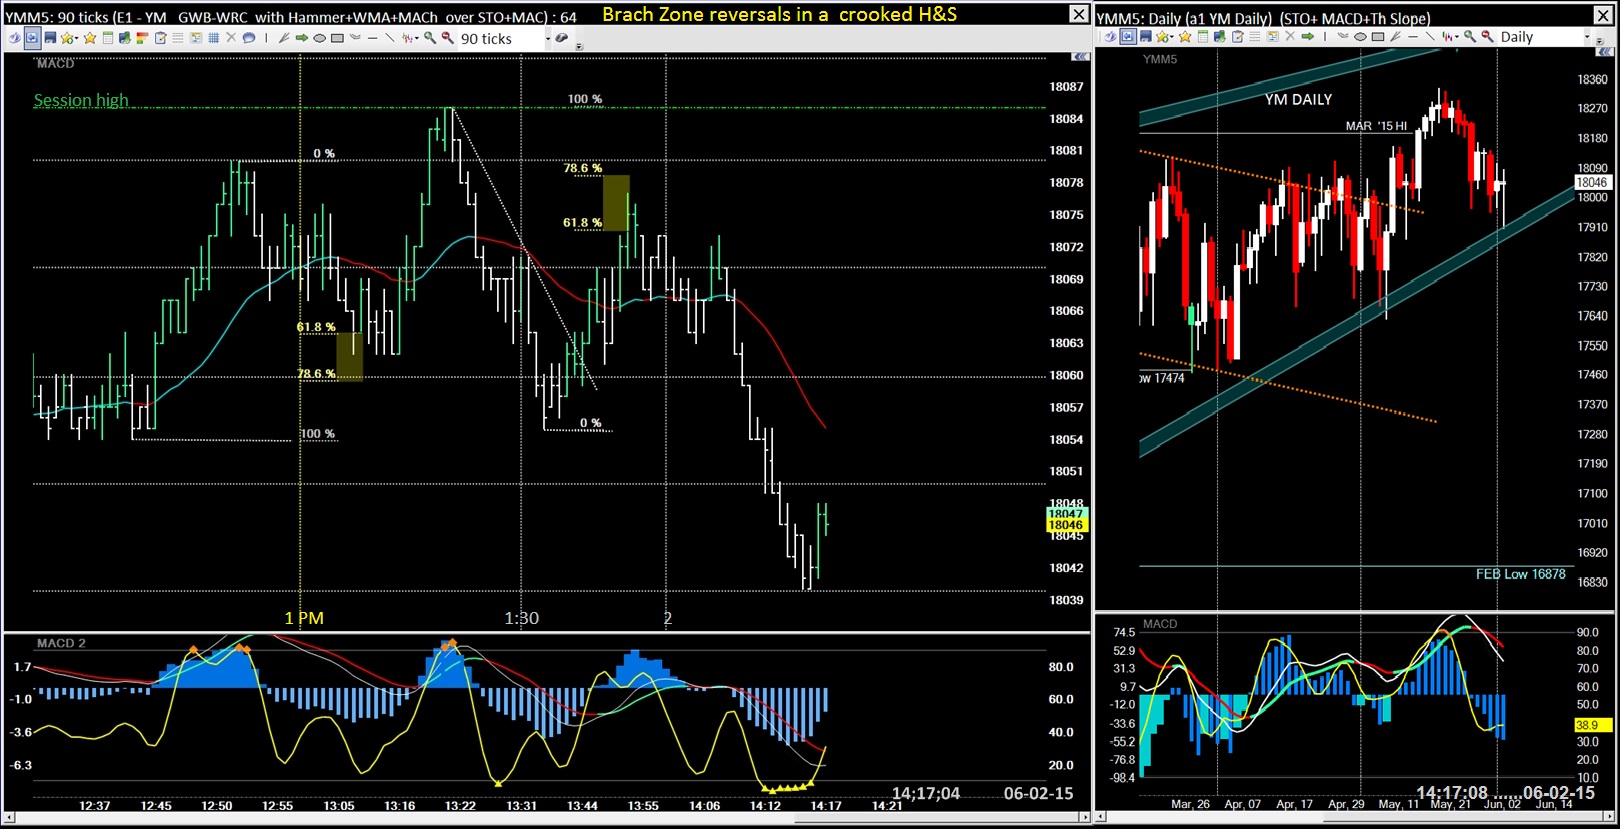
BZ retraces... up-or-down - on any time frame
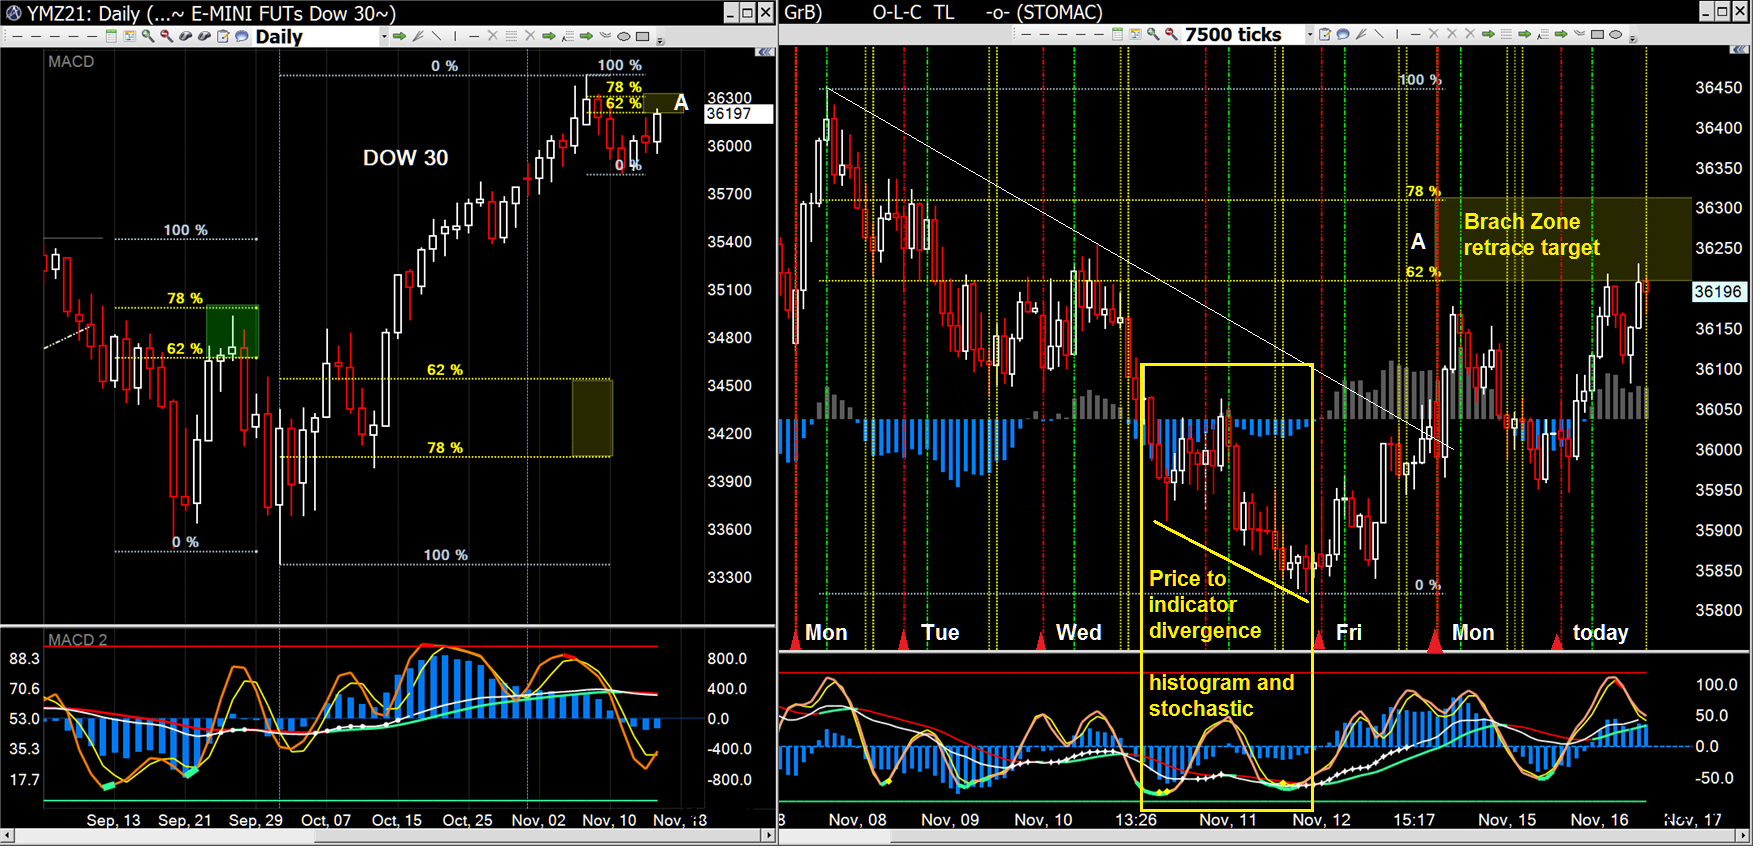
Dancing toward the Brach-Zone in a rising channel.
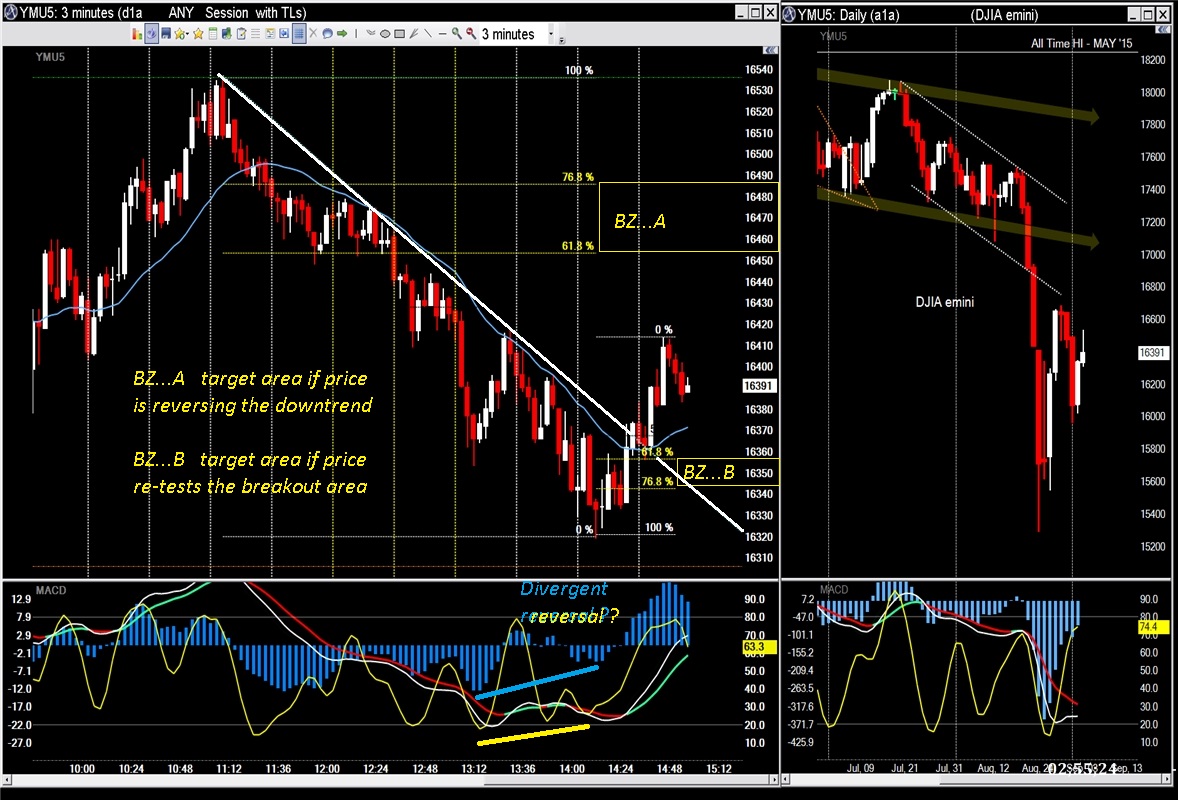
Long lower candlestick tails on the daily suggest an end to this down-leg move plus
stochastic is poised for continuing up and out of the oversold area on both charts.
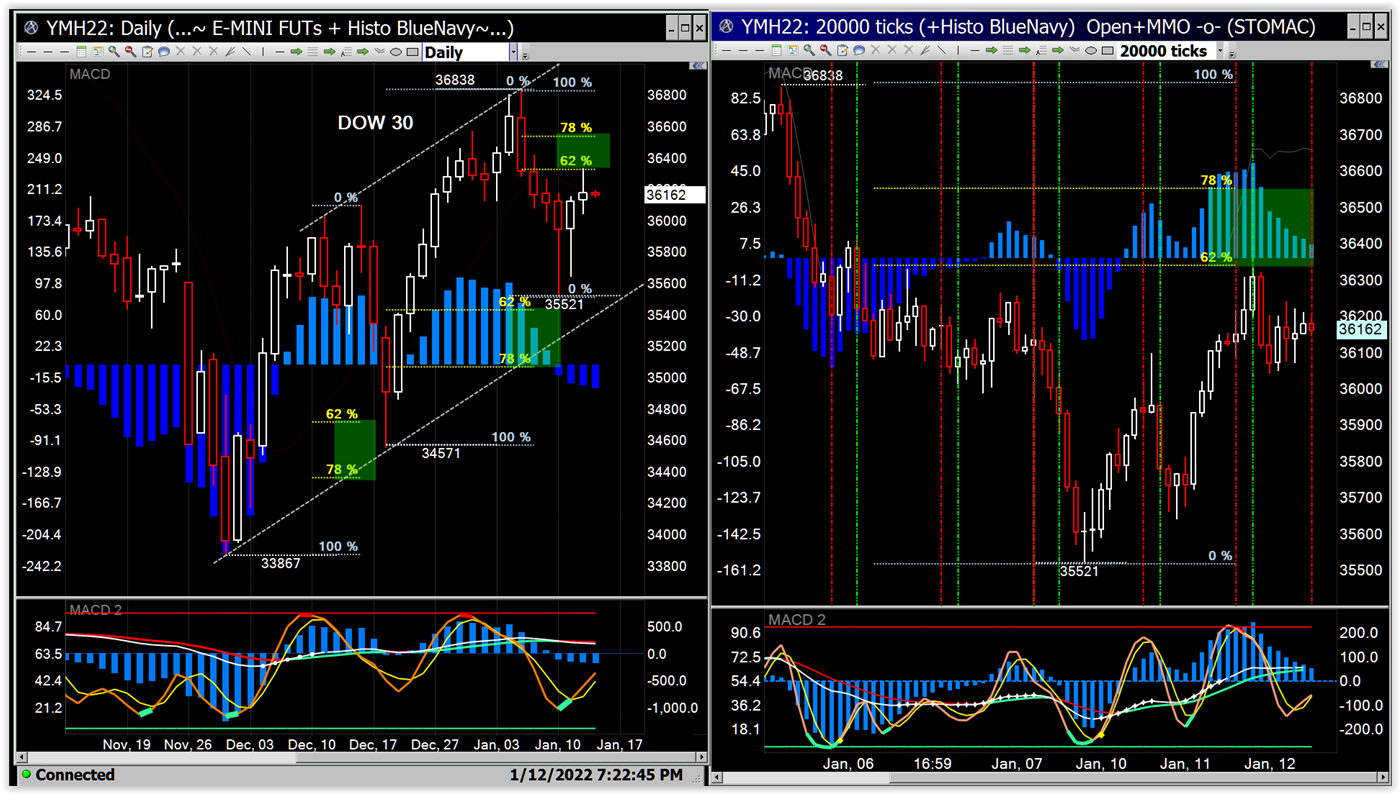
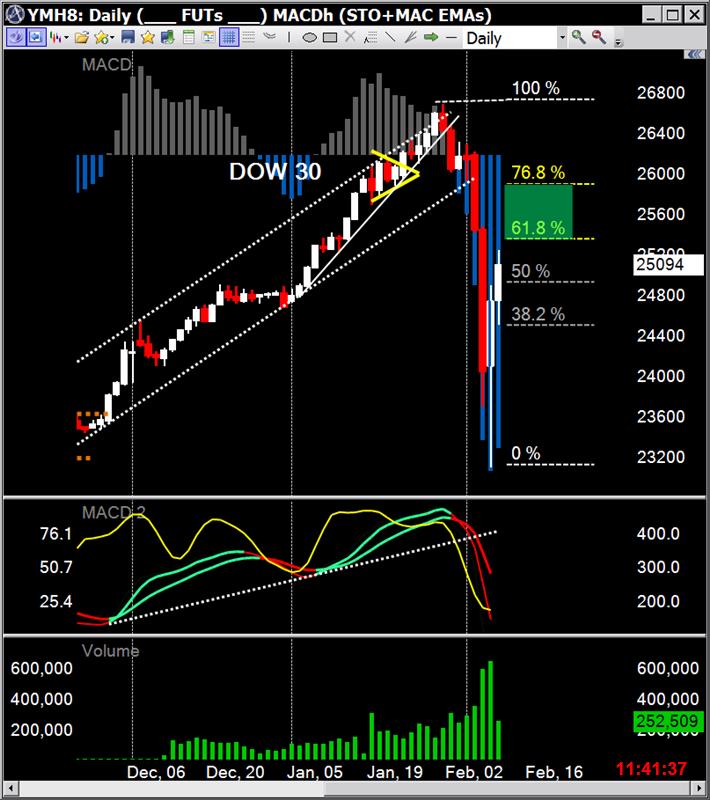
Brach Zone target for this leg - achieved
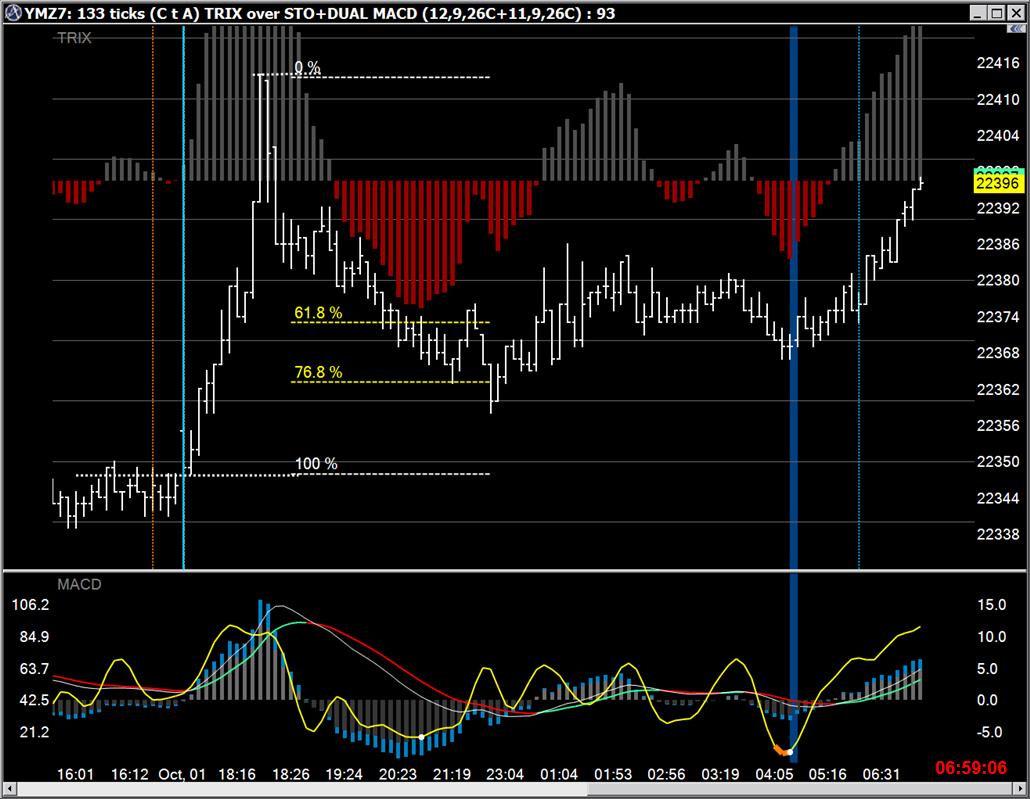
Divergence signals last Thursday marked the bottom...
That's when you draw your Brach Zone Fibonacci grid and place your order.
This reversal was good for 350 points so far - $1750 per contract
Not too shabby for 2 1/2 sessions.
Brach Zone target area for this leg up
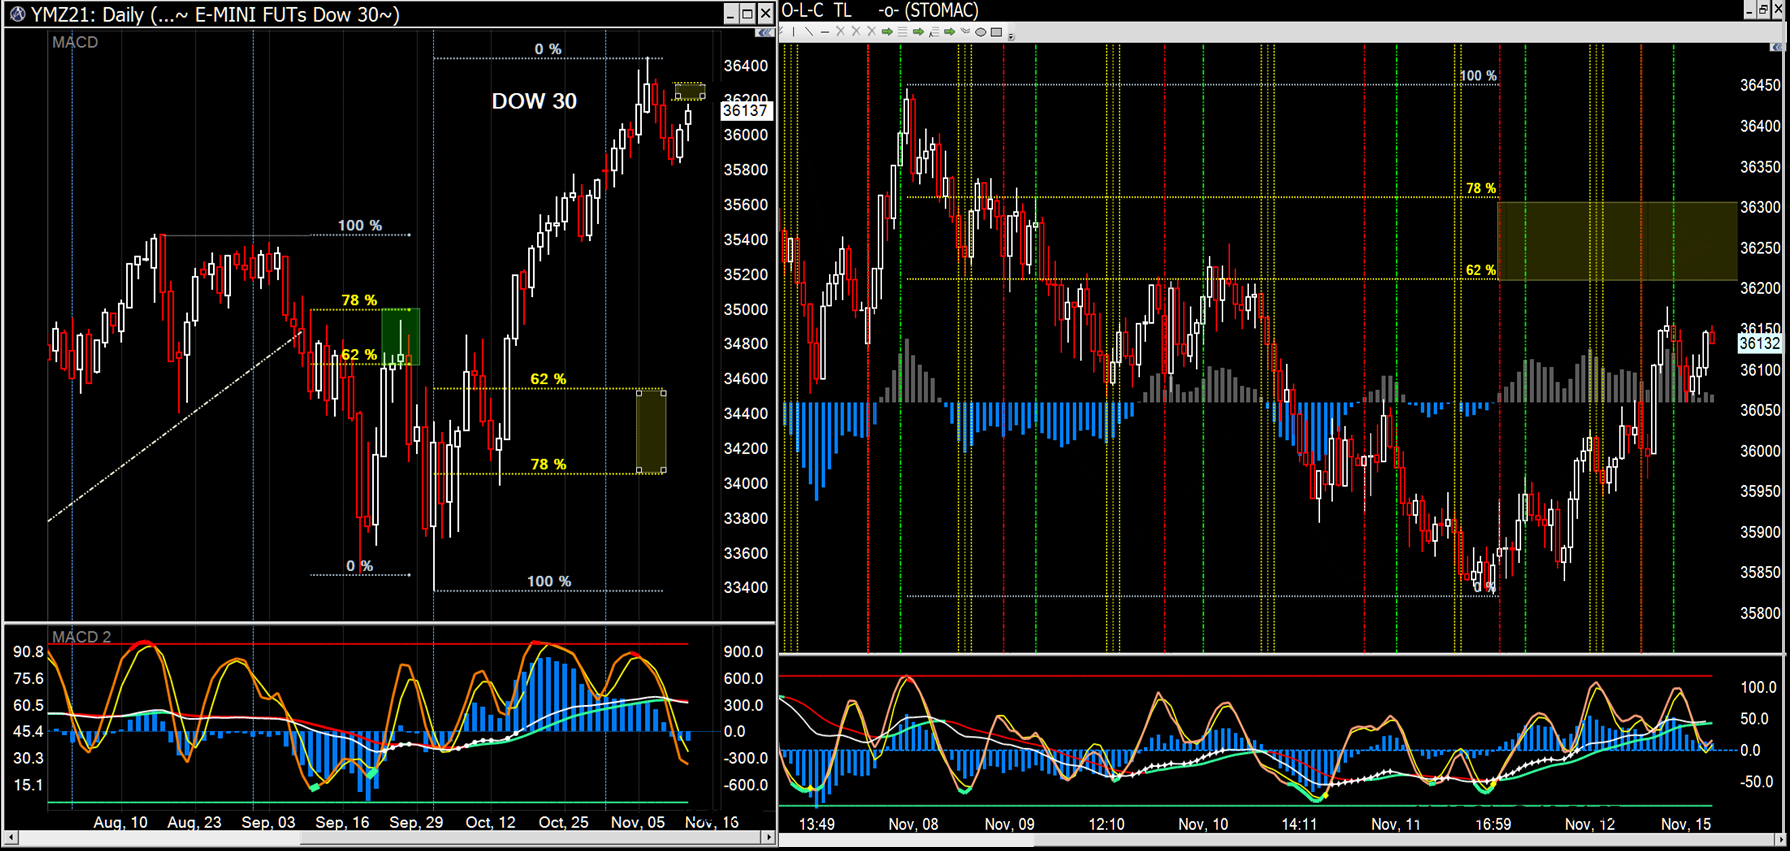
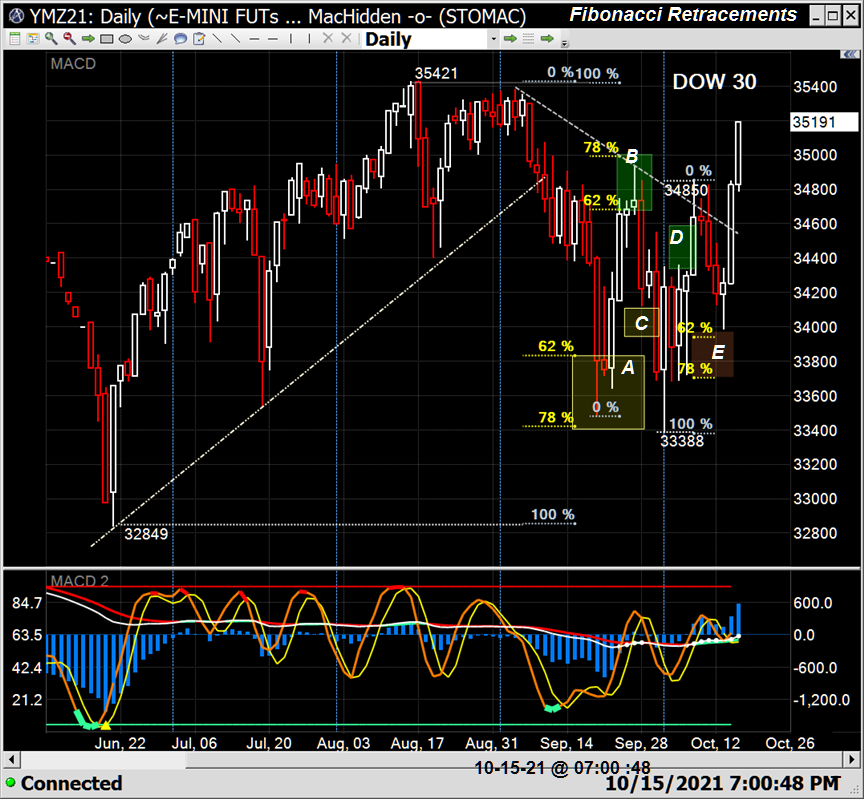
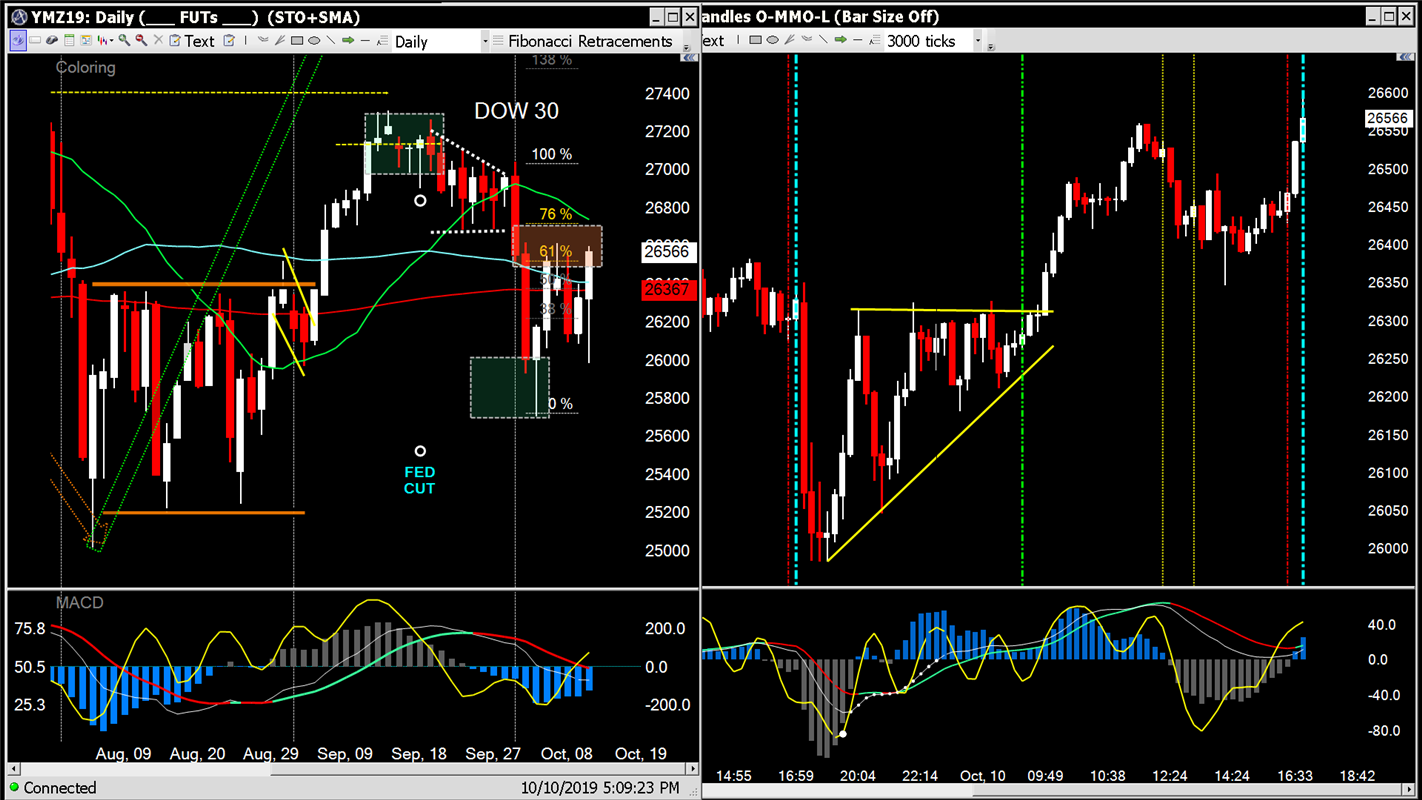
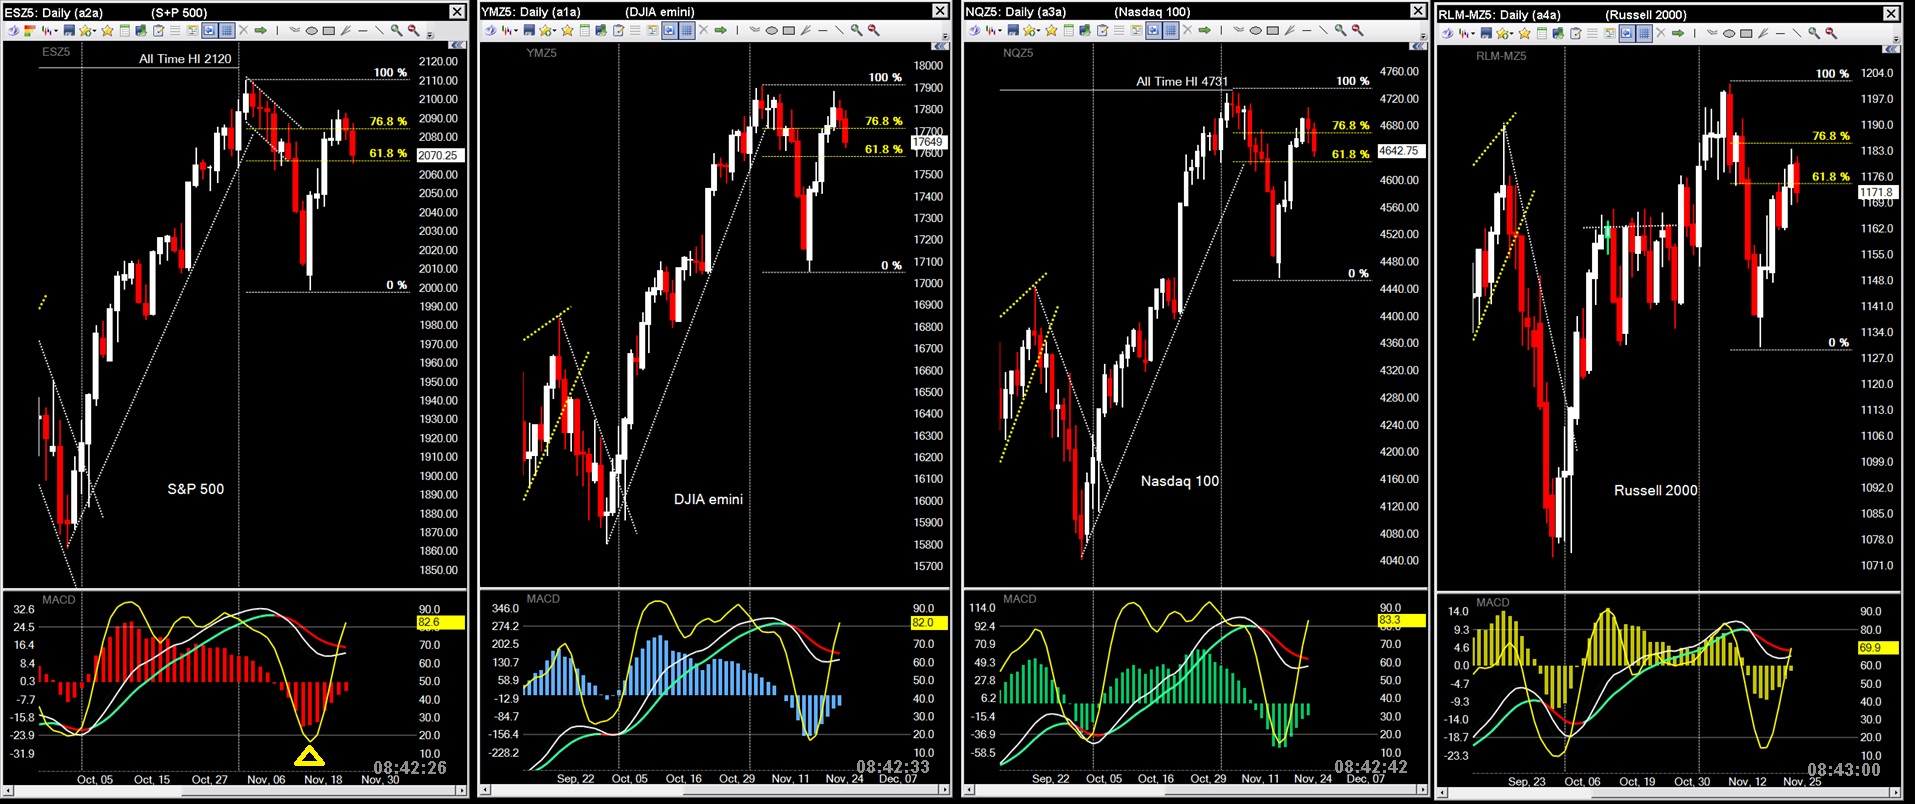
Brach Zone retraces for Sep-Oct :
Perfect retrace areas shown by A and B followed by
an OVER-shoot down @ C, and OVER-shoot up @ D and an UNDER-shoot down @ E
which defines the consolidation, leading to the breakout...
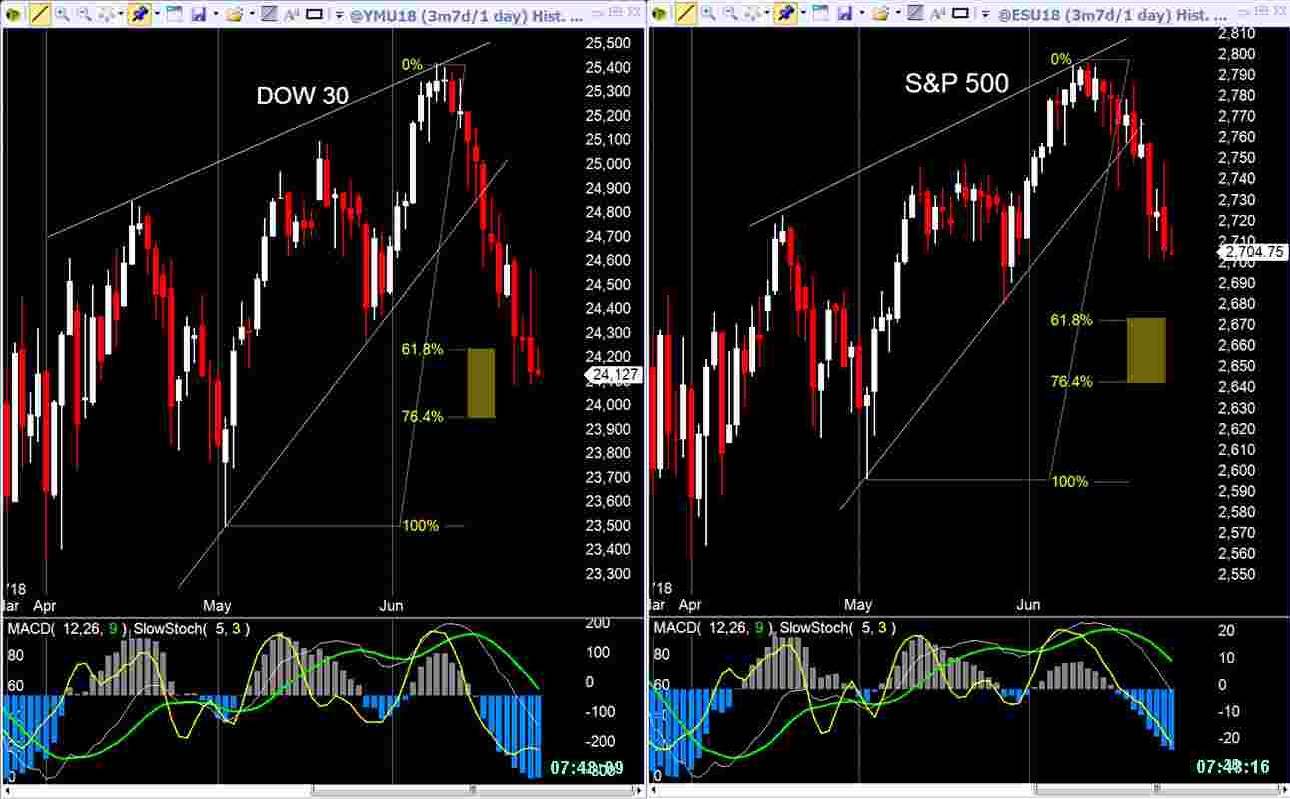
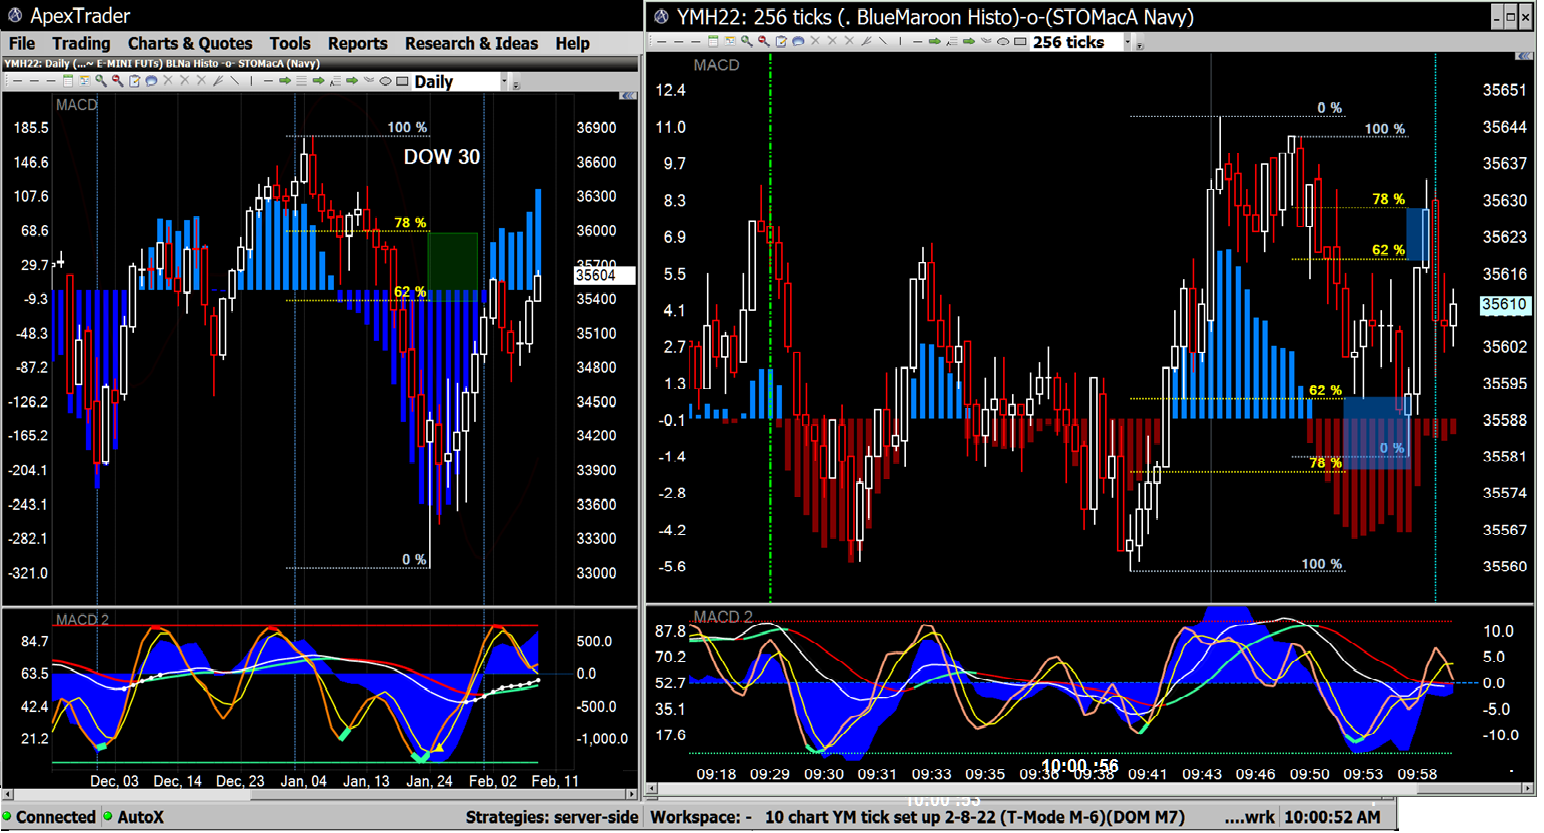
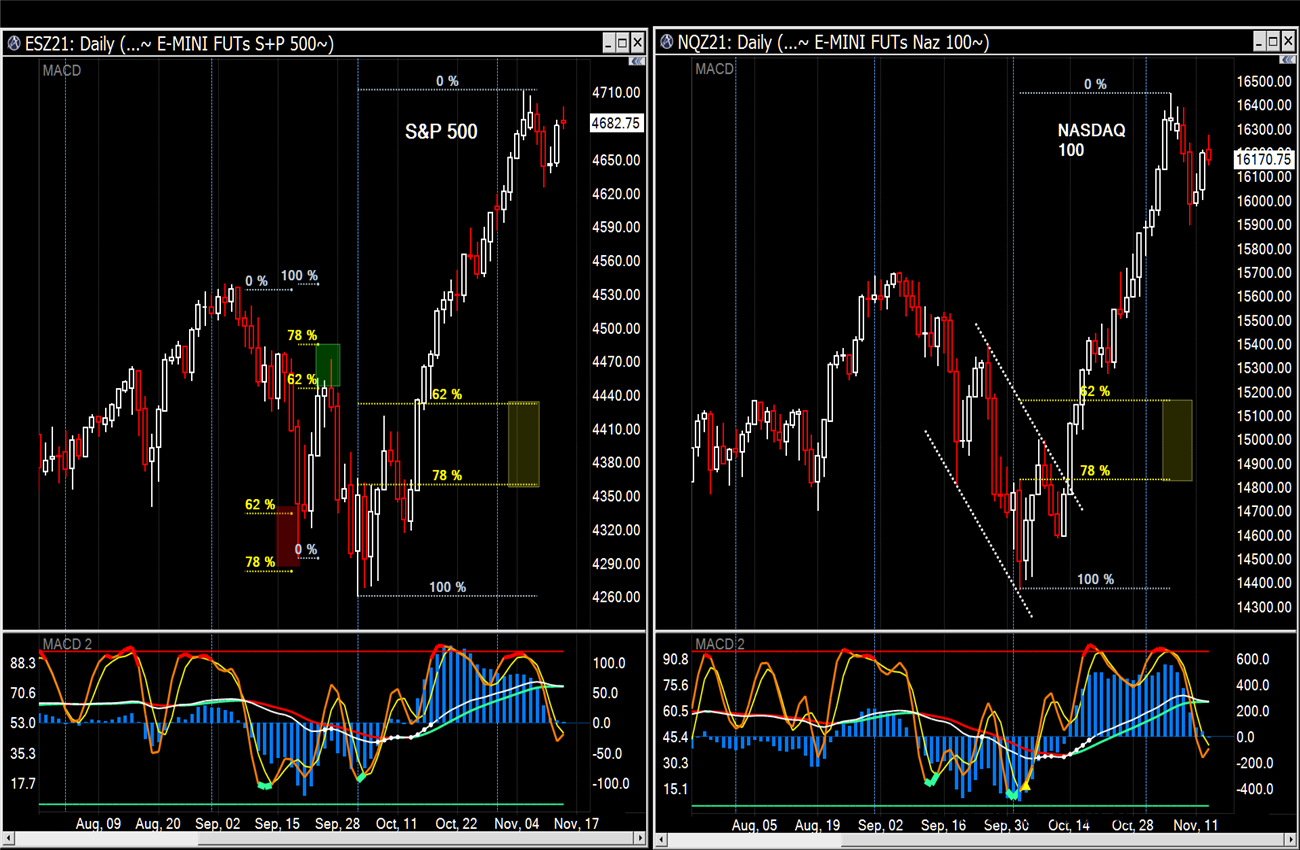
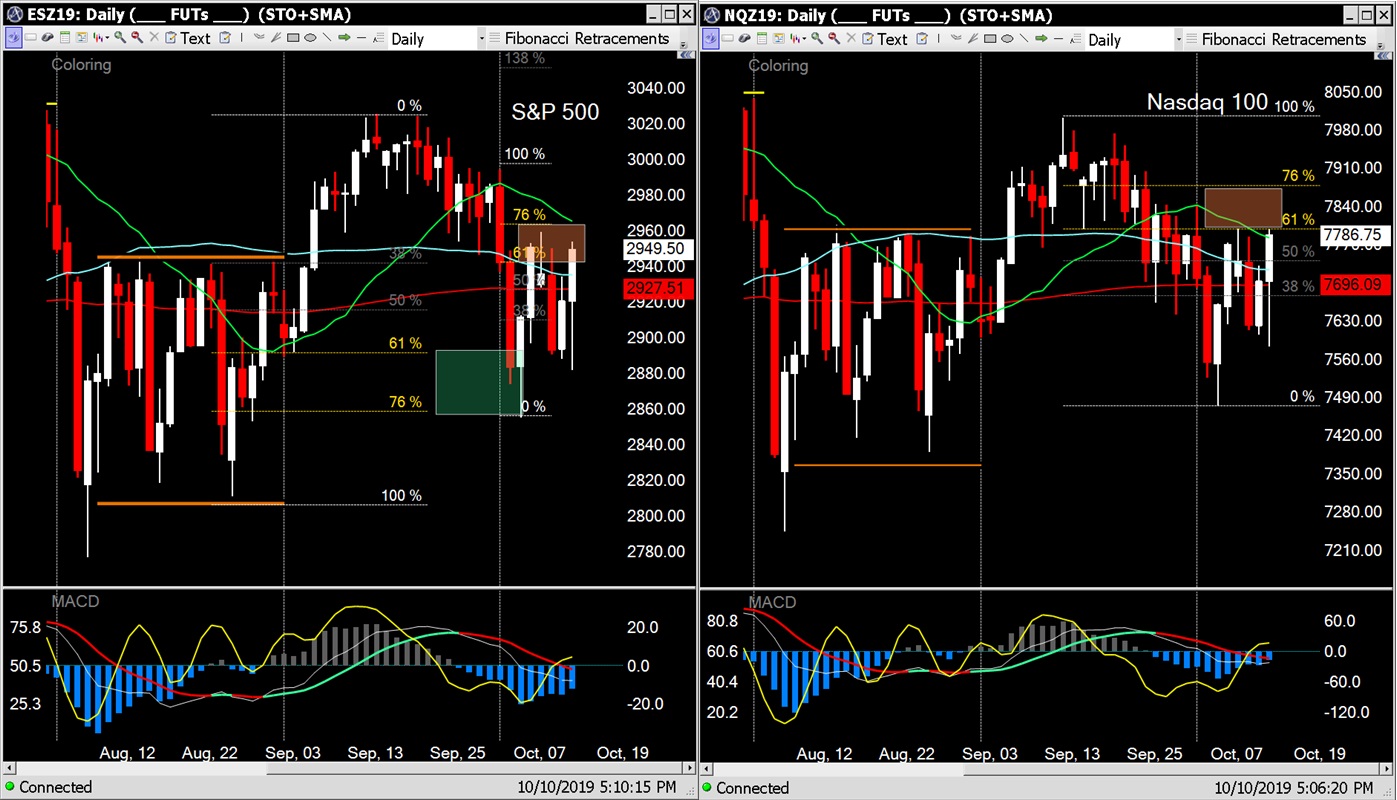
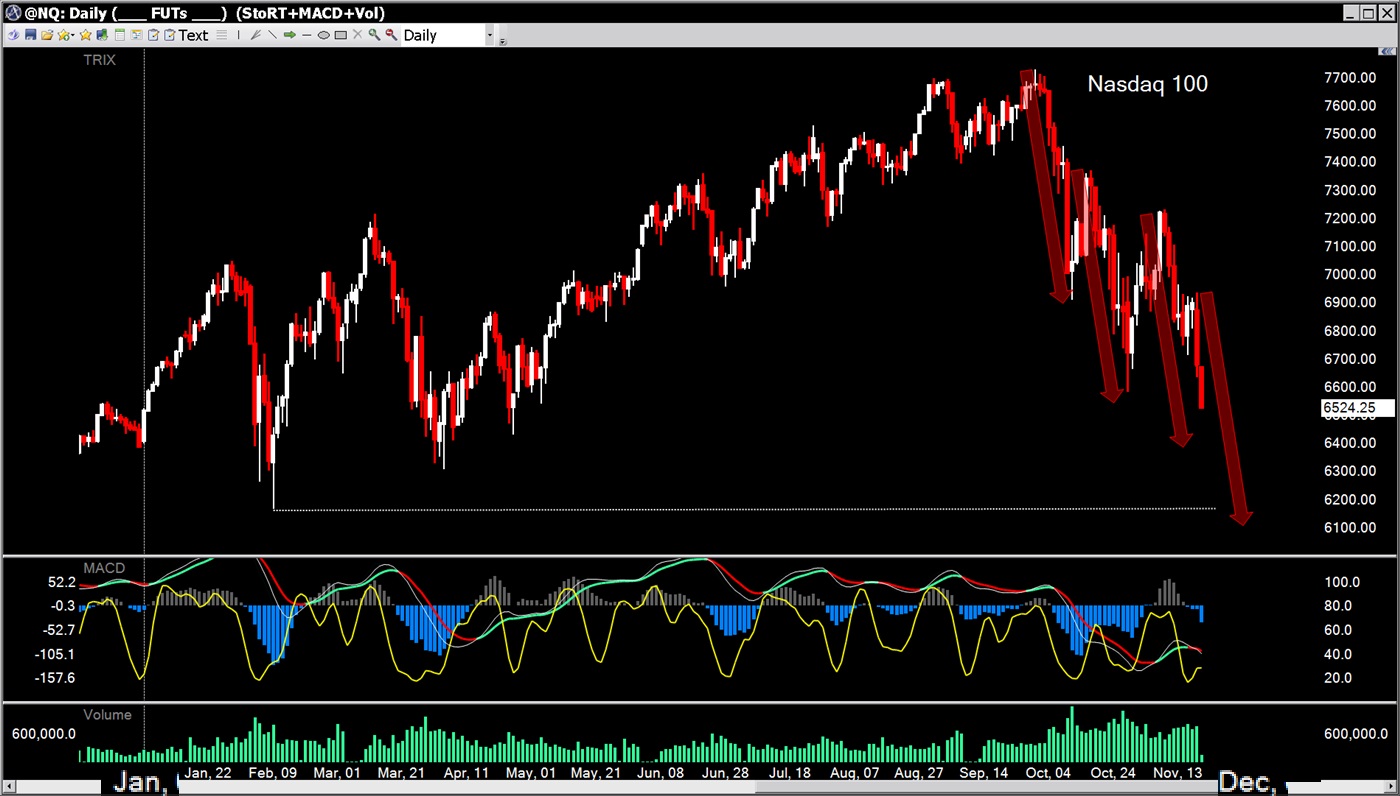
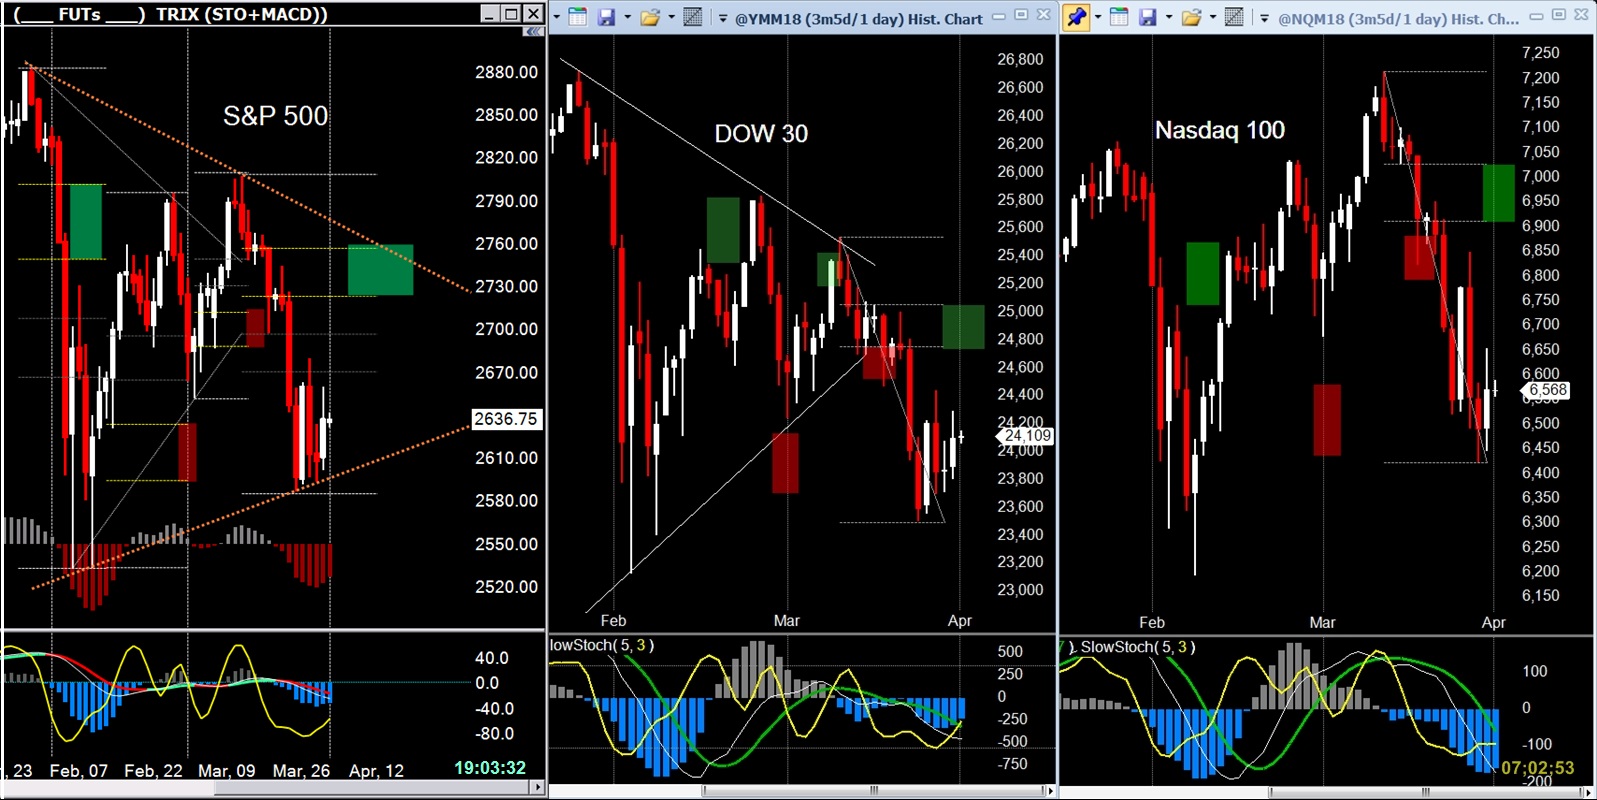
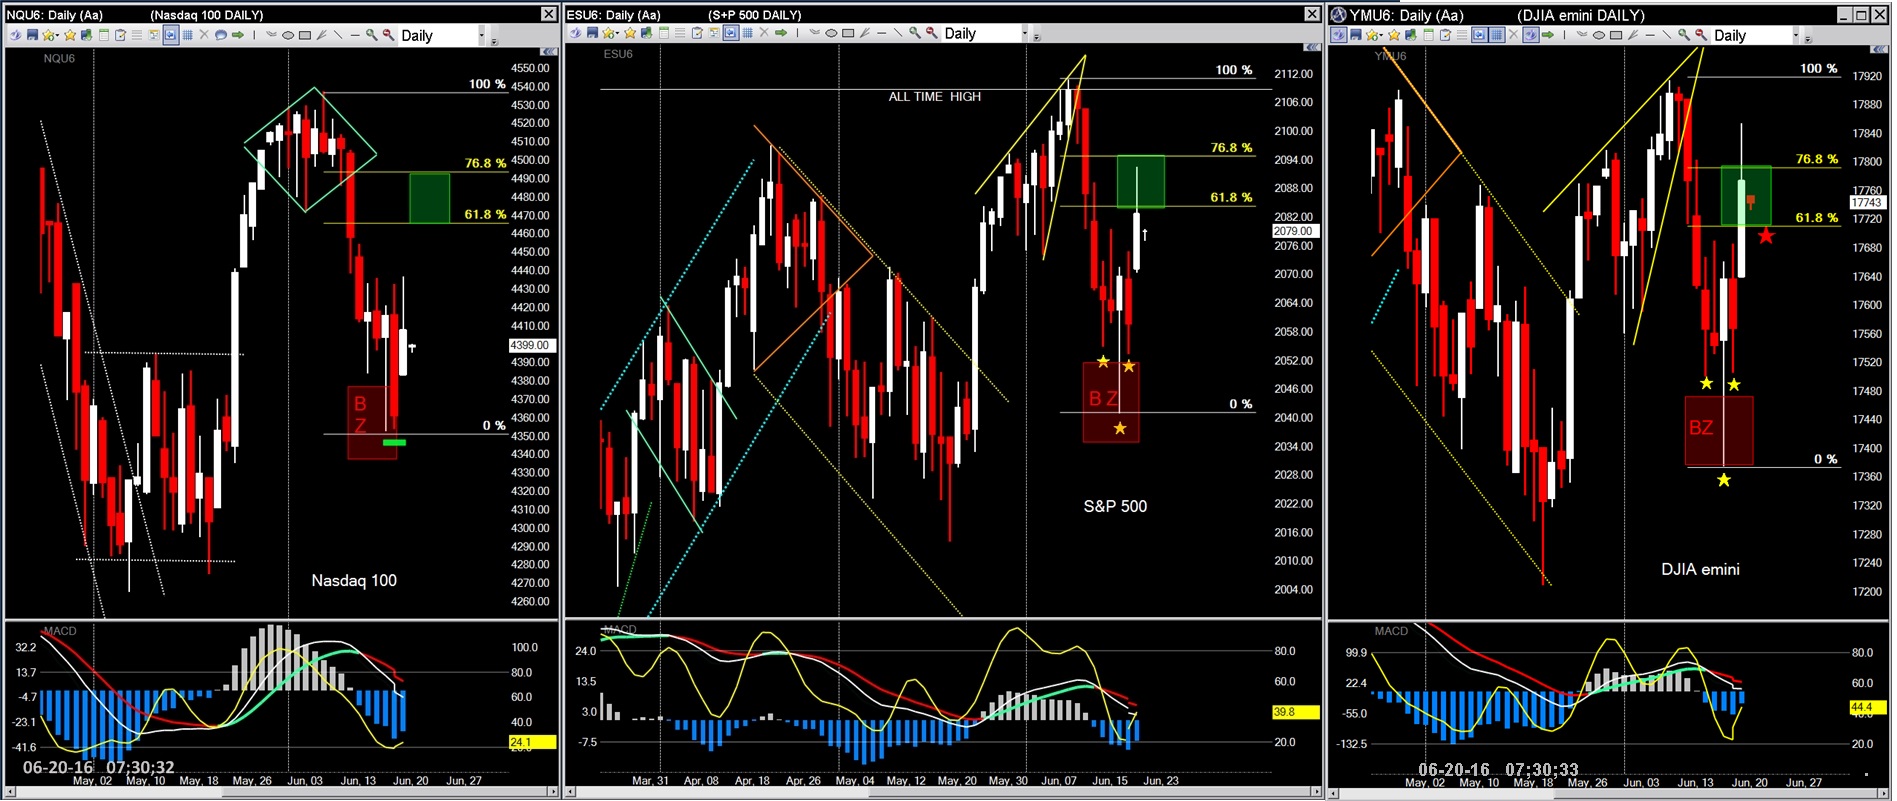
The majors are toying with the Brach Zones
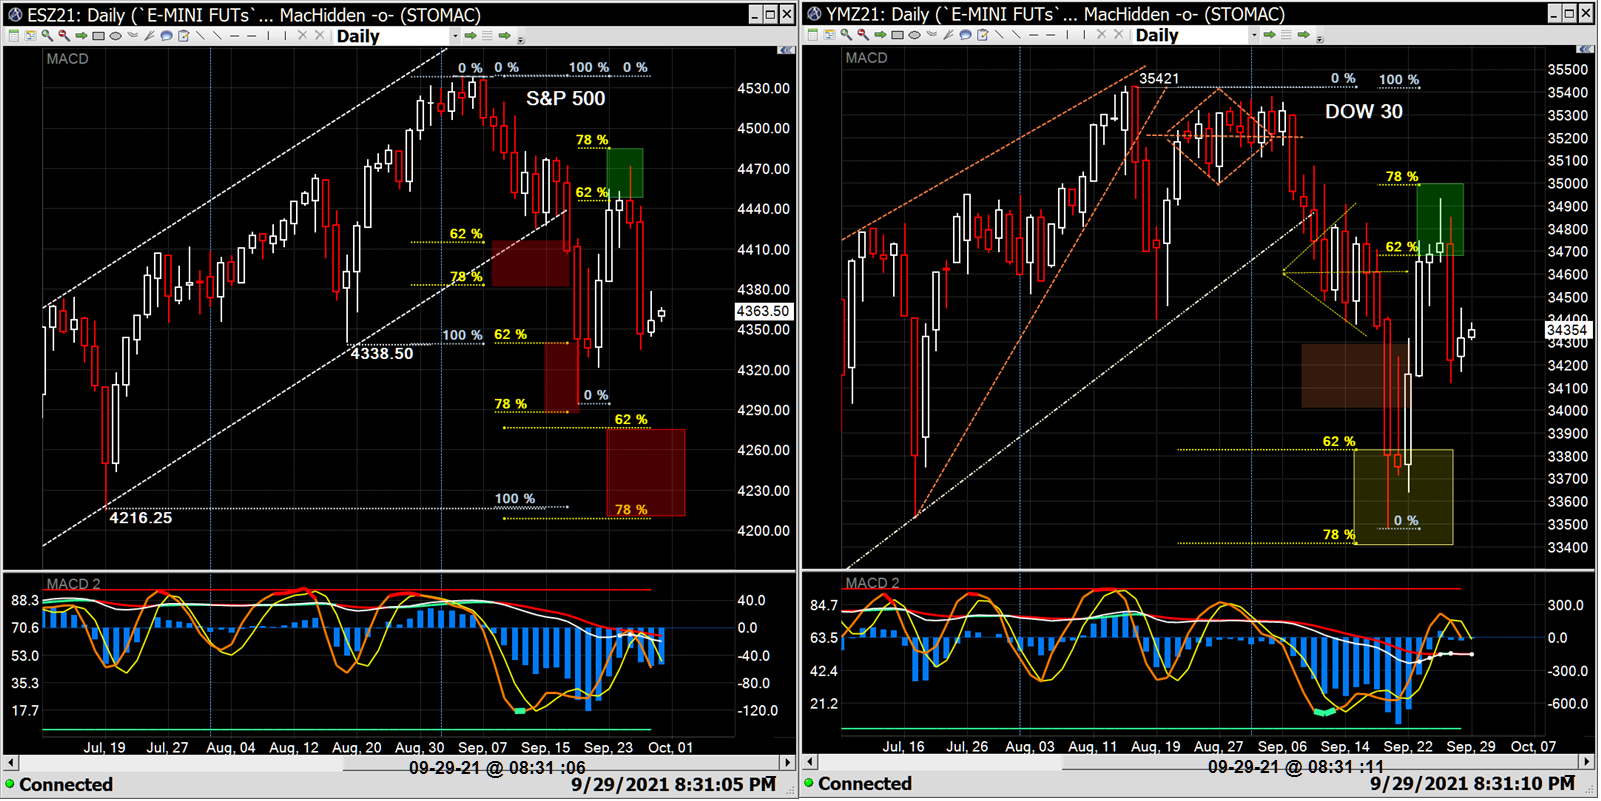
Possibilities drawn from the ATH to down blips

T/A continues to fascinate . . . . . .

Hard to believe I'm actually bearish...well not really...
(not really bearish or not really hard to believe?)
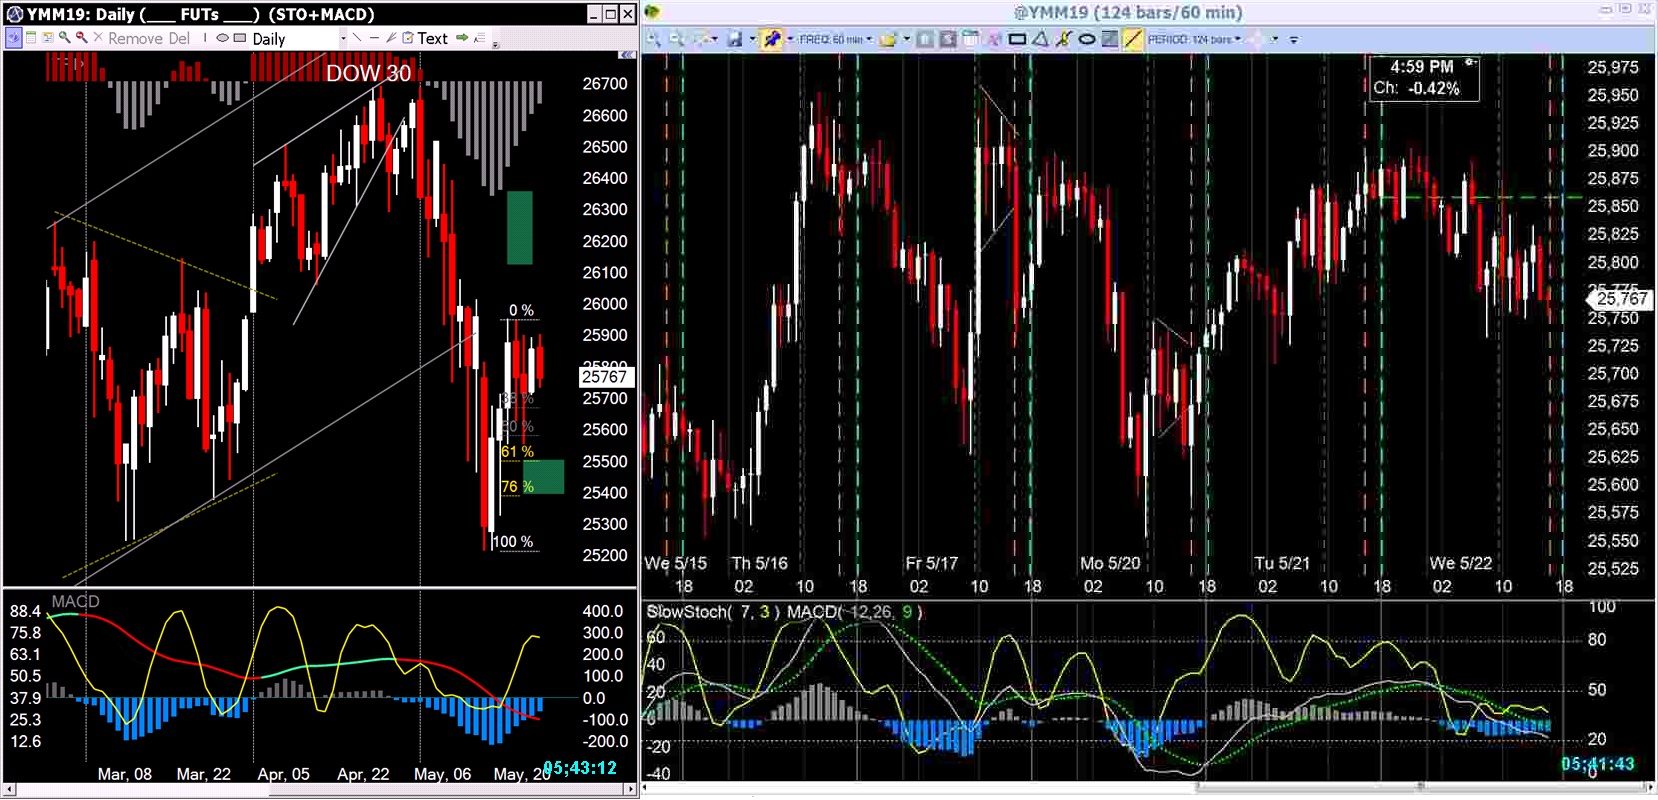
Brach Zone areas as targets and entries
Brach-Zone areas as target EXIT areas after bottoms
and/or as target ENTRY areas for pull backs in an uptrend

Don't know why I came here to nite -- Back in the BZ again
Majors seem to be stuck between BZ's...(consolidating?}
None of them have retraced May's drop as of yet.
Based on the negative stochastic hooks, doesn't look like they will at this point.
...or very long term ...

Can be used for very short-term price projections
Potential BZ retrace areas
Perhaps the retrace continues into the BZ ...
BZ Fibonacci price action retracing a drop

Continuing up ...another 10 points ...

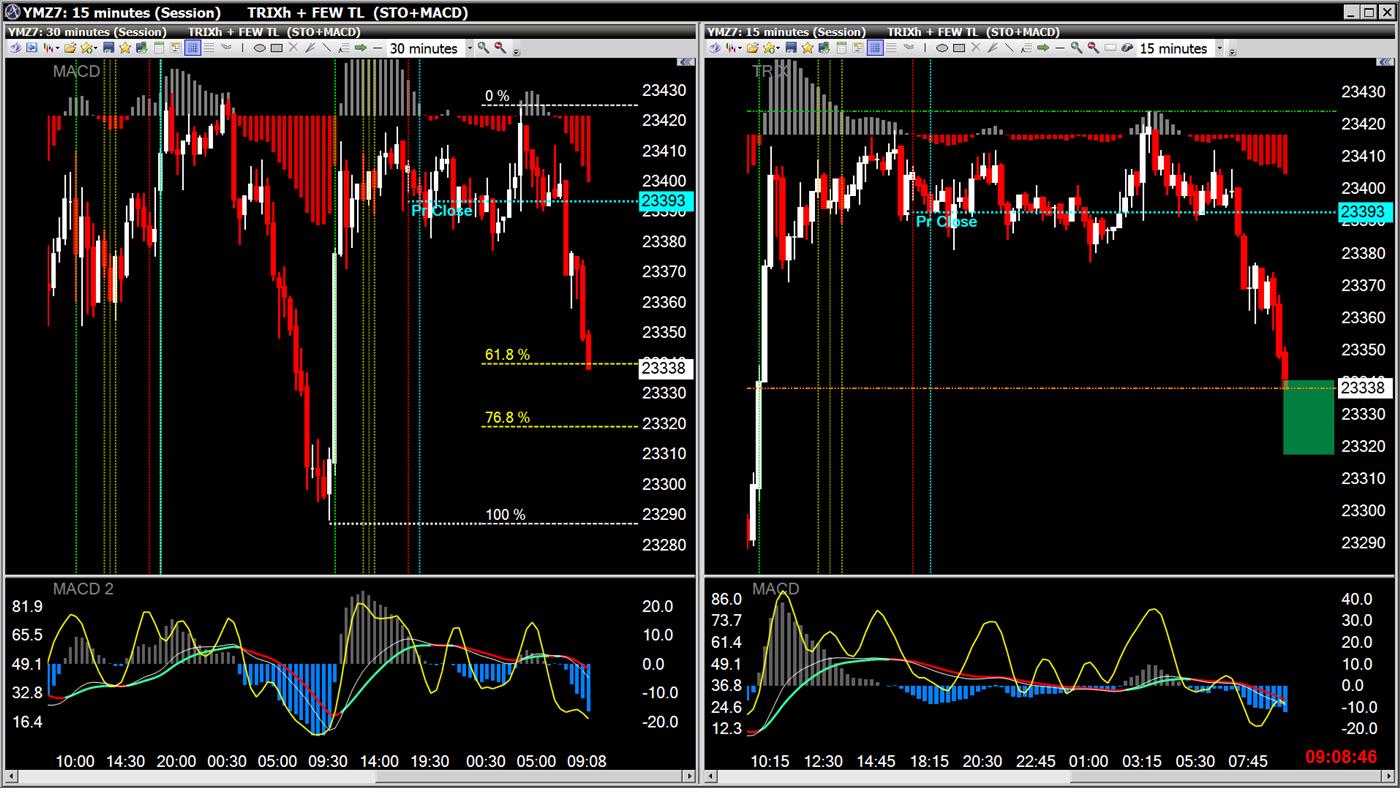
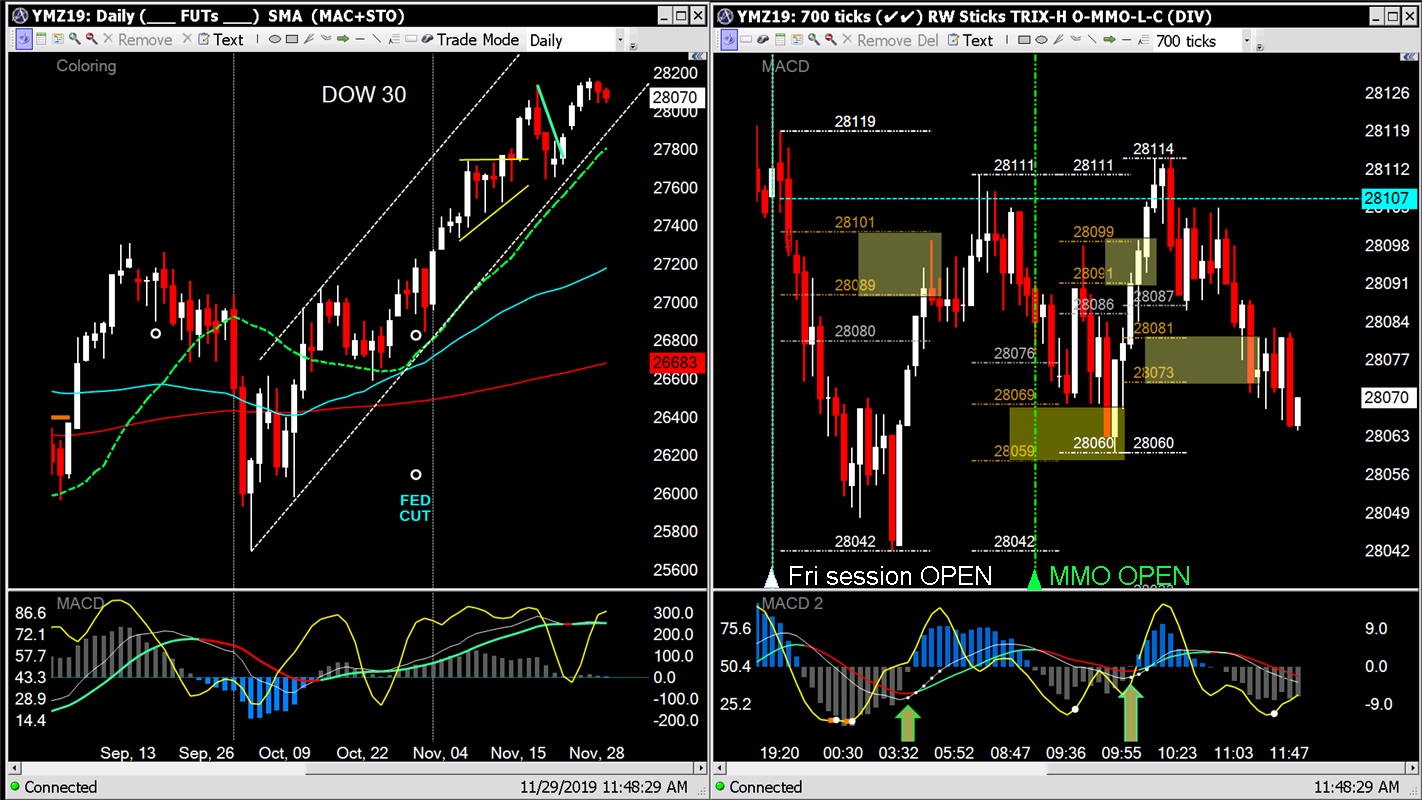
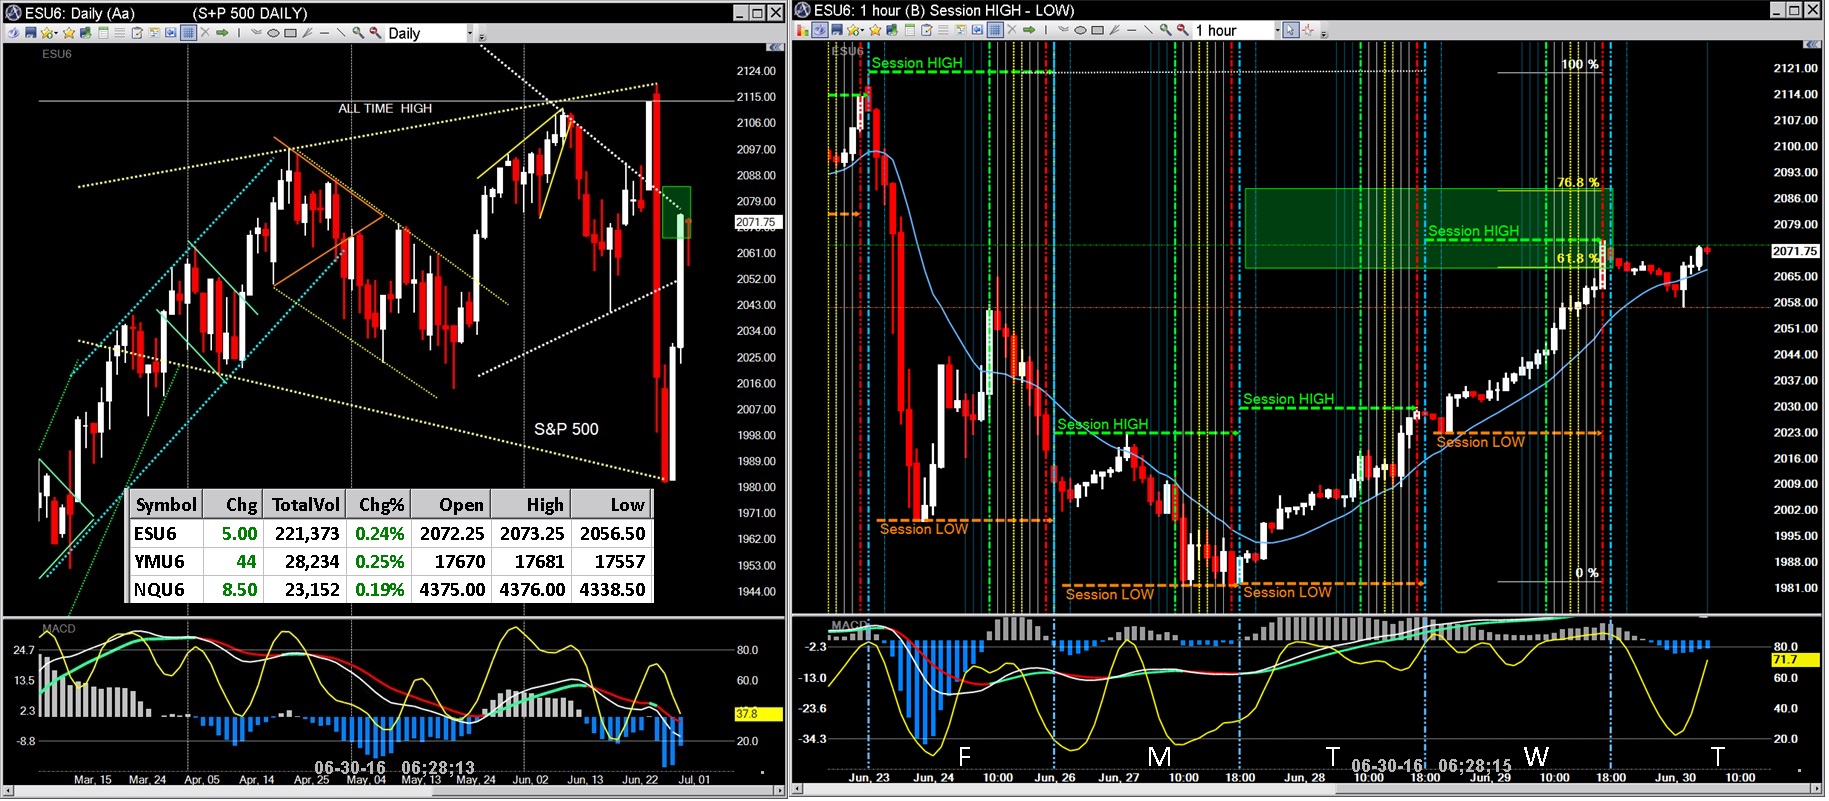
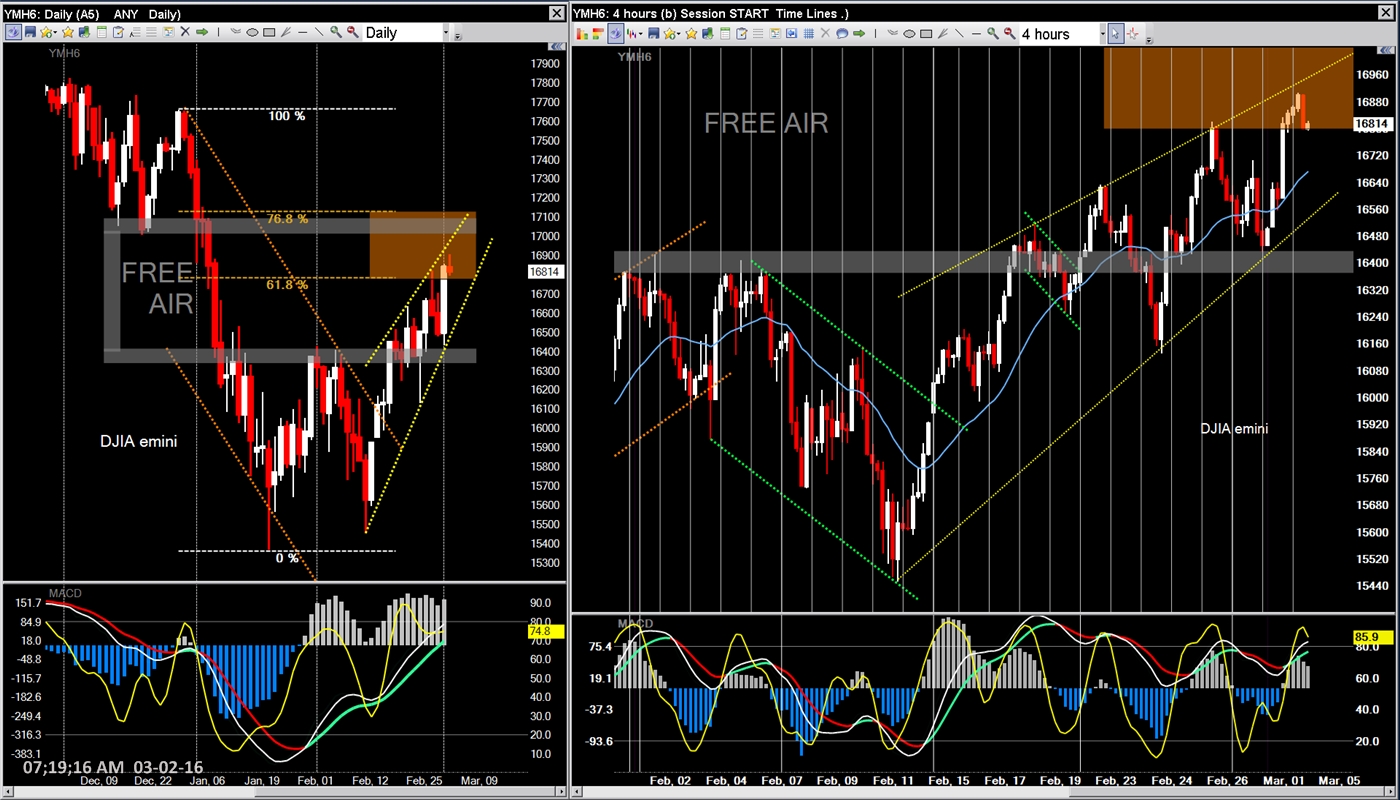
The DJIA e-mini futures market opened up strongly Sunday night.
Price retraced that up move to the Brach Zone.
Two price-to-indicator divergent reversals printed...(high-lighted by the dark blue vertical lines) 

I'm always looking for technical signals on my charts:
My personal bias is nearly always bullish.
Another 10 points later...

BZ retrace of June's High-Low...Brexit be damned...
The WAG results ... sorta correct ... ...
Price did retrace into the BZ of yesterday's hi-low range...

Yesterday:

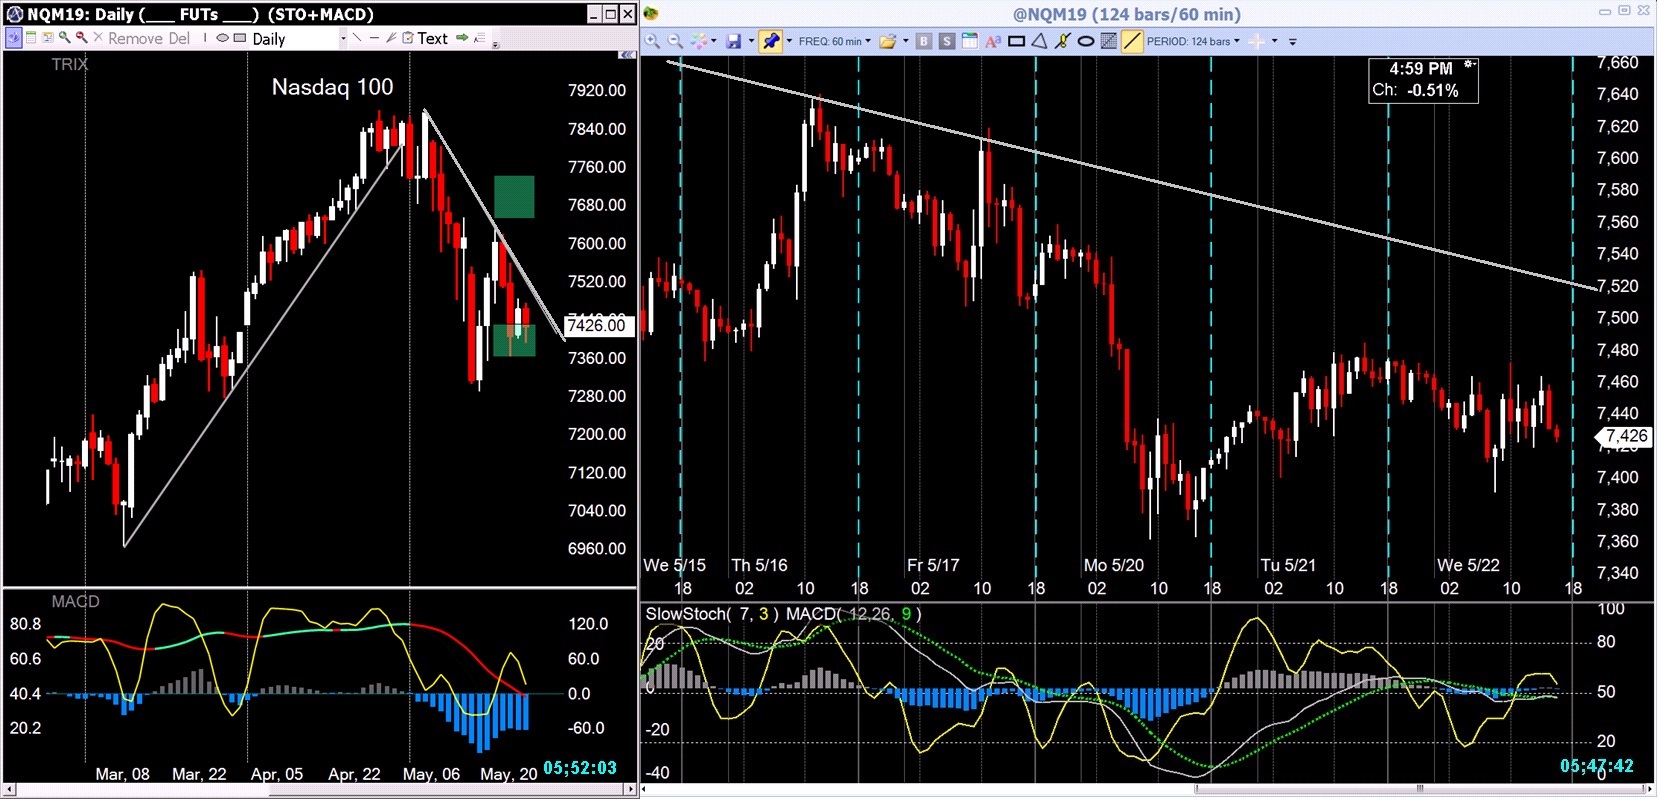
BZ at work to the up-side too ... the NQ is seriously lagging
A WAG for what might be next ... A BZ retrace of Monday's session to 17700, nice round number.

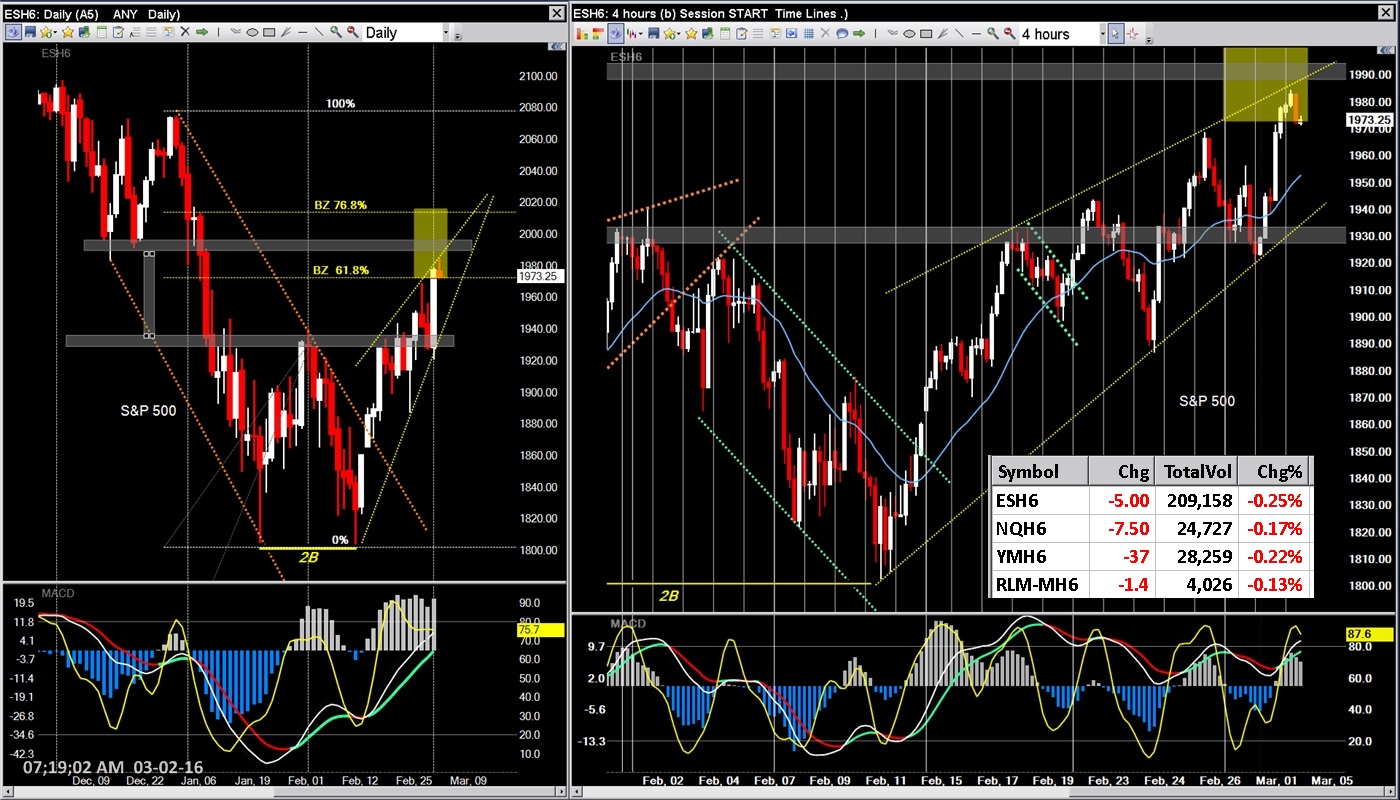
BZ Fibonacci at work...plus inverted H&S and 2B

Brach Zone Fibonacci coming into play on the FUTs...
wedges, channels, double bottoms and Alan Farly's "Free Air" (reduced resistance) adding to the T/A mix.
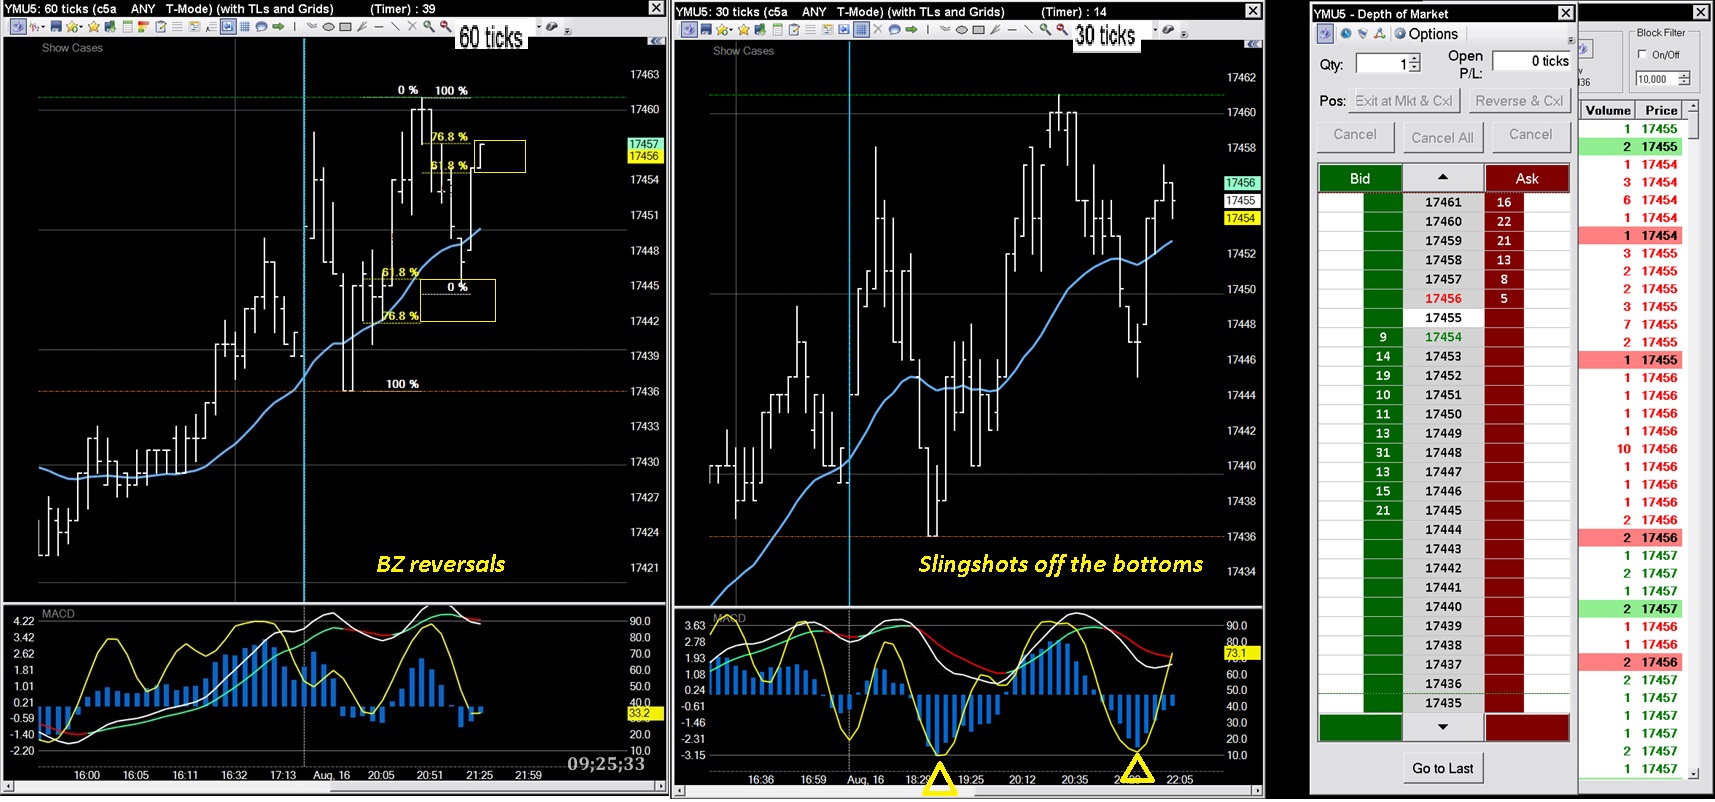
The 4 horsemen...slingshots into the BZ
Not always perfect - just a tool for perspective and for projecting possibilities
More on "Time Frames'...Time based vs Tick based
Long term chart:
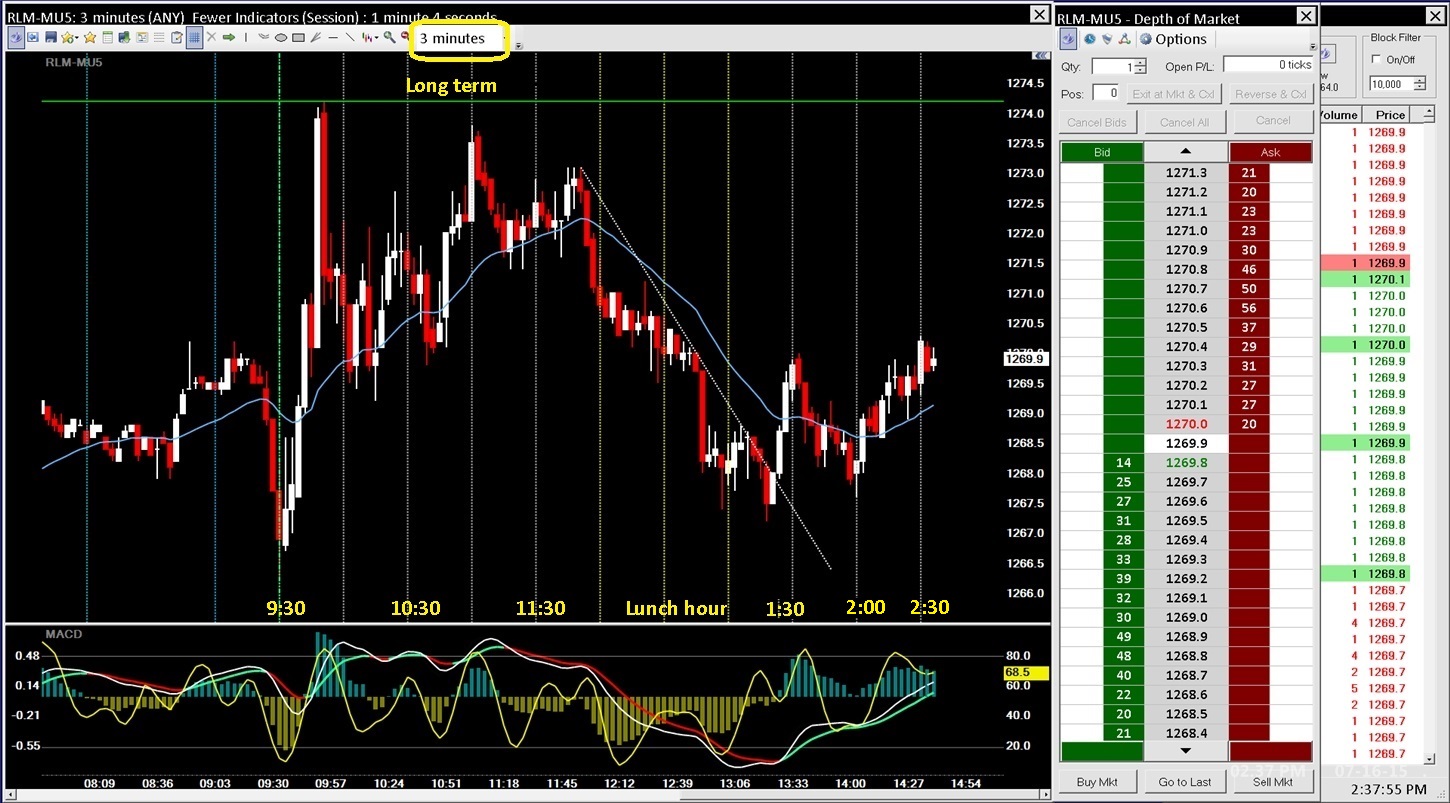
Short term trade charts:

Fibonacci numbers can be applied to anything...I personally haven't found FIB time lines
advantageous to my way of trading...same goes with Gann's stuff. I suppose some trader's may find them useful.
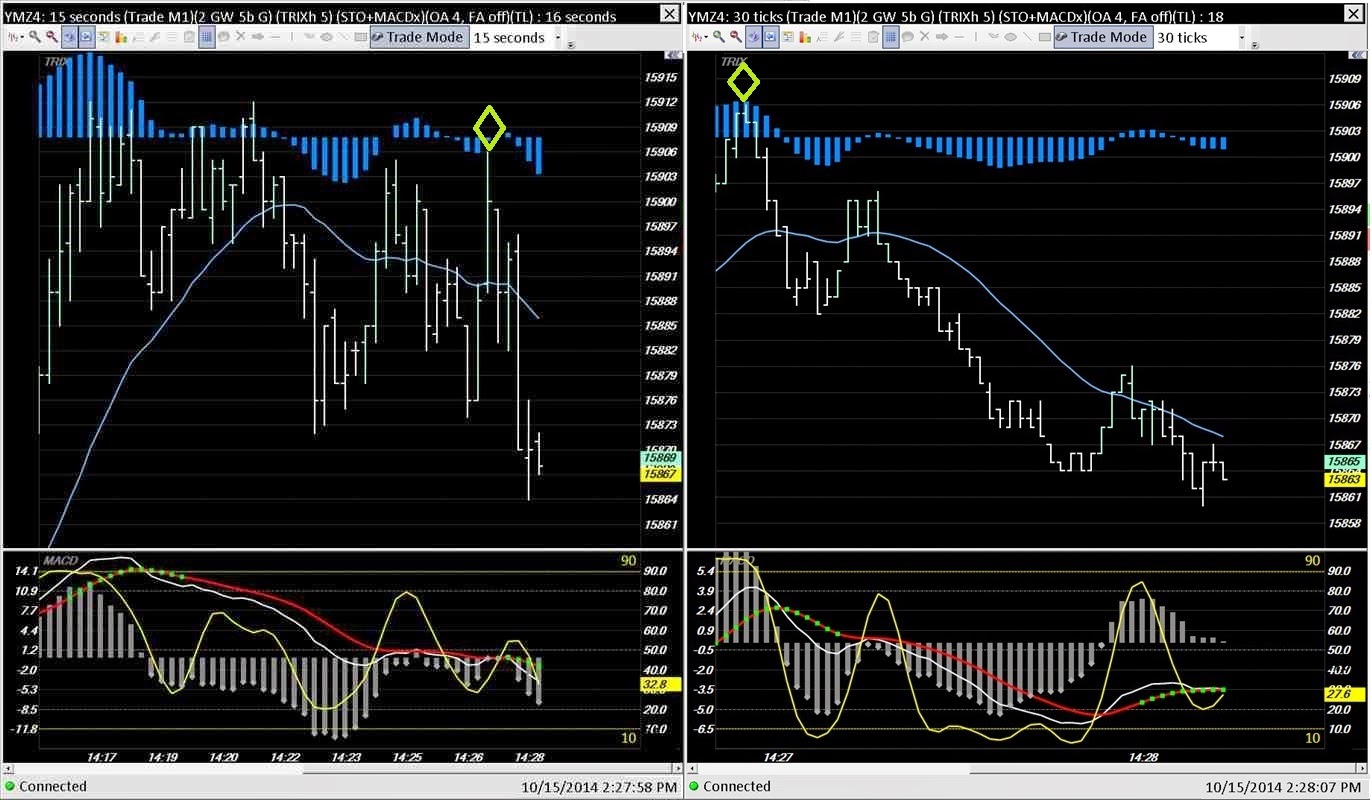
My shortest "time frame" would be approximately 15 minutes of bars on a chart...
I use Tick charts mainly - they minimise the affects of "time" in favor of activity levels...
That said, the smallest increment I use is 30 ticks...meaning it takes 30 trades
to complete one bar (for the YM, NQ and RUT e-minis)
The ES e-mini is very much more active - my smallest interval is 120 ticks per bar.
I describe the differences in Tick and Time based charts in depth about half way down the page on my blog:
Discretionary Trading ...TICK vs TIME charts (my blog page number 7) ...
Tick vs. Time:
Something interesting I came across.Perhaps in your experience you can help to share your accuracies and guesstimates.
Also what is the shortest time frame that you use?
Interpretation
The slow start in the Fibonacci sequence creates relatively tight clustering at the beginning of the Fibonacci Time Zones. Sometimes, it is necessary to ignore the first 5 or so time zones. After the first five zones, these zones expand quite quickly as the sequence unfolds. According to the theory, potential reversal points can be found by looking ahead 21, 34, 55, 89 and 144 days, all of which are Fibonacci numbers. 21 days marks the 8th Fibonacci Time Zone. Some subsequent zones are listed below. Remember, you can find future times zones by adding the previous two time zones (89 + 144 = 233).
? 8th zone = 21 days or periods
? 9th zone = 34 days or periods
? 10th zone = 55 days or periods
? 11th zone = 89 days or periods
? 12th zone = 144 days or periods
? 13th zone = 233 days or periods
Chart 1 - Fibonacci Time Zones
QQQQ Example
Chart 1 shows the Nasdaq 100 ETF (QQQQ) with the Fibonacci Time Zones extending from the March 2009 low, which was an important low. The first 7 time zones are difficult to use because of the tight clustering. The sequence gets some breathing room starting with the 8th time zone (21 days). The 9th time zone (34 days) coincided nicely with the July low. The 10th time zone (55 days) occurred in the middle of an uptrend and was not significant. The 11th time zone occurred near the February low.
Chart 2 - Fibonacci Time Zones
Chart 2 shows QQQQ with time added to see the next Fibonacci Time Zone. Under “chart attributes” users can add “extra bars” to view future Fibonacci Time Zones. The next Fibonacci Time Zone comes at the 155 day mark at the beginning of September 2010. QQQQ has been trending lower since late April and this zone could mark an important low.
Chart 3 - Fibonacci Time Zones
Euro Example
Chart 4 shows the Euro ETF (FXE) with the Fibonacci Time Zones extending from the April 2008 high, which marked a major high. The 8th Fibonacci Time Zone (21 days) marked a top in July, the 34 day line did not mark anything significant and the 55 day line marked a significant low. The March 2009 high formed just after the 89 day line and the November high was a month after the 144 day line. As with most forecasting and cycle tools, a little leeway is required, especially when the lengths grow longer.
Chart 4 - Fibonacci Time Zones
Chart 5 shows FXE with time added to see the next Fibonacci Time Zone at 233. Even though the Euro ETF bounced in June-July, another leg lower is still possible with the Fibonacci Time Zones forecasting a low in September 2010. 50 days were added to this chart to see the next Fibonacci Time Zone. After 233, the next line would be at day 377, which means the chart would need around 330 extra days for viewing.
Chart 5 - Fibonacci Time Zones
Conclusions
Fibonacci Time Zones are called “zones” for a reason. They are not hard reversal points, but rather potential reversal points to watch as prices approach this zone. Fibonacci Time Zones provide a cross between cycle analysis and Fibonacci analysis. Both have a wide following and turning points can be forecast weeks and months in advance. However, these forecast points serve as an alert for a potential trend reversal. As these reversal points approach, chartists should turn to other aspects of technical analysis to actually confirm the reversal. This could be a bullish or bearish pattern, bullish or bearish candlesticks, bullish or bearish indicators or clues from the price chart itself.
Hi...Haven't used FIB time lines much.
I do have time lines on my short term charts instead of grid lines. They are set up to show every 1/2 hour.
I use tick charts for trading - I adjust the ticks-per-bar so that 30 to 60 minutes of price bars show on the charts.
The time lines will be closer or further apart from each other depending on how active the market is at any particular time of day.
(on time based charts the time lines are equally spaced)
Hello there.Question
Have you ever tried the Fib time projections?
I'm still seeing if that has more too it than another toy to put up on the screen.
Happy 4th of July ... celebrating independence day
BRACH ZONE reversal fireworks

BZ reversal in the evening...
Short term predictions are easier
Same LT target one month later ...
Breaking the 5-wave wedge puts the BZ into play.

Looking like a rounded top too.

That's all I've got to say about that...(Forrest Gump)

The ides of March are upon us.
Rounded tops, MACD EMA cross and stochastic direction suggests more to come.
My targets are the 38% to 50% Fibonacci areas at the lower wedge lines, then perhaps
on to the full BZ retrace levels (61.8% to 78.6%).


|
Followers
|
2
|
Posters
|
|
|
Posts (Today)
|
0
|
Posts (Total)
|
72
|
|
Created
|
12/01/12
|
Type
|
Free
|
| Moderator sharpshorts | |||
| Assistants | |||

|
|
| Volume | |
| Day Range: | |
| Bid Price | |
| Ask Price | |
| Last Trade Time: |