 News
News  Market Data
  Discover
Support: 888-992-3836
Copyright © 2023 InvestorsHub Inc.


ls7550
![]()
Register for free to join our community of investors and share your ideas. You will also get access to streaming quotes, interactive charts, trades, portfolio, live options flow and more tools.
Register for free to join our community of investors and share your ideas. You will also get access to streaming quotes, interactive charts, trades, portfolio, live options flow and more tools.
Hi Toofuzzy
Sometimes you don't have to reinvent the wheel
Hi Nick
Hedging the currency element reduces stock +/ currency combined gain/loss to just stock only gain/loss. With the unhedged sometimes the two will see movement in the same direction - enhancing gains or magnifying losses, or the two move counter direction, diluting down gain/loss. Some opine that currencies are a zero sum game and that as they just scale up volatility in some cases its better (on a Sharpe type volatility = risk basis) that hedging is better than not, especially with bonds where they'd rather see reduced/low volatility - on the basis that they're pairing high (stocks) and low (bonds) volatility assets and would prefer the low volatility side be kept down at low volatility (shift currency factor over to the high volatility side of the balance).
When assessing 'how much gold?' the method I used was to look at the zigzags in a Pound/Dollar chart, looking for the largest zag (down) leg and noted 1979 to 1984 had the Pound drop from around 2.5 down to 1.0, and also noted that Gold in Pounds rose by a 2.5 multi-year factor over a similar time period.

Which for one to cancel the other (neutral) involved a 28.5% gold allocation being appropriate. Broadly if you start with a third gold (global currency), two thirds Pounds, and Pounds halve, gold doubles you end up with two thirds gold, one third Pounds values, and can if desired rebalance Pound/global currency (gold) back to target weightings without having endured any loss due to currency movement ... type thinking. From that 25% to 33% gold or foreign currencies seemed a reasonable choice of gold weighting.
Foreign currencies can be as good as gold at times. Iceland post 2009 financial crisis for instance saw Icelandic Krona dive, gold prices rose sharply, but in Euro's the price of gold remained level. A Icelandic investor would have been just as well off holding either gold or Euros. But gold is also a commodity, so it has its own motions layered on top. It's also a form of currency unhedged undated zero coupon inflation bond, so like a very long dated TIP - will tend to see its price spike when real yields spike negatively (if inflation is 10% and bonds are paying 5% then investors are losing -5%, so would rather hold gold that might more broadly offset inflation).
Other assets are multifaceted. For instance firms borrow money - issue Corporate Bonds, such that stocks are a form of leveraged holding, where broadly around half of stock book value compares to Corporate bonds in issue value, such that stocks are broadly a 1.5x leveraged type holding. Leverage broadly tends to yield no additional reward, just scales up volatility. So many investors opt to de-leverage 1.5x naturally leveraged stocks, which 67/33 stock/bonds tends to do. A problem there is that bonds are broadly zero sum, sometimes lenders win, other times borrowers win, neutral overall - which makes being both a borrower (holding stocks that incorporate elements of short bonds (issuing Corporate Bonds)) and a lender (buying Bonds directly) non efficient use of capital. Opening both a long and short Bond positions is wasteful. If being short bonds is broadly comparable to being long bonds and stocks include elements of being short bonds, then stock along provides stock and bond exposure factors (albeit being short bonds (net borrower)). If foreign stock also include currency effects - similar to gold then stocks can be combined stock + bond + currency factors. Some investors are content with that diversity and hold 100% stock, yet others dislike the volatility that can involve and may de-leverage by scaling down the natural bond or currency (gold) factors inherent within stocks by holding some bonds and/or gold directly themselves.
The way I look at it is given domestic Pound currency, US primary reserve Dollar currency, and global currency (gold) - equal weighting each is my more preferred choice. Similar for stocks/sectors, given a range I'd go with equal amounts in each. Price appreciation gains tend to arise along the lines of given 10 assets, one rises 10% another falls 5% and the rest don't move type motions. On the basis that the best one cannot be predicted in advance the best choice is to bet the same amount in each (equal weight). If you sell down the one that gained +10 to add 5 to the one that declined -5, then they're all back to equal weighted again and you get to keep (withdraw/spend) the surplus 5. I don't know if the next 12 months will have gold or stocks or Dollar or whatever being that 'winner', but do know that more often one will be that years winner and I'll just take what's given. Reward for having partaken in the 'game'.
For a smooth neutral ride something like domestic bonds (Pounds), US dollar stocks (primary reserve currency) and gold (global currency) has equal weighted currency diversification, stock/bond/commodity asset diversification in equal measures. But at the cost of having lowered the overall reward expectancy. For a US investor whose domestic currency is also the $ then that's both US stocks and bonds, combined with gold. Take a conservative/safe withdrawal rate from that, 2% in this example, and the portfolio value remained relatively smooth over time https://tinyurl.com/yapm3ocw both in nominal and inflation adjusted terms. Click the 'Assets' tab and it reveals how in some years it was stocks that were the bread-winner, in other years gold

Much is judgemental, for instance I hold BRK and counted that as a financial heavy stock/sector. With its more recent Apple purchases however its become more of a combined Financials/Tech combined holding for me and as such I've added more and scaled down on my tech stock/sector holding (Vodaphone). Before, both were around equal weighted, now BRK is 3 times my VOD holding size. Whilst my other stock/sector holdings remain around the same weighting (BP for oil sector exposure ...etc.). Something like this https://tinyurl.com/y7e6u7ck but where in that case MSFT would have been reduced, BRK expanded in view of BRK becoming a big owner of APPL
Regards.
Clive.
Hi Jack
from 2005-1 to 2006-4 there are 16 months of 4% withdrawal from Cash of 33334 right?
cash reinjection? i dont get it. what happen in 2008-11 and 2011-9? what is the exact calculation?
Hi Adam
My thinking about the AIM buying and selling has been influenced by Don Carlson's ladder method, where he would buy a number of shares and when the stock went up he would sell the same number of shares, so in dollar value the sales were bigger than buys.
Rolling that UK chart back a bit further - from 1825

Clive
Ahhh!
Fouled up that AIM table, forgot to update PC in some earlier cases. Corrected version (below) produced much the same overall outcome however, except that cash was totally exhausted (around $1000 too insufficient to cover AIM's full buy advice) at the lows.

Thanks Jack.
A bit more of how 70's like the 2000's have been here https://investorshub.advfn.com/boards/replies.aspx?msg=156059691
Clive
Hi Tom.
Ah! Ye-old Lotus-123 charts in that link bring back memories :)
In another post https://investorshub.advfn.com/boards/read_msg.aspx?message_id=155969449 I indicated how since 2000 has been somewhat similar to the 1970's, the era that drove Lichello to devise the original classic 50/50 AIM.
Looking at how a all stock investor who started in 2000, applying a 4% SWR out of total returns ... and in inflation adjusted terms had they persisted with that to present/recent then ...
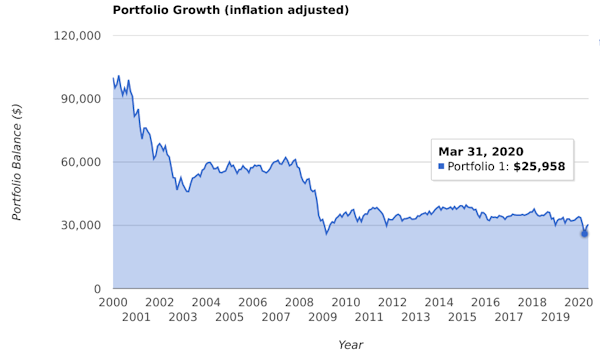
they'd be sitting on inflation adjusted portfolio value of around 25% of the Jan 2000 start date $100,000 amount. Ouch!
Standard AIM, 50% initial cash, 10% SAFE and Min Trade Size would have seen % cash dip near to perfect timing of the 2009 declines, and have subsequently rebounded back up to 50% % cash levels, averaging 33% cash overall since 2000.
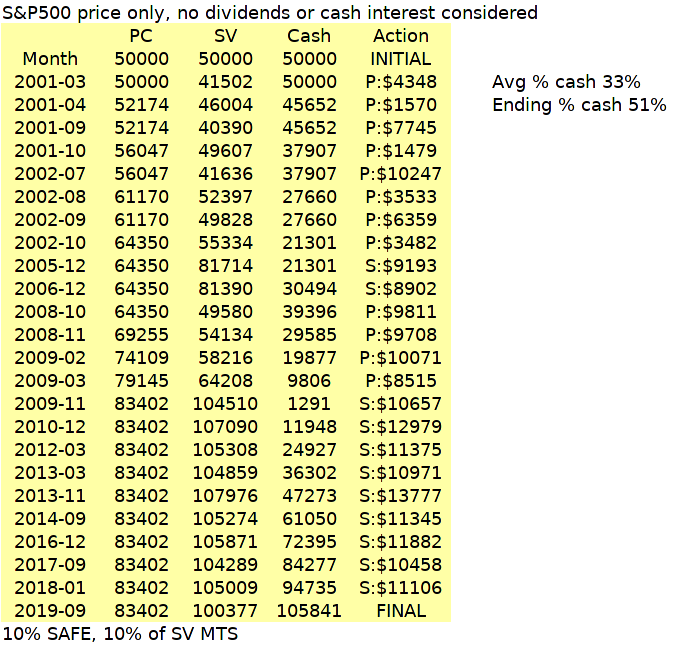
AIM of just stock price (S&P500), no dividends nor cash interest included, would be up in inflation adjusted terms by 35%, but did see dips down to be lagging inflation at times.
Depending on where/how you had cash invested then along with dividends the combined dividends + cash interest from stock + cash holdings might have paid out a average 3.7%/year 'salary' (income) according to my approximation/cash for preferred choice of 'cash' holdings over that period. So pretty much broadly offset inflation + providing a 4% inflation adjusted income type outcome from standard AIM since 2000.
Pretty much adds further to that post suggesting since 2000 being like the 1970's over again observation.
Unlike the 1970's where events/circumstances had high interest rates (low prices) after investors took large hits, we are seeing the complete opposite of very low interest rates/high prices. So whilst investors whose portfolios did get through the 1970's bad times were relatively quickly compensated subsequently (the great 1980's/90's Bull run), we're perhaps unlikely to see such compensation any time soon.
Regards. Clive.
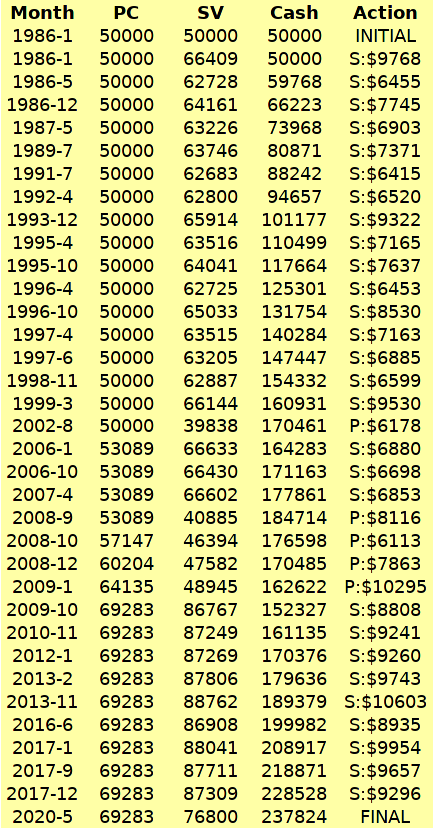
Looking at that Dow price only (no dividends, no cash interest considered) AIM up to the first AIM buy trade that occurred at the end of August 2002 and the AIM had averaged 65% cash up to that point, whilst its value had more than offset inflation relative to the Jan 1985 start date value. So all of dividends/cash interest might have been spent as your 'income'. So average income over those years would have been around (0.65 x cash interest) + (0.35 x dividend yield) type combined value. Guessing (rather than looking up) cash interest and dividend yields over those years, if 5% cash interest, 2% dividend yield = 4%/year (inflation adjusted) - as a guide. IIRC interest rates and dividend yields were actually higher than that over those years.
At that AIM buy trade point the AIM was holding nearly 82% cash and AIM would have that being reduced down to around 76%. We might however have opted to 'reset' AIM at that point, back to 50/50 stock/cash (start again, or simply inject that additional cash from the 'cash' side of the AIM into the AIM's 'stock-value' and increase PC by the amount of additional stock value added). Around 25% of total AIM value (combined stock + cash) being injected into stock - at a point when AIM was signalling to buy stock, and that subsequently turned out to be a relatively low share (Dow) price level. Around that time the Dow was down at 8000 levels, and a little over a year later it was back up at 10,500 type levels, so up around 30%. Whilst in the lead up to that 'dip' AIM was relatively cash heavy, so was less impacted by the dip.
Thereafter, rinse and repeat. Haven't checked but likely a somewhat similar situation might have again been apparent at the 2009 lows/dip.
AIM tending to accumulate cash often comes with relatively little downside (marginally lower annualised rewards than say 50/50 stock/bonds yearly rebalanced compared to a AIM started with 50% cash, but saw % cash expand over time); But where that cash accumulation can later be deployed to very good effect (AIM reset/restarted at share price lows) - and that overall more than offsets the marginally lower rewards in earlier years.
Warren Buffett is somewhat a AIM'er. He's recently up at around 30% cash and many have complained that given the recent Covid dips that he didn't deploy more of the $140 billion/whatever cash he has sitting on the sidelines. Neither did AIM of that Dow. Perhaps he and AIM know/suspect something most don't? Or perhaps Buffett is a actual closet AIM'er :) That Dow AIM is sitting on 75% cash, and most likely both he and AIM will find opportunities to reduce cash at some point, often at/around the same time. Whilst in the interim, the rewards/income are OK, and in having above average in cash the events (declines) leading up to the next big buy will see those declines hit AIM less hard than most.
Many look at AIM, run a few backtests and don't see anything outstanding - so they lose interest, as often a 50% initial cash AIM does just reflect, as a example, 50/50 constant weighted (yearly rebalanced) type rewards. AIM's tendency to accumulate cash over time is where its primary benefit arises. It doesn't advise when to reduce down excessive levels of cash, that has to be your own decision, but it does flag opportunities to consider doing so i.e. when standard AIM is buying. The intervals between such bargain price levels and having accumulated excessive cash however can be years apart, so patience is required. Not a virtue that many have nowadays in this 'I want it now' era/age.
Some might take income using dividends/interest, leaving conventional AIM (50/50 stock price only, cash without interest) to offset inflation.
Hi Jack. Yes, as AIM1979 said/linked.
Basically a means to have a steady/consistent inflation adjusted income. $100,000 portfolio with a 4% SWR applied has you take £4000 at the start as income, and then uplift that amount by inflation and drawn that inflation adjusted amount as the income in the second/subsequent years. Or $333/month inflation adjusted taken monthly.
Some might take income using dividends/interest, leaving conventional AIM (50/50 stock price only, cash without interest) to offset inflation. But then income is variable. Others might consider dividends/interest to be the inflation offset element, and spend price appreciation (AIM gains) as the 'income'.
Fundamentally gains can arise out of price appreciation, income (dividends/interest) and volatility capture (trading/rebalancing). Broadly they're all the same, price appreciation = diviends = interest = volatility capture = inflation (in a very broad/general sense). Some investors specifically target one over others, growth investors look to price appreciation, income investors look to dividend investors, Options traders look to capture volatility. AIM in effect diversifies across all of them. For income, SWR provides the most consistent, and its drawn out of total returns. Primary however is to keep SWR low, its generally better to set SWR to basic living expenses cover level and supplement that with income drawn in a discretionary manner on top of that. 2% SWR + look to draw a additional 2% out of real gains in a more sporadic/inconsistent manner is better than 4% SWR alone.
Clive.
AIM Cash Accumulation is a feature not a bug.
I use the risk indicators to determine the appropriate maximum level of cash held in reserve. When max'd out I then use a combination of selling and vealies to contain the cash at that max level. If risk goes up, I follow AIM's selling guides to let the cash level rise. If risk goes down, I use more vealies to hold cash steady in dollars but let the percentage fall off to the new lower risk level.

For that Nov 2008 manual reinjection of cash, that was a month when no trade were being indicated by AIM, but where % cash had risen to north of 50%, considerably up from 33% desired average % cash. Fundamentally cash % spiked due to stock value declines, but not deeply down enough for AIM to indicate a buy action.
Others use the Vealie, where if a sell trade is being indicated by AIM and you consider % cash to be too high already you update things to increase PC without actually selling any shares (that would otherwise increase % cash holdings). Personally IMO that's a bit like selling at a relatively high price, as determined by AIM, and immediately buying the shares back again (at that relatively high price). I believe that my way of not using Vealies, but instead re-injecting at other times when AIM is otherwise quiet, is less prone to having in effect over-paid for the shares/stock.
Alternatively you could re-inject cash when AIM was signalling a buy trade, and scale up the amount of stock value AIM was indicating be purchased. But it may be a long time before AIM does indicate a buy trade, or as per my example AIM - no buy trades being indicated by AIM at all.
Looking at the charts for that AIM, it was clearly that November 2008 re-injection of cash that helped the AIM to relatively outperform overall, to produce a higher reward than had Vealies been used instead (or if cash were simply permitted to rise to relatively high levels).
Clive.
Lichello's revised format for record keeping
Alternatively, rather than keeping monthly records for each and every month, you can just keep the records for only when actual trades occurred. This is a example for a AIM portfolio comprised of 50/50 stock/gold as the 'Stock' (SHY used for 'Cash').

Clive.
[OT] Disco Dave thinks it's the 1970's over again.
Using data from PortfolioVisualizer and there's a element of resemblance between the 1970's and what we've seen since 2000


Both of those charts are after a 4% SWR i.e. 4% of the initial portfolio value drawn at the start as income, and where that income is uplifted by inflation as the amount drawn at the start of subsequent years (so a consistent/regular inflation adjusted income)
For all stock (red lines), after 4% SWR (out of total returns) and in both cases the portfolio value is down considerably in real (after inflation) terms. Gold in contrast has fared much better. 50/50 yearly rebalanced stock/gold has broadly seen portfolio value maintained in inflation adjusted terms after provision of the 4% SWR, whilst also tending to reduce the number of ounces of gold being held, to top up on the number of stock shares being held.
Over other periods it flips totally around, where stocks floated the portfolio (provided the SWR) along with sufficient surplus to top up on gold (reduced number of stock shares held to add more ounces of gold). Such as across the 1980's/1990's.
However 50/50 stock/gold during the 1980's/1990's saw gold being too much of a dead weight.

67/33 stock/gold along with a 4% SWR was much better.

Whilst 67/33 still worked OK during the 1970's

and since 2000

.. my take is that : 67/33 stock/gold is a better overall average choice compared to 50/50 stock/gold across combined periods of economic/monetary expansion and contraction. At least that was the case since the 1970's.
Unsurprisingly given that observation, that stocks tend to be the better asset in around two thirds of years, gold being best in around a third of years.
The above is all US based data. As a UK investor taking that back further with multiple caveats ... I'm seeing 2% SWR 50 year periods since 1896 having a minimum of 3.2% annualised real being apparent on top of that in the worst case. i.e. that ended 50 years with the same inflation adjusted amount as at the start, after 2% SWR withdrawals and a further 3.2% annualised real gain that might have also been top-sliced to supplement the 2% SWR income. Average case yielded a 7% income (2% SWR + 5% real CAGR), and where the final inflation adjusted value was the same as at the start date.
Caveats : UK based data (Pound, UK inflation etc.). Where holding a third each UK stock, US stock, Gold - but where 'Gold' was actually T-Bills up to 1931 (when the Pound was on a gold standard, convertible to gold at a fixed rate, then it was sensible to hold money that was deposited/lent in return for interest). Also, 1932 to 1971 held silver instead of gold, as the US still pegged the $ to gold, whilst silvers price was free-floating. Gold since 1972 in mind of it being free-floating since then. Yet another caveat is that during World War years (Great War and WW2) I assumed a investor, mindful of uncertainties of outcome, might have rotated entirely into physical silver holdings. One final caveat is that I assumed that in the worst case (and hence all cases) that instead of lumping all in at a single time point, a investor might instead have averaged in over two years, three timepoints, i.e. avoided having lumped all in at the worst possible time.


For US investors, I suspect just 67/33 US stock/gold would suffice given that the US$ is the primary reserve currency. This link reflects after 4% SWR and shows US data since 1972. 2020 chart data is obviously year to date (monthly granularity) ie to end of May (+0.87%)
Clive.
Lichello's revised format for record keeping looked something like
 Quarter PC      SV      Cash    Action   Total Value
 03/2020 10,000  $11,000 $2,000  S:0      $13,000
 06/2020 10,000  $12,000 $2,020  S:$1200  $14,000
 09/2020 10,000  $9,000  $3,241  P:0      $12,200
 12/2020 10,000  $8,000  $3,273  P:$1200  $11,200
 03/2021 10,600
Hi Daniel
The first of your two calculations (based on Tom's) looks the closer fit to ...
http://web.archive.org/web/20120609073103id_/http://www.aim-users.com/calculator.htm


Regards. Clive.
Hi Tom
The diversified portfolio vWave value present in the older charts is no longer included in the more recent chart. Was there a particular reason for dropping it?
Regards. Clive.
Having problems understanding sell safe @ 0%. If stock value is greater
than Portfolio Control when do you start selling.
SV = 10600
PC = 10000
Profit = $600 MINIMUM ORDER SIZE = $530
Sell = $600 (Is this correct?)
Hi Daniel
Selective extracts from Lichello's book (paraphrased) ...
Blue-chip/Mega-caps can be financially larger than entire countries and are more inclined to rebound no matter what. But even such stocks can still fail, just that they’re less inclined to fail. So a single stock is too few, much above 10 stocks is getting to be too many.
Select from the Dow 30 the strongest most up to date stocks as your base candidate stocks. One from each of the 11 sectors is a reasonable choice.
Buy in equal $ amounts, and look to keep them fairly even over time.
Review quarterly
“..if you operated your AIM program the right way, with a single program covering several stocks, when AIM asks you to invest a chunk of money you decide which your several stocks deserves it the most.”
o O o
Hi Tom. A large hedge fund that correctly called both the dot com and financial crisis has recently started shorting pretty much global stocks ex Asia. Fundamentally because the earnings impact from CV-19 have yet to be revealed, whilst prices have been propped up by most/all central banks. The US Fed for instance have the authority to buy up to 70% of each/any Corporate bond issue (which raises prices/lowers yields and has investors rebalance out of bonds into stocks - pushing stocks higher). Which alone equates to up to a $8Tn potential injection of 'new money'. A valuation/price disconnect.
Will be interesting to see if their prior calls were pure luck, or skill. What with Japan and EU Central Banks ...etc. ...etc. now buying up junk including stocks/ETF's backed by legal counterfeiting - 'interesting times'.
In a zero interest rate world, variations of forms of QE is the only tool remaining. Personally the funds reasoning seems more like a case of fight the fed to me - which goes against common mantra. Admittedly however they have factored for that - considering it more a case of expectation of low/negative forward real gains for a number of years.
With broadly flat however - AIM tends to relatively outperform overall. So
Like nothing happened,
Valuations back to norm.
Where will they go now?
I opine that a primary benefit of AIM is behavioural training.
Most people when they go to the grocery store upon seeing a good 2 for 1 or low price offer will tend to buy/store more of that item, or if prices are high avoid buying that item that week - suspecting they'll be able to buy it later or elsewhere for less.
With stocks that commonly flips entirely around. Many will buy high, capitulate low. Greed and fear. The net consequence has been estimated to be around a 2%/year average cost of such behaviour, and being a average some obviously took a much bigger hit.
AIM better navigates such behaviour towards good behaviour, the opposite side.
If you were naturally at/near 100% all-in at the 2009 lows, having bought more stock during the declines, and profit took/sold some in later periods to uplift cash reserves again - then likely you don't need AIM (but could still run AIM as a confirmation measure). If you don't have a history of buying the dips, profit taking the highs, then likely you'll do better by looking over AIM's shoulder as it guides you. Eventually that guidance will become second nature and AIM will have done its job. But its guidance is addictive - it's comforting to have another providing confirmational encouragement, the 'yes you're doing the right thing' type fatherly figure.
If, as seems the case, there's a bunch of investors out there who are on average throwing 2%/year away, then providing liquidity to those investors (taking the opposite side) has the capacity to capture that throw-away.
Clive.
To add to Toofuzzy's comment, the vWave can also be used by those in retirement years as a indicator of how much might reasonably be drawn from the AIM for spending. Recent diversified portfolio vWave value of 25% cash reserve being indicated for instance, and if your actual cash is 30% then draw the surplus 5% and drop that into whatever interest paying cash account you might use to make cash withdrawals from.
A low SWR, say 2% provides a steady/stable source of income production with relatively low risk. With SWR such as 2% you draw 2% of the portfolio value at the start, and then uplift that amount by inflation as the amount drawn in subsequent years - so a consistent inflation adjusted income is provided. Top slicing additional amounts such as above to supplement that bolsters the total amount of income being drawn/spent i.e. 2% SWR might be enough to cover basic living expenses that are supplemented with additional cash periodically being added from AIM selling shares to levels that exceed the amount (percentage) indicated by the vWave.
AIM is pretty good at throwing off 'surplus' cash, albeit not in a regular manner (at appropriate times after stocks had performed relatively well).
vWave as other have said is also a reasonable indicator of what level of cash reserve to start a new AIM with today i.e. 25% for a diversified AIM.
Clive.
Silver
Gold/silver ratio ... this chart goes back to 1915

Gold/silver are both a form of global currency, and are a form of commodity index/asset. Might somewhat correlate to other commodities such as oil/energy.
As Corona (fear) fades (whenever) so the flight into safe assets (such as US$) could see some outflight (greed), in which case in US$ terms gold/silver might rise in price ($ down/gold up), but where perhaps silver might rise relatively more than gold. If fear sustains then so silver might see larger decreases in price as the $ rises further, given its relative valuation compared to gold. Just a guess. Whatever, a historic new relative high is always worth keeping a eye on.
Clive
Hi Jaiml
Yes still using the log stochastic approach. Looking like that got to deploy relatively little (just 20%) of cash. Had expected a pandemic and shutdown/stay at home economy to dive deeper. Seems to have barely even dipped to 'fair' price. Whilst we could see dives back down again, rather hope that's not the case.
My guess is that we wont see any vaccine any time soon and instead some kind of predictive test (and treatment) will be identified that can spot the smaller proportion of those more inclined to go into a cytokine storm - where those contracting the virus have a week of flu like symptoms, start to feel better after the 7th day, but then take a sudden and rapid turn for the worse - that seems to occur in around 10% of cases - which for a high percentage of those can turn out fatal. If that can be predicted/prevented then the death toll could be much lower and the issue then becomes more like a regular flu-like event. Could be something as simple as anakinra injections (that are more commonly used used in the treatment of rheumatoid arthritis). https://www.newswise.com/articles/here-s-a-playbook-for-stopping-deadly-cytokine-storm-syndrome - and as such could see a rapid turn around (less need to lock down, let it run through the population and where relatively few die, and where most are back to work after a week or two of having endured a flu like illness).
Regards. Clive.
it was May of 2009 when it was last this low.
Hi Tom
IAU, a gold surrogate, quit rising which was also a surprise
I'm looking forward to being 100% invested again. I've not been that deeply invested since late 2008. It will be another chance to be on a par with Mr. Buynhold. With AIM these times don't come along very often.
End of the beginning.
Corona virus is out there, widespread. The relatively few actual numbers of deaths in the 4% to 8% fatality rate are mostly the ill/elderly, numbers that are set to explode exponentially over coming weeks (as widespread contraction of the virus explodes). Provided the virus doesn't mutate into something even/much more deadlier then potentially June might see the peak of contagion and between now and then fear both socially and financially will be rife.
A alternative approach to trying to scale more funds into stocks according to relative valuations (comparison of performance to conservative asset allocations/bonds) might be to just simply scale in ( Dollars / Number of weeks/months ) amounts each week/month. i.e. $100,000 of cash, target perhaps 4 months of averaging that into the market, buy $25,000 of stock each month (or $6250 each week).
On the personal front, the fitter you are prior to contraction the better your chances. Even 80+ year olds have a 75% chance of getting over the virus. Under 40's have a very good prospect of getting over the virus. Pneumonia seems to be a critical factor so drink lots and often (helps wash any virus out of the throat into the stomach where acids kill it), good hygiene/food.
For Europe that will be approaching summer months a hope is that the stronger sun (higher radiation) will help kill a lot of the free floating/environment virus.
Fundamentally the Corona virus is now out-there, everywhere. Potential containment is history, we'll just have to all be exposed to it, many contract it and for some endure mild flu like effects before having it added to individuals natural immunity banks, but be more severe to some, fatal for others (2% to 3%).
We're not even at the end of the beginning. China has been dealing with it for a couple of months even with its extreme regime based management. The Fed injecting 1.5 trillion is equivalent to 5% of the year start stock market value, timed to occur with the end of week along with the Euro doing similar to have a possible 'green' day. Suspect however that will just be a dead cat bounce, the consequences/issues will run for weeks/months yet.
Avoiding deflation at any-cost, propping up markets may not work. Especially as year end 2019 valuation were already relatively high. Short selling is likely to again be banned as in India at resumption next week IMO.
A year from now, and it will have been just another down dip historical event, earnings will recover, stock price trends from wherever they end up will be generally upwards. The main factor however is from where. I'm speculating from S&P500 1500 (so anticipating yet further declines to yet come).
Hi Tom.
I've opted to use this as my (potential) deep dive 'alternative' Relative Valuation https://tinyurl.com/u5hgt6n


From year end 2019 levels, the Total Stock Market index would have to drop -51% to align with a 20/80 Small Cap Value/10 year Treasury 'conservative' asset allocation. Or -72% to drop down to the 10 year Treasury line.
Counting that 2019 year end value as the 'top', when the S&P500 was 3221, that has the 20/80 line at 1583 and the 10 year Treasury line at 740 (bottom).
At any point within that range I can calculate a appropriate amount of cash reserve to have remaining using a log stochastic measure
( log(current) - log(bottom) ) / ( log(top) - log(bottom) )
But when to trade? One option is to use those three levels and also add in two more intermediate points
.e. 4 buy target trade price points

 3221
 				2402
 1583
 				1161
 740
Hi Tom
Last week we were net sellers of long bond funds and gold and buyers of small and mid cap dividend ETFs in the US markets.
Hi Toofuzzy
Keeping powder dry here also. Blue line (20/80 SCV/10yrT) awaiting until they see the whites of their eyes (dip down of red line Total Stock Market)
https://tinyurl.com/vcny9f3


Still a long way off yet. The recent announcement of a oil price war has certainly moved the red line that bit closer however, UK Monday open seeing prices down more than -5%
Clive
Hi K
And now, now it is up again, why
Hi AIMStudent
AIM'ing at the lowest price does not beat B&H starting on same date (over selected datasets.)
.
.
Third panel is AAPL over 37.6 years, not allowing cash to go negative
AIM'ing at the lowest price does not beat B&H
Hi AIMStudent
Apr 1999 - Jan 2020 50/50 QQQ/VBMFX 7.56% CAGR versus 7.79% for 100% QQQ
https://tinyurl.com/w9bvtbj
Clive
In my case (with ETFs) I reinvest the dividends which effectively relatively lowers the hold zone compared to taking cash dividend. But then I increment the PC by anywhere from 10-25% which raises the hold zone. The net effect of my method is to lower that amount of cash as I don't add to my cash reserve with dividends.


This is the summary of a backtest from 1972 using the S&P500 (10 year treasury for cash) with Portfolio Control being uplifted by 2 times inflation at each (monthly) review.
The 1970's had very high inflation, so the test was primarily to have a look-see at what AIM with a 2 x inflation PC uplift might have 'looked-like'.
Quite a few AIM buy trades were missed due to cash reserves being unavailable (if a monthly review indicated a buy action but insufficient cash was available to fully fill that instruction then that months review was simply ignored).
https://drive.google.com/file/d/1vxVafGaIxlLeTH86HrF6GYw1Fic1DjWu/view?usp=sharing
AIM annualised 11.1% total return (73% average stock exposure), versus 100% stock Buy and Hold annualised 10.3% total return

Clive
Something I've been doing with my "income" funds is to index the Portfolio Control once a year in January by the yield at that time. So, if a fund is paying 2.8% annual yield, I take the Portfolio Control and multiply it by 1.028. This has helped postpone selling and raise the 'next buy' price enough to help give these funds at least a chance to buy back and also keep the cash reserve proportional to the investment value.
Since each fund yields a different amount, indexing by each fund's then current yield makes the adjustment appropriate for each type of income fund.


Hi Adam.
Lichello said leave things as they are. Generally the share price drops by the amount of dividend value paid, so with additional shares the stock value (that AIM uses for its calculation) remains the same (all else being equal).
He also advocated not having a common cash reserve as he was fearful of one bad holding eating all of those reserves on its way to zero.
Clive.
Hi Toofuzzy
If you want to increase 2% annually but want to do the increase monthly ( it will end up being a compounded rate I think)
.02 x 1/12 or ( .083333 ) = .0016666
So PC x 1.0016666 monthly
I think Clive's # gets rid of the compounding effect.
But why complicate things?

