 News
News  Market Data
  Discover
Support: 888-992-3836
Copyright © 2023 InvestorsHub Inc.


dindindon
![]()
Register for free to join our community of investors and share your ideas. You will also get access to streaming quotes, interactive charts, trades, portfolio, live options flow and more tools.
Register for free to join our community of investors and share your ideas. You will also get access to streaming quotes, interactive charts, trades, portfolio, live options flow and more tools.
Sky diving at Sky's the Limit
0.618 1360,86 [1329.24:1380.39]


Re intraday skimish
hover around before the moment of the truth
1334-1342 decision zone (click to see the chart)
06/30 http://forexrainbow.com/images/03856201018517219679.jpg
05/19 http://forexrainbow.com/images/52133815801393836875.jpg
03/14 http://forexrainbow.com/images/29024075233160548591.jpg
Intraday skirmish
Monday, July 23, 2012 12:22:04 PM - actions seems local bounded
Instead of 0.236, index breached 0.382 1353.92 vs 1353.25 (actual).
Then deployed another 0.786 pullback 1340.92 vs 1340.76 (actual).
Local Resistance 1345.53.
Now it is at critical juncture: When index cut through important support 1334.48-1336.98 it will have hard time to assault 1380-1389.07 in short time frame. (refer to the bottom chart) and additional comments

Older charts


zone 1336.98-1334.48
intraday 1337.56, reference point 1337.18 (0.786), 1336.98 (0.382)
actions seems local bounded. resistance 1347.67; Turns bearish if cuts through 1336.98-1334.48, (50SMA 1332.84 as of 07/23)
older chart
intraday update based on the latest data
The Fibonacci time zone cluster falls on July 19, August 03, August 17, and September 25. +/-
on bullish side, there is about 1/2 trading day time window to determine whether index can reach 1389.07. Or, conversely, if index can cut through the early bearish gauge 1363.90-1359.39.

thanks the free upload web hoster(Forexrainbow.com) http://forexrainbow.com/index.php
additional comments
DowDeva
Thank you for your kind words!
QE3 hype anchors market’s bullishness. Hard to perceive the outcome.
From a technical view, both the 1389.07 and 1381.05 are important pivots to watch. the former one is the 0.786 retracement between recent high 1422.38 and recent low 1266.74, the latter one is the 0.786 retracement between all time high 1576.09 and all time low 666.79. I have an impression that 0.786 is a good gauge and can be applied for the current condition. Now, the 0.707 retracement between October low 1074.77 and the unrealized high 1440-1443.88 is 1333-1334. so, if index can surmount 1381.05-1389.07, the odd to see 1440 is increasing. A pullback but can hold above 1333-1334, there is good odd to see 1400-1403.
IMHO, Even if Fed launches QE3, after an initial spike up, it will be sold hard. Monetary policy is not omnipotent, and Bernanke knows it, therefore, investors acknowledge it too, they will treat QE3 as the last chance to escape. Let's see what will happen near the coming September Equinox.
Feb 17 2012, 01:43 AM
After the tangential movement above the inflection zone 1334-1342 for 6 trading days, Index ascends to a juncture that either it will turn down before breaching 1376.55 or pave the road to a more bullish route (1376.55 -->1342-->1443.88).
comments: déjà Vu

Feb 17 2012, 01:43 AM
By reviewing the 0.236/0.382/0.616 retracements for layer 4,5,6 in the following chart. It is very clear that 1292.66, 1267.06, 1381.50 are critical check points. It has to ‘grow’ higher so that the 0.618 pullback will not be lower than 1292.66 & 1267.06.
comments: on 06/04 index breached 1266.74 then reversed, himmm

First successful attempt on 1376.78
1374.81 on 07/03
1375.26 on 07/18
1378.23 on 07/19 First successful attempt on 1376.78, the lower side of the resistnce
0.707 1376.78 [1422.38-1266.74]
0.786 1389.07


prior post
re: what is the next?
overall: re-test the resistance, major event takes time but it lies ahead. We are fast approaching the major time cluster.
prior outllook - 03/25/2012 03:03:59 PM

comments: 04/02 1422.38

comments: index met 1292.66 & 1267.06 these two important pivots ( in red color boxes). rally since 1074.77/1158.67 is corrective.
The Fibonacci time zone cluster falls on July 19, August 03, August 17, and September 25.
Speculations: Major event lies ahead!!!! We are fast approaching the major time cluster.
(1) On September 17, 2012, it is the 2000 * PI trading days from October 19, 1987 Black Monday.
(2) About the same time, the middle term of the Bradley Siderograph reaches a major turn window, http://www.robertew.com/invest/bradley/br2012.jpg
Note: The middle term in the Siderograph is different from the standard Siderograph http://forbestadvice.com/Money/Gurus/DonaldBradley/bradley2012.GIF
(3) [.....]
Re: asymmetry in the amplitude
techcharter: "What does it mean about the trend when the magnitude of the output of a band pass filter over the positive half of the cycle is greater than the magnitude of the negative half of the cycle?"
Hi techcharter
For comparison purpose, I pasted an older chart from my work at the lower section. Yours at the upper section. imho, in either case, the asymmetry in the amplitude may come from filters' transient characteristics itself.

re band pass filter
Hi Oddlot
The filter settling time is an important criteria. as long as the underlying wave can persist its cycle longer than a factor of the settling time, you may expect a possible good 'snap shot'. The other equally important criteria is the impulse response.
Then, the Q factor, ... etc. These requirements are so different from the Fourier based analysis. ... ...
To say the less, the signal’s Randomness ( versus unpredictability, see http://en.wikipedia.org/wiki/Randomness#In_statistics ) is the key. usually the daily Open/Close discontinuity noise may smear the signal quality.
Re Band Pass filter
Hi Oddlot
The band pass filter allow signals with the intrinsic frequency within the band to pass through. Say high limit is 50 trading days, low limit is 25 trading days, the pass band is from 25 to 50 TDs. Signal frequency out of the pass band will be attenuated . Signal frequency within the band will pass through.
However, signals produce aliasing effect within the band. My studies showed there is no such ideal band pass filter that can ‘snap’ the hunting frequency with reasonable ‘visual’ quality. In general, the phase and magnitude generated by those band pass filters for stock market indices is not reliable and/or in consistency. Occasionally, you can home in a nearly ideal cycle wave, but sooner or later, it drifts out. I could be worng on such assessment. Just my 2 cents.
DinDinDon
Re: Band Pass filter.
Here is a brief discussion.
Hi techcharter
Let’s start with an ideal case:
In the chart top section, there are 3 cycles, 80TDs (Trading Days), 100TDs, and 125TDs. The lumped sum cycle in the middle section, and the restored 100TDs (at the bottom of the chart). The restored 100TDs came out of a 97.5TDs-102.5TDs band-pass filter. The filter type is Butterworth. external second order, internal 4th order. In basic, the cycles lies outside the band has been rejected. This chart demonstrated that an embedding cycle can be restored correctly by proper filtering process.

The following chart is a band pass magnitude and phase chart.
In the center of the band, the gain is normalized to 1.0. The gain drops quickly off the center band.
The phase on lower frequency (longer cycle) side has a leading phase shift, depends on the filter type and order, it is close to +180 degrees. Conversely, the phase on shorter frequency (shorter cycle) side has a lagging phase shift. it is close to -180 degrees.
The phasing problem causes a big puzzle in the cycle study. A particular cycle may drift so that it is hard to quantize. If our goal is try to sense the rough direction, we can take the advantage of the leading/lagging characteristic. Since +/- 180 degrees involves only a sign flip. i.e, sin(45 degrees)=0.707, sin(225 degrees)=sin(-135 degrees)= -0.707.

The phase shift needs to be corrected, it came from the cycle drifting. The band-pass filter phase chart tells you how much it will be. At this moment I can do the correction manually. It is a very time consuming job,
the filter has a noticeable settling time ( http://en.wikipedia.org/wiki/Settling_time ), and its step response shows rich ‘rings’. Thus why a small changes (in the S&P500 index) can cause an apparent reverse polarity and magnitude 'ramp' in the cycle chart


At this moment, if you see magnitude starting to show resonant frequency, it is an evidence that the hutting cycle is active but there is no easy way to get reliable quantitative data.
My 2 cents
What is the next? not much needs to be revised
This is an update post, refer to older post released on Tuesday, February 14, 2012 11
review:
on 02/29, index marked an intraday high 1378.04 then reversed down
on 03/06, index marked an intraday low 1340.03 then reversed up

wave set 2 [1158.66|1267.06|1202.37]
2.000 1419.17
wave set 3 [1074.77|1292.66|1158.66]
1.308 : 1443.88
1.382 : 1459.78
1459.78: a point too far?
Not that far when index takes out the resistance 1416.05 & 1419.17.
But, it also has to deal with a time factor.

closing/Final
Good Luck!
RE POKERSAM - wave
The same information has been posted on Jan 25 2012, 01:03 PM
wave set 2 [1158.66|1267.06|1202.37]
1.500 : 1364.97
1.618 : 1377.76
wave set 3 [1074.77|1292.66|1158.66]
1.000 : 1376.55
1.308 : 1443.88
Review:
Feb 3 2012, 09:14 AM
Index at the inflection point (to see 1376.55-1443.88)
synopsis:
After the tangential movement above the inflection zone 1334-1342 for 6 trading days, Index ascends to a juncture that either it will turn down before breaching 1376.55 or pave the road to a more bullish route (1376.55 -->1342-->1443.88). For the bearish case, bear needs to count on if index can dive below 1292-1295 quickly.
Wave counts:
counts has been omitted intentionally. Once you put counts, the market morhps into a different one. The Fibonacci projection provides better scope.
Feb 6 2012, 12:23 AM
I skip a long section I wrote earlier. Anyway, these gobbledygook wave ‘infrastructure’ is not an effective way for a pictorial outlook. I may post it when grapes are ripen
Wave can be decomposed into 6 layers, chart gives you an overall picture.
Each layer implied a bullish extension
layer 6
wave set 2 [1158.66|1267.06|1202.37]
1.500 : 1364.97
1.618 : 1377.76
layer 5
wave set 3 [1074.77|1292.66|1158.66]
1.000 : 1376.55
1.308 : 1443.88

In the paper Peter Goodburn wrote, he mentioned “Elliott's inclusion of the Contracting Diagonal”, then he brought the new concepts: “The Expanding-Diagonal, a mirror image of the Contracting type pattern” and “Triangle terminology - counter-trend vs. trend impulse patterns”. furthermore, he wrote “During the many years of teaching the Wave Principle, I have found students often confused by this because both are distinctly different types of pattern, yet both incorporate the term "triangle". To make it easier, I have dropped the association "triangle" when referring to the diagonal so that a diagonal is either a generic leading-contracting/expanding diagonal or an ending-contracting/expanding diagonal, leaving out the term triangle altogether.”
Author Terms
EXPANDING DIAGONAL PATTERNS
By Peter Goodburn
Charts compiled & edited by Kamil Rajec
http://www.wavetrack.com/articles/elliott-wave-expanding-diagonal-patterns.html
WaveTrack International (WTI) - http://www.wavetrack.com/wavetrack-international.html
WaveTrack International GmbH http://www.wavetrack.com/
All rights are copyright to WaveTrack. Reproduction and/or dissemination without WaveTrack's prior consent is strictly forbidden. We encourage reviews, quotation and reference but request that full credit is given.
Thanks to MultiHoster for free image hosting http://forexrainbow.com/
Jan 25 2012, 01:03 PM
The event that Index took out 1292 has established a bullish stance. Thereafter, It also took out the important inflection zone 1334-1342. The bull strength is solid. Only time can resolve its stiffness.


Thanks to MultiHoster http://forexrainbow.com/ (free image hosting)
Jan 10 2012, 12:23 PM
wave set 1 [1202.37|1269.37|1248.64]
1.618 : 1357.05
wave set 2 [1158.66|1267.06|1202.37]
1.382 : 1352.18 vs. 1354,32 on 02/09
1.500 : 1364.97
wave set 3 [1074.77|1292.66|1158.66]
1.000 : 1376.55
1.308 : 1443.88
Key points to watch
1357-1365, 1376, 1440-1450;
1315-1318, 1295-1302
1125-1135, 960.
Updates. 12/24/2011.
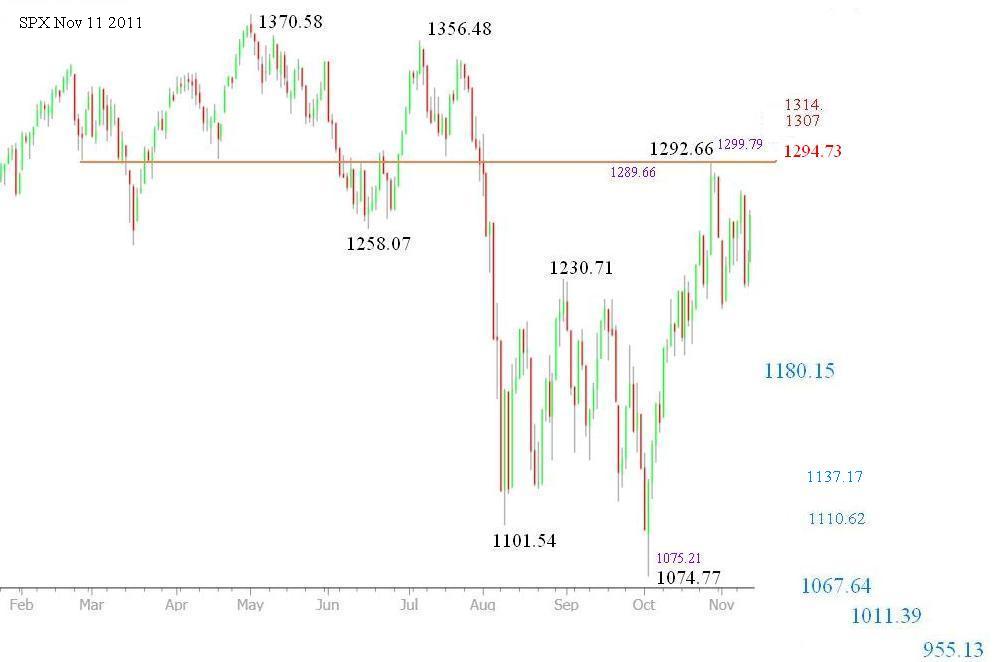
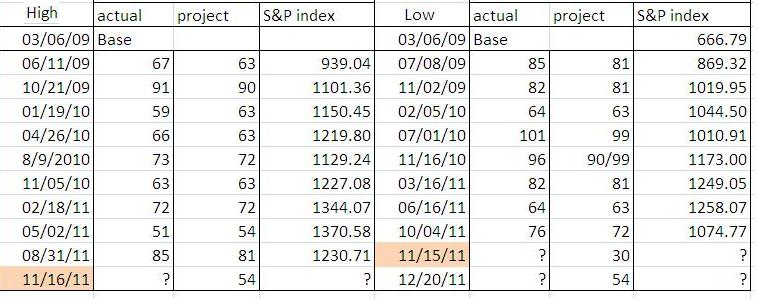
Table: Oct 28 2011, 02:01 PM
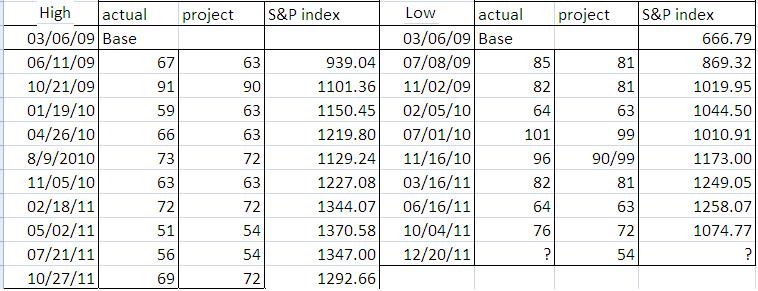
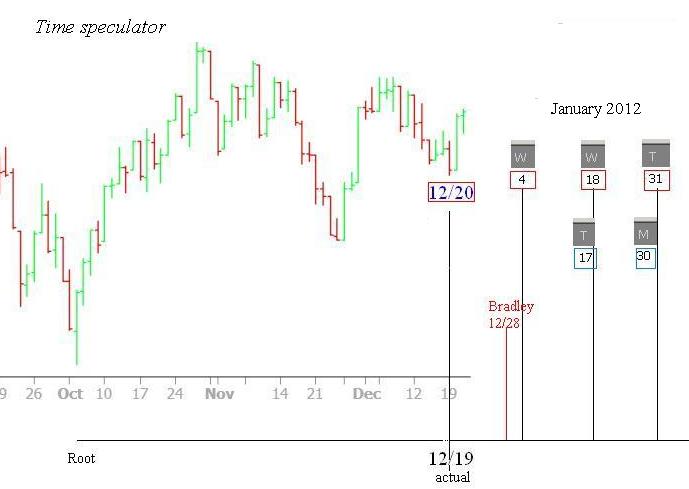
The King Wen's sequence suggested 12/20 could be a low, the atual date was 12/19. This time speculator is not an aggressive one, the rest of the possible low dates are 01/04, 01/18, 01/31. However, it also seuggests the high dates 01/17, 01/30. This kind conflict has been found in my June 05 report. (see the bottom table), We all knew the rest of the story. S&P500 index drove below 1294 on 07/29, & started a down wave, finally it cratered on 10/04 at 1074.77. On Oct 27, index re-tested the important Fibonacci point 1294, it marked 1,292.66 then reversed. Put all together, the middle March is a very important time zone to watch.
note: this time speculator has no visibility on short term cycles, i.e, < 54 trading days. December 19 just in the margin. & has no hint the low has passed.
The complete King Wen's sequence are: (81,126,63,108,90,99,54,117,72)
(a.) Ken Wen’s sequence see conflicts again
12/20, 01/04, 01/18, 01/31 [Low]
01/17, 01/30, 02/10 [high]
(b.) Bradley Turn dates
12/28 , 1/11, 1/28, 2/16, 2/22, 3/16
(c.) 108 trading day cycle 03/12/12 +/-.
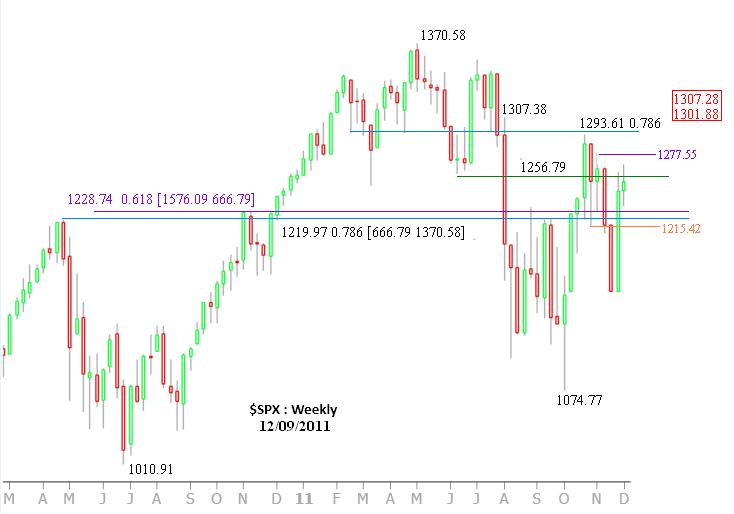
Market deployed the beatuy of the Fibonacci ratios; At the end of movement, the retracements is getting bigger, i.e, > 0.786. It signals the erratic action is drawing an conclusion. Lady Market loves teasing the speculators, perhaps she will deploy twin peaks either at 1267.06, 1277.55, or 1292.66, you pick it
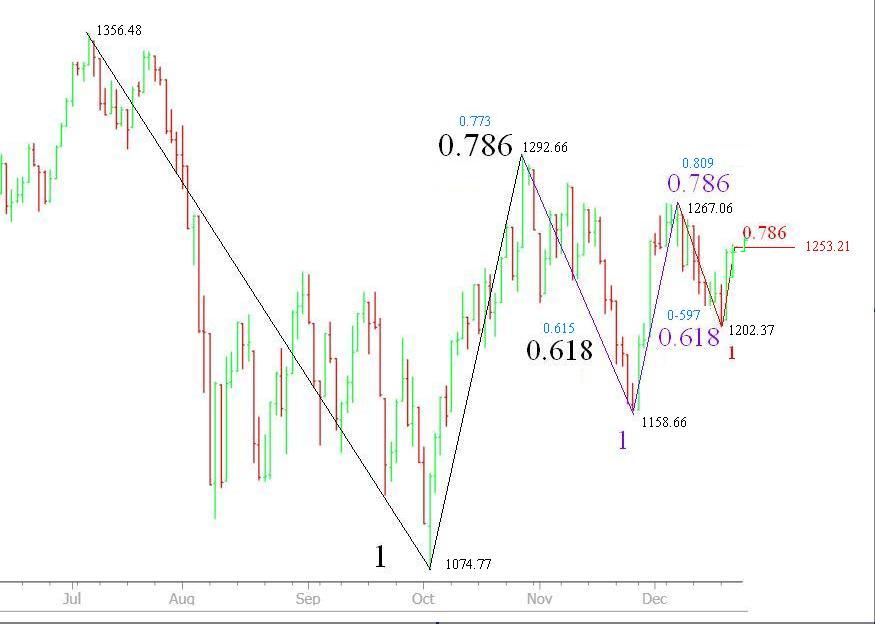
A new table will be inserted for the gap in between 1070-1000, it is premature to do so.
Jun 5 2011, 09:04 PM

intraday low 1163.79 11/23 at this writing.
posted earlier
11/23 is a possible turn date (1), wait 1 or 2 sessions to probe the true direction. however, Time is a magic machine, Fighting for a big Battle requires Patience, (2).
Have a good holiday All!
(1)

(2)

dips below 1176
DowDeva
so far the intraday low is 1183.16. I use S&P500 cash intrady high/low for speculations, not future. some technicians use open/close, 13/sma/20sma/50sma ... just a different taste.
RE Stock Dragon 1230
Thank you for your inputs,
I think the gauge to see 1230 is around 1209 (0.236) and index needs to close above 1196 for Today and the next few seeesions.
1229 is one of the big FIbo point, 0.382 in reference of 1576 vs. 667.
The following chart indicates the significance of 1221 (actual 1217.28 on 04/23/10) and 1229 (actual 1227.08 11/15/10)

1183.16 vs. 1180.15
The bounce off the 1209.48 (11/17) only reached 1223.51 (11/18).
Today (11/21), index opens at 1215.61, then, it cut through the immediate support 1202 as if it is not there.
------------------------------------------------------------------------
Thursday, November 17, 2011 2:55:36 PM
investorshub.advfn.com/boards/read_msg.aspx?message_id=69114063
reference point 1208.48 observed on 08/17. nearby resistance 1228 is a major FIB. coincidently, a 0.236 bounce will reach 1229.45 (1209.75 vs. 1292.66). immediate support 1202 is the mean between 1228 and 1176
------------------------------------------------------------------------
11/21 intraday status at this writing
RUT--0.500--0685.59--actual 0696.72
S&P--0.500--1183.16--actual 1183.16-- first target is 1180.15 (refer to chart)
NDX--0.618--2184.09--actual 2188.14
Indices exhibit different strength, NDX is the weakest.
The difference between the first target 1180.15 and 0.5 retracement 1183.16 (1292.66 vs. 1074.77) is small. however, when index dips below 1180.15 it is suggesting further decline is looming, bounces off 1183.16 says the local frame is still imposed (1292.66 vs. 1074.77). Soon we will know whether there is a meaningful low on December 20, step by step.
------------------------------------------------------------------------
Wednesday, November 16, 2011 12:48:19 AM investorshub.advfn.com/boards/read_msg.aspx?message_id=69037068
12 November 2011 - 05:22 PM
http://investorshub.advfn.com/boards/read_msg.aspx?message_id=69037068
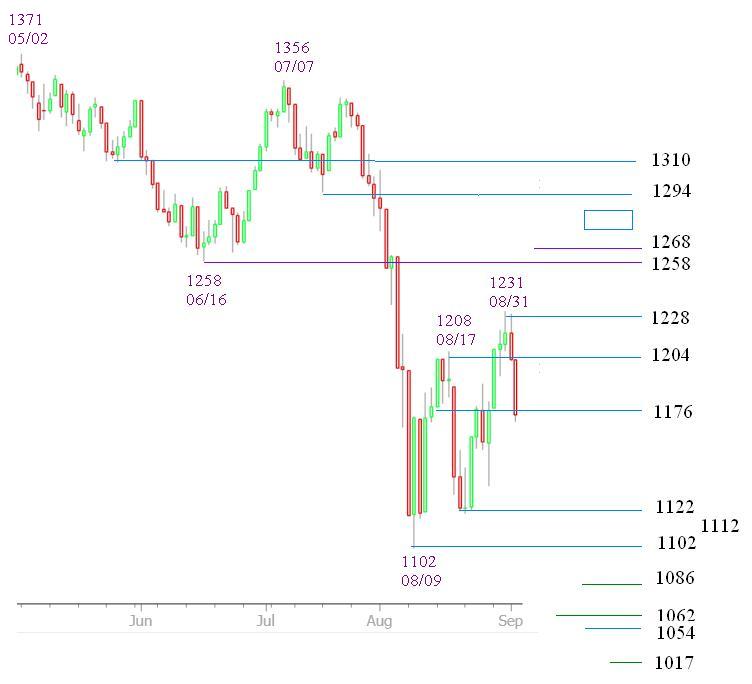
for 'near term' (loosely defined semantics), ..... When index dives below 1176, the downward flush will start.
------------------------------------------------------------------------
triangle shows its tails, breaks down just in time, see table below.
------------------------------------------------------------------------
Wednesday, November 16, 2011 2:02:36 PM
investorshub.advfn.com/boards/read_msg.aspx?message_id=69061747
Table shows the High/Low conflict, however, any volatile rhythms will be washed out by the time machine , the triangle saga will end soon.
------------------------------------------------------------------------
connecting flight to 2012
time pivots: 11/22-23, (12/20), 12/28,
Tuesday, November 01, 2011 11:25:45 PM
http://investorshub.advfn.com/boards/read_msg.aspx?message_id=68579742
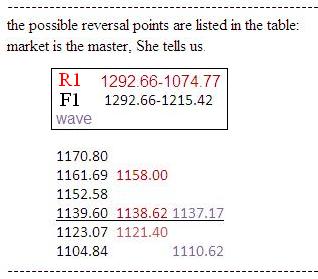
summary: The peak point 1292.66 observed on 10/27 is an important Fibonacci point
Possibility: perhaps you will not see it again this year. odd 50/50.

03/16, (03/12), 06/12, (05/26), 07/28
Tuesday, November 01, 2011 1:53:08 PM
http://investorshub.advfn.com/boards/read_msg.aspx?message_id=68561115
someting big is going to happen next year, imho: The key is how to 'balance' in between March/12 and Dec/11
For ‘hit and run’ trader
intraday low at this writing is 1209.75, index has retraced 0.382.
bull says: well, it looks ‘not that bearish’.
1292.66 10/27
1074.11 10/04
0.382 - 1209.17
reference point 1208.48 observed on 08/17. nearby resistance 1228 is a major FIB. coincidently, a 0.236 bounce will reach 1229.45 (1209.75 vs 1292.66). immediate suport 1202 is the mean between 1228 and 1176

Put all together
This post put all time frame speculations together
The action item is very simple, as mentioned in my November 03’s post, accumulate reverse ETF progressively, the gauge, if uses S&P500 as an example, would be >1250. this is a swing play. To ‘access’ the market, somehow, a dice needs to be placed.
(1) middle term
Time flies, when I put out the ‘long’ term target that was in April, 2011. So, now, I shall call it the middle term target: 950; The key level to watch is 1054 which is the 50% retracement out of 1440 vs. 667. This level was a hot spot when the October plunge cratered at 1074. Based on the already deployed trajectories, somewhere in between 1054 & 1086 will be tested again. As time approaches (March/12 – June/12), we can do the fine tuning. The lowest number for the near term target is 955.13 (refer to (2)). so I have maintained the consistency in between the near, middle and long time frames. Important reference numbers are 1294, 1176, and 1054, these number give us the rough hints how the zigzags will traverse among those Fibonacci points.
---------------------------------------------------------------
Apr 24 2011, 02:49 PM
I have a tentative estimate for S&P 500 index low target. It is around 950 (940-972). ......The magnitude and dates should be considered as a guideline and is subjected to change when newer data arrives.
881.38 = [0.236|666.79:1576.09]
1014.14=[0.382|666.79:1576.09]
mean of (881.38 + 1014.14) = 947.76 == 948, round into 950
May 10 2009

---------------------------------------------------------------
(2) near term in chart 1 from the following link
Wednesday, November 16, 2011 12:48:19
http://investorshub.advfn.com/boards/read_msg.aspx?message_id=69037068
(3) long term [Da-bottom]
Thursday, November 03, 2011 12:39:17 PM
http://investorshub.advfn.com/boards/read_msg.aspx?message_id=68643948
Sep 5 2011, 01:57 AM
Sep 5 2011, 01:57 AM
No intention to mislead, the projected low date 12/20 (in prior post) is the first date in the whole sequence, I found in the past if I enumerate the whole sequence, it actually diffuse the focus. will keep posting the updates
Review:
Table (1) shows the High/Low conflict, however, any volatile rhythms will be washed out by the time machine, the triangle saga will end soon.
Symmetrical Triangle (Continuation): http://stockcharts.com/school/doku.php?id=chart_school:chart_analysis:chart_patterns:symmetrical_triangle
---------------------------------------------------------
Monday, October 31, 2011 9:27:49 PM
http://investorshub.advfn.com/boards/read_msg.aspx?message_id=68536324
In summary: my time speculator suggests 11/15 will be low, 11/16 will be high .... Volatile sessions may present due to the high/low date conflict.
---------------------------------------------------------
Table (1)
Oct 28 2011, 03:01 PM
Outlook:
table (2) shows the possbile low lies ahead, around 12/20.
the intraday high 1277.55 observed on 11/08 correlated with a minor hgih (not shown in the table); After 11/22, if the high still not pop out, the chance to see a high is fading even though the possibility is not completely out.
Table (2)
Nov 16 2011, 02:00 PM
Time table ties with the 108 trading day cycle. The method is adaptive, it aligns itself when a high/low is materalized, this is not an aggresive speculator, it also suffers from some limitations. I will give more description in the future. Here are the links to the theory:
The 108 in King Wen's Sequence By J.M. Berger
http://iching.egoplex.com/hidden108.html
[ii] The explanation of King Wen’s order of the 64 hexagrams by D.H.Van den Berghe
http://www.fourpillars.net/pdf/kingwen.pdf
[iii] The King Wen sequence (King Wen hexagrams divination sequence)
http://en.wikipedia.org/wiki/King_Wen_sequence
[iv] King Wen: Change And Symmetry
http://iching.egoplex.com/king-wen-new-symmetry.html
Review:
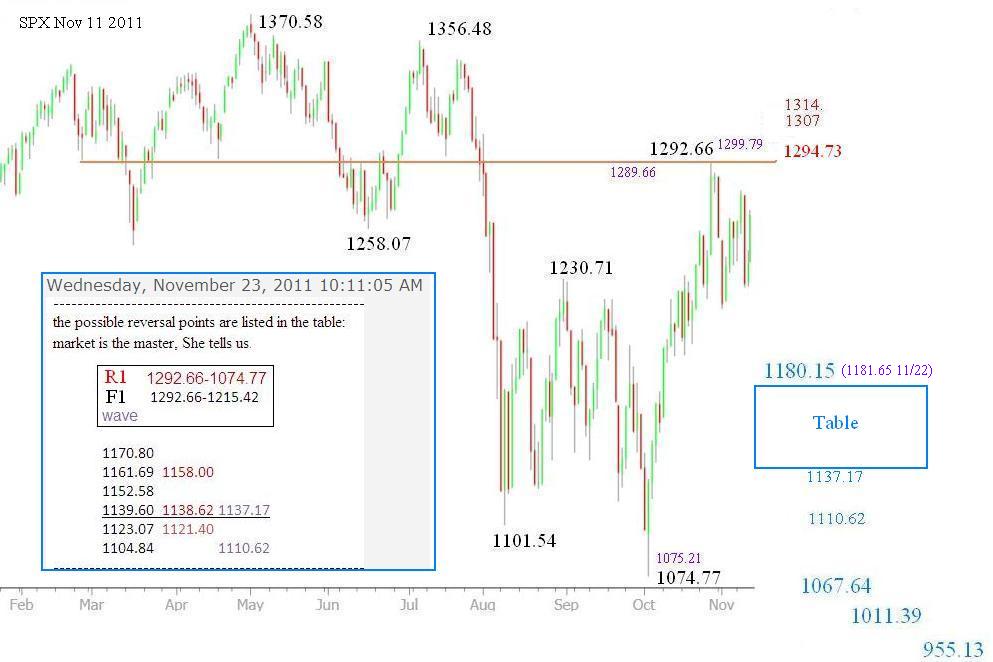
The significance of 1294 can be explained by the following chart
------------------------------------------------------------------
Posted on 31 July 2011 - 12:01 AM
S&P500 index dipped below 1294 on 07/29, it closed at 1292.28 (1292 is 0.809 out of 1440 & 667), a point slightly below the critical point 1294. The aberration is within the margin; The intraday low 1282.86 ( 1282.14 is 0.786 out of 1370.58 & 1258.07) gives a slightly negative bias. In overall, index is in the weak “Lagrangian points” that can move in either direction quickly.
for 'near term' (loosely defined semantics), let me post three charts:
Fibonacci retracements/extensions projection usually comes out multiple possible targets. chart 2 naild the low 1074.77 closer enough; chart 1 just a few days old; When index dives below 1176, the downward fulsh will start. refer to chart 3.
chart 1 - Posted 12 November 2011 - 05:22 PM
chart 2 - 10 August 2011 - 12:43 PM

chart 3 - Jun 27 2010, 05:27 PM
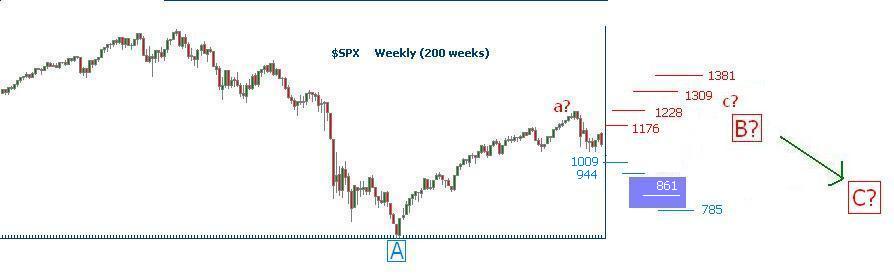
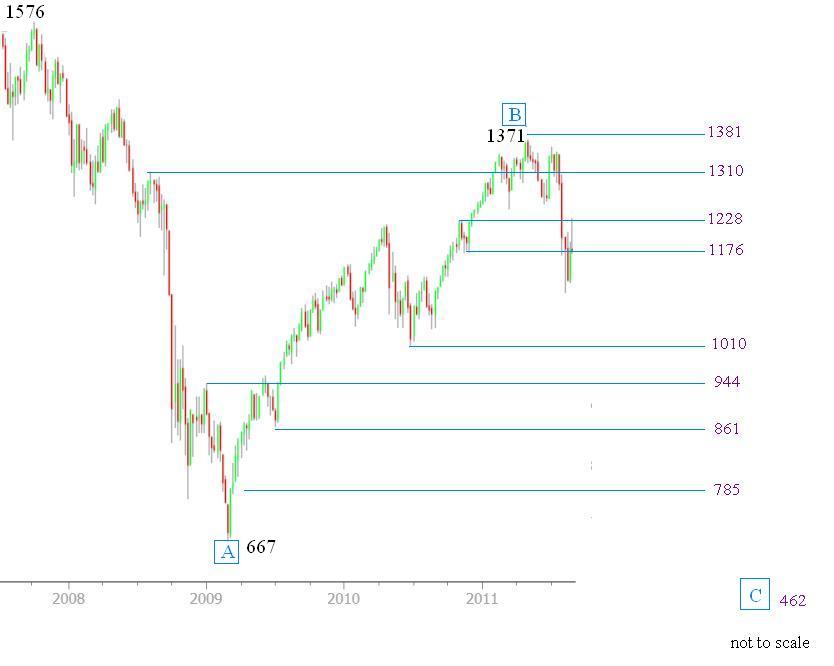
The Macro view
The counter trend rally off the 667 marked an end on 1371
chart was posted on 06/27/2010 (Time stamp & ID monthly_06_2010/post-5846-1277686575)
Outlook
for an ideal case: the wave will deploy a wave series in the structure of A-B-C, 5x3x5. If wave ‘C’ deploys the same wave length as wave ‘A’, then, wave ‘C’ will reach 462 (= 1371 – (1576-667)). It is about the averaged number back to year 1993-1994. Time length for the C wave could be 528,591,704 trading days. refer to the chart. Be cautious, the fact that wave ‘B’ roughly retraced 0.786 (actual 0.774, 0.786@1381) of wave ‘A’ suggests 5x3x5 might not fit, and there are different forms to deploy.
A 528 trading day from 05/02/2011 ( the day index marked an intraday high 1371) is around June/July 2013.
wave B time length 543, 1.54 (ideal 1.50) of wave A

Here is another reference:
Title: Prepare for the Global Long Wave Extinction Event
By: David Knox Barker | Saturday, August 20, 2011
http://www.safehaven.com/print/22240/prepare-for-the-global-long-wave-extinction-event
...... The next target in the long wave degrees of freedom radar is 7/28/2013 ....... The final phase of the global long wave collapse will radically change the global financial and political system forever. It will be change for the better. The worst years of this long wave winter season, which lie directly ahead, will provide the impetus and opportunity for global change on a scale heretofore unimagined.

What to do:
Build inverse ETF progressively when index ascend abot 1250, the depth is 100 point to the upper rail 1350.
dog fight in the gap area
1074.77-10/04 Low
1292.66-10/27 High
1251.04-0.809 FIB
1253.61-10/31 Gap top
1251.00-11/01 Gap bottom
1250.29-11/03 intraday high at this writing
John - RE: Nov. 22-23 & 1294
I searched into some of my old works and compiled into the following post.
(sorry, I don't know how to format these chart into a better sized images)
summary:
The peak point 1292.66 observed on 10/27 is an important Fibonacci point
What to do:
Any new attempt and/or surmount this point is a short sell signal,
Possibility:
perhaps you will not see it again this year. odd 50/50.
Fibonacci retracement check:
[1011-- 1371] 0.786 1294
[667—1440] 0.809 1292
comments:
Siderograph turn date 07/29-30 nailed the downward acceleration correctly
------------------------------
Posted on 31 July 2011 - 12:01 AM
S&P500 index drove below 1294 on 07/29, it closed at 1292.28 (1292 is 0.809 out of 1440 & 667), a point slightly below the critical point 1294. In overall, index is in the weak “Lagrangian points” ( http://en.wikipedia.org/wiki/Lagrangian_point ) that can move in either direction quickly.
comments:
1370.58 - 1258.07 = 112.51
1356.48 - 112.51 * 2.5 = 1075.21, 10/04 intraday low 1074.77
the area in between 1054-1062 will be tested again, 1054 is an important support.
--------------------------------------------
Posted on 10 August 2011 - 12:43 PM
comments:
Siderograph nailed the turn again on 10/28, index marked an important high on 10/27.
the significance for 11/22-23 worths attention. John’s cycle work suggests an important low. The 'important' turn date is due on 12/28.
The prior experience suggested these seconday turn dates, in fact, nailed important high/low. for example: an important low marked on 07/01/2010 (1010.91) in between the secondary turn dates 06/26/10 & 07/08/2010 ( http://forbestadvice.com/Money/Gurus/DonaldBradley/bradley2010.GIF )
----------------------------------------
Sep 16 2011, 07:54 AM

0.236 intraday
two attempts on 0.236. bulls has no luck today, 0.382 is tough.
s&P & RUT is 'behaving' the same.
Use RUT as an example:
769.46
712.54
0.236 725.97 -- prick 725.70 on 14he:27mins
Bradley date on 12/28
may be let me just say a little bit more
I have a low date on 12/20, the next few possible low dates wolud be in January 2012
Here is a quick review
someting big is going to happen next year, imho: The key is how to 'balance' in between March/12 and Dec/11
Bradley 2011 has an 'unquire' signature

“Viewers may go over the Bradley Siderograph for the next 8 years and find out why 2011’s is unique.”
( it has a relative narrow band for 7 months, you can not find this signature in the traceable siderograph, the common interpretation of the magnitude is not reliable. afterall, siderograpg is Indiscernible. The 'important' dates are nothing but the "max' and 'min' for each calendar year, the graph is normalized each year, so you always get that important dates, however, when you see the whole 'spectrum', you get different story ..... )
use this link to see year by year chart: http://www.robertew.com/invest/html/bradley.shtml
Thank You John
Re: an important low due late Nov
I am scrathing my head, I see the conflict on 11/15 and 11/16. can not perceive there is a possible low in late Nov. Last time I saw the conflict was on Jun 5, and slide commenced, I will closely watching the progress.
Thank You again!

http://www.fourpillars.net/pdf/kingwen.pdf
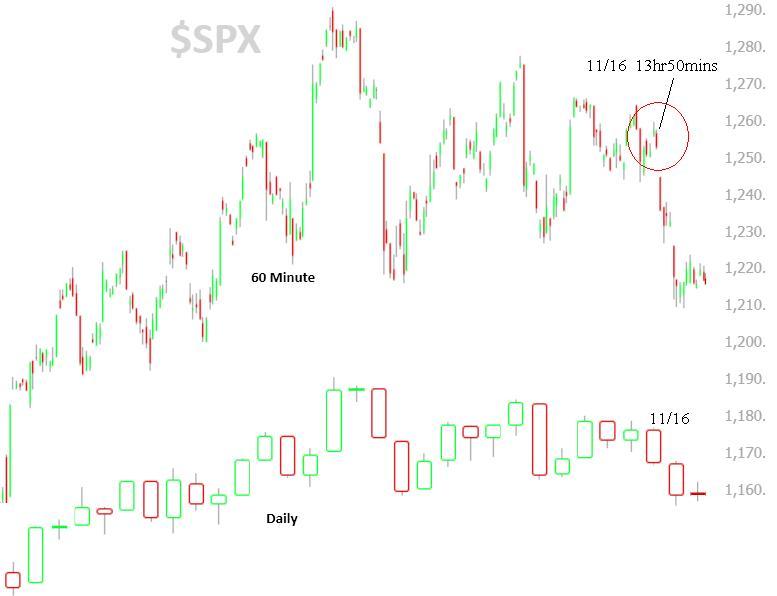
Island reversal
The gap down forms an island reversal, one was observed in between 10/26 & 10/27. This morning we got another one. From prior post, I expect a low around 1120, since index moved higher than what I speculated (1293 vs 1228), a tentative guess is 1138 +/-, will do the fine tuning. priority are: (1) direction, (2) time stamp, and (3) level. step by step. got an error try new recipe; This web site can not upload chart from Hard disk directly, no time to post somewhere and link it back, sorry. I talk too much already, log off for a few days.
window ends on 11/08
The following chart was posted on 10/08, it correctly nailed the index direction, but failed to get correct level, the index was way to bullish.
Chart said that there are 64 trading days wide time window with a major low in the middle, index passed the first check point on 10/25 and marked a peak at 10/27, within the +/- margin, therefore, in an 'ideal' case, index 'should' see a low on 11/08 +/-. I will let market do the job, she is the true master. cycle just a tool based on already passed trails to anticipated a suppose-to-be profile, this process is no difference with the classic pattern recongnition; as mentioned in prior post that near the 11/15-11/16 time cluster we 'suppose' to see some violent actions, only time will tell. The level is the game of the Fibonacci, will do fine tuning as time approaches.
at this writing, index retraced more than 0.3 (1.5/5 = 0.3, at 1226), cut through 1240 and breached 1219, the chance to see the second important support 1208 is getting higher, the only wildcard is MR. Bernake, He might push index below 1200 as recently once he opened mouth, index stumbled.

Near term outlook
since I am new here, I will just put outlooks (on a irregular basis) here for some period of time. afterwards, slowly, I will put entry/exit level & time window. I know most of the readers will take care their buy/sell plan by themselves, just a precaution that the information I post here is for your entertainment only, in addition, I am trying to keep my brain cell active so I may defer the Alzheimer's disease
-------------------------
05/02/11 1370.58
07/01/11 1010.91
10/27/11 1292.66
Last Thursday the Index took the advantage of the 'Gap-UP' technology, gapped over the strong resistance 1258-1268, breached the 0.5 retracement in between 1371 & 1011. 0.618 @1233. The wave resistance & 0.786 resistance lies at 1300 & 1307 respectively; The important supports are 1241 & 1208.
We have FOMC meeting on November 1-2, let's see what kind shenanigan Bernanke will deliver.
Market Turning Points
By: Andre Gratian | Sun, Oct 30, 2011
http://www.safehaven.com/article/23127/market-turning-points
In summary:
my proprietary time speculator suggests 11/15 will be low, 11/16 will be high, 12/20 is a low, 12/27 is a high. Volatile session may present due to the high/low date conflict, especially in November. the dates may become immaterial, one of it may transpire eventually, I don't know, who else knows for sure.
event windows +/-
High
11/16/11
11/30/11
12/13/11
12/27/11
Low
11/15/11
12/20/11
Since I have made my summary, so the following long quote is considered "fair of use" for 'academic study and comparsion'; I break Bill’s long paragraph into logical small section, as usual, his writing contains ambiguity. Not a coincidence, my time speculator does match the outlook Bill perceived
MMA Weekly Comments for the Week Beginning October 31, 2011
Written by Raymond Merriman
Review and Preview
http://www.mmacycles.com/weekly-preview/mma-comments-for-the-week/mma-weekly-comments-for-the-week-beginning-october-31,-2011/
"Yet there are reasons based on Financial Astrology that suggest prices will go higher before taking out those lows of three weeks ago. Geocentric Mercury and Venus start their multi-week treks through the land of Zeus (Sagittarius) on November 2. And Jupiter is still within the 0-7° sector of Taurus, the region which we have continually identified in this column as coinciding with long-term stock market peaks, as shown by studies going back to the 1870’s. That sector is highlighted from October 7, 2011 through March 7, 2012. We expect another long-term cycle high then, just as we observed (and forecasted as long ago as November 2010) for May 2-July 22, 2011, which still stands as the three-year high in U.S. stocks.
But that is being challenged now as Jupiter returns to early Taurus, just as we said it would. When will this crest finally be attained? Well, my guess is that we have to get closer to the point when Jupiter turns stationary direct at 0° Taurus, which takes place December 25, 2011.
Still, this is Halloween and a geocosmic critical reversal zone and prices have had a great Jupiterian lift for the past three weeks, so I don’t expect the market to go straight up into the holiday season. We may just be at the top of another peak on this roller coaster ride, readying for the next dizzying dive down before another peak that follows.
It is, after all, the season of tricks and treats. The last three weeks have been the treats. But here comes another trick."
slinky - it is May 26 2012
You are right, again the 108 trading day cycle/20week cycle is not the primary one, at this moment I don't March 12 would be a high a low, but soon we will find out.
some more reference material:
--------------------------------------------------
voltaire 10/27/2011, 07:18 PM
http://www.traders-talk.com/mb2/index.php?showtopic=135440&st=0&p=601010&#entry601010
'While most view Armstrong's 8.6 year cycle as having fixed dates, I prefer using the cycle from major lows, as does Armstrong himself by the way. And I have discussed it with him.
From the 2009 bear low, the first Armstrong leg up was EXACTLY the high on May 2 2011.
The next leg is down and should make a low on May 26 2012'
----------------------------------------------------
03/12/12 & 05/26/12 matches with Bradley siderograph closely
http://www.robertew.com/invest/html/bradley.shtml
(not familiar with the html format here)
'The tower has only one peak, there are many ways getting there.'
When there is an ambiguity in one specific method, one just look an alternative. The 108 trading day cycle is an observed cycle, its root comes from 100 * PI/3 = 105.
10/04 low is clearly the result of 108 trading day cycle.
108 trading days cycle is a medium rage time frame cycle. this cycle comes & goes, not a easy one to catch. The relationship with the famous Martin Armstrong (Economic Confidence Model) 8.6 year business cycle is clear: since each year has an averaged 251 trading days, 8.6 year has 251 * 8.6 + 2 (leap year adjustmnet) = 2160.6 trading days, = 20 * 108 ( off 0.6 trading day).

form 07/01/2010 to 10/04/2011, it is a 15.2 months cycle. Bill has a number of 15.5.
MMA Comments for the Week Beginning October 3, 2011
Written by Raymond Merriman
http://www.mmacycles.com/weekly-preview/mma-comments-for-the-week/mma-comments-for-the-week-beginning-october-3,-2011/
I know the news of late sounds very depressing, and we have to try hard to find reasons for hope . But the news is always depressing and disturbing when longer-term cycle lows are forming. This time is no exception. A long-term cycle low, known as the 15.5-month cycle bottom, is due within three months of October 2011. And like all long-term cycles, once that low is in, a 2-5 month rally is likely to commence.

