The counter trend rally off the 667 marked an end on 1371 chart was posted on 06/27/2010 (Time stamp & ID monthly_06_2010/post-5846-1277686575)
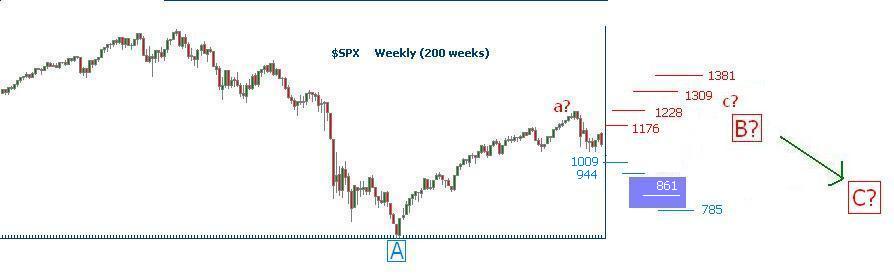
Outlook for an ideal case: the wave will deploy a wave series in the structure of A-B-C, 5x3x5. If wave ‘C’ deploys the same wave length as wave ‘A’, then, wave ‘C’ will reach 462 (= 1371 – (1576-667)). It is about the averaged number back to year 1993-1994. Time length for the C wave could be 528,591,704 trading days. refer to the chart. Be cautious, the fact that wave ‘B’ roughly retraced 0.786 (actual 0.774, 0.786@1381) of wave ‘A’ suggests 5x3x5 might not fit, and there are different forms to deploy. A 528 trading day from 05/02/2011 ( the day index marked an intraday high 1371) is around June/July 2013.
wave B time length 543, 1.54 (ideal 1.50) of wave A
Here is another reference: Title: Prepare for the Global Long Wave Extinction Event By: David Knox Barker | Saturday, August 20, 2011 http://www.safehaven.com/print/22240/prepare-for-the-global-long-wave-extinction-event ...... The next target in the long wave degrees of freedom radar is 7/28/2013 ....... The final phase of the global long wave collapse will radically change the global financial and political system forever. It will be change for the better. The worst years of this long wave winter season, which lie directly ahead, will provide the impetus and opportunity for global change on a scale heretofore unimagined.
What to do: Build inverse ETF progressively when index ascend abot 1250, the depth is 100 point to the upper rail 1350.
Register for free to join our community of investors and share your ideas. You will also get access to streaming quotes, interactive charts, trades, portfolio, live options flow and more tools.
 News
News  Market Data
  Discover