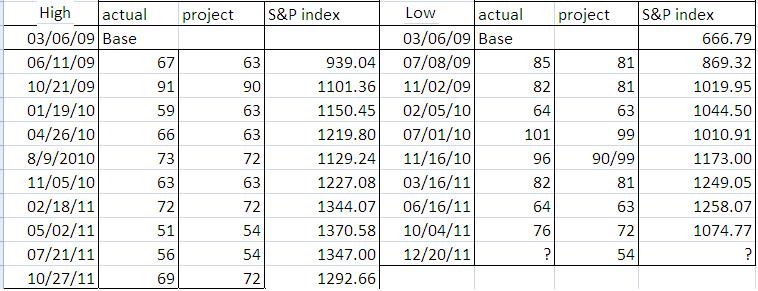
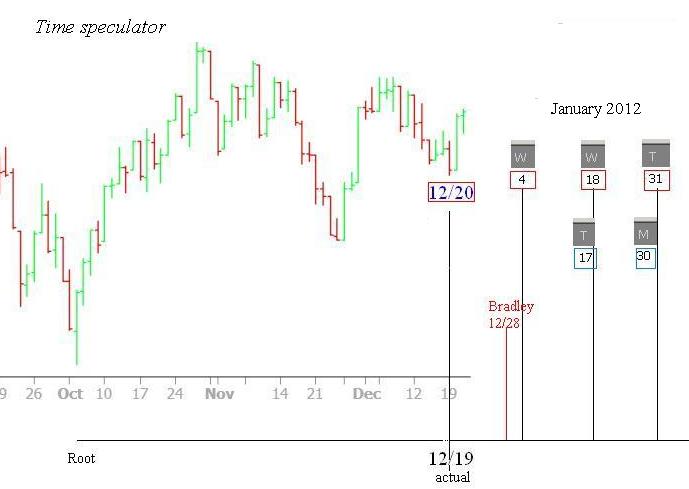
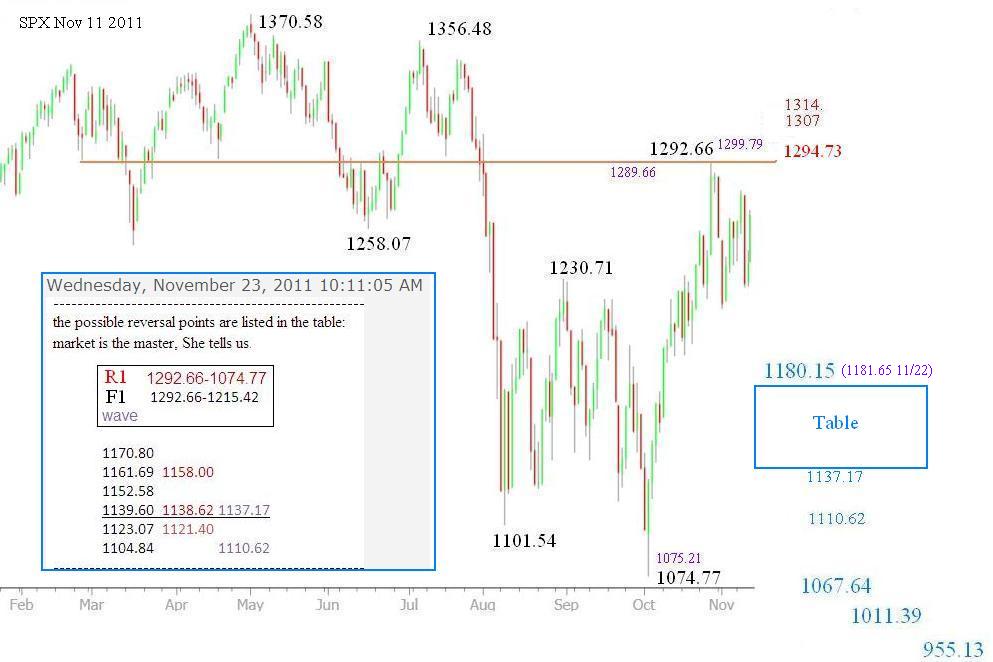
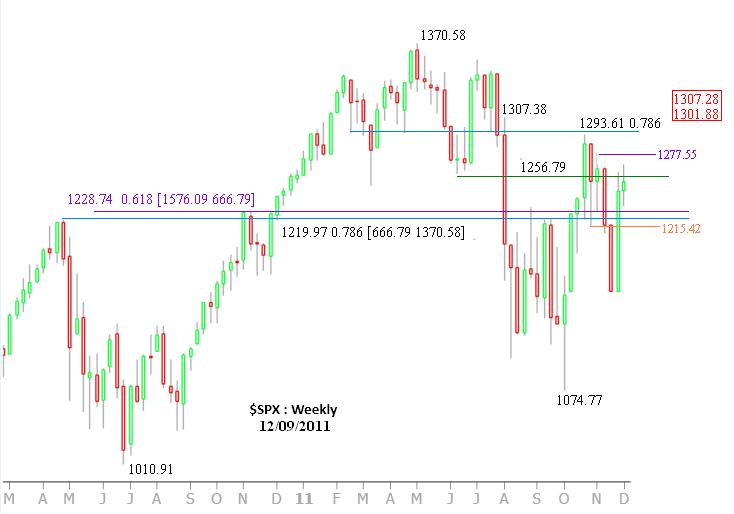
The King Wen's sequence suggested 12/20 could be a low, the atual date was 12/19. This time speculator is not an aggressive one, the rest of the possible low dates are 01/04, 01/18, 01/31. However, it also seuggests the high dates 01/17, 01/30. This kind conflict has been found in my June 05 report. (see the bottom table), We all knew the rest of the story. S&P500 index drove below 1294 on 07/29, & started a down wave, finally it cratered on 10/04 at 1074.77. On Oct 27, index re-tested the important Fibonacci point 1294, it marked 1,292.66 then reversed. Put all together, the middle March is a very important time zone to watch.
note: this time speculator has no visibility on short term cycles, i.e, < 54 trading days. December 19 just in the margin. & has no hint the low has passed. The complete King Wen's sequence are: (81,126,63,108,90,99,54,117,72)
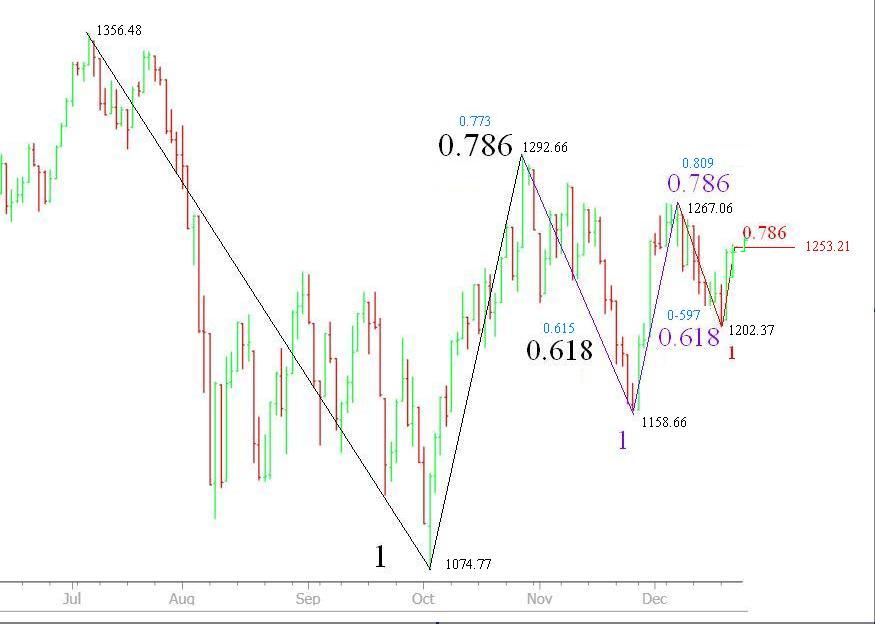
Market deployed the beatuy of the Fibonacci ratios; At the end of movement, the retracements is getting bigger, i.e, > 0.786. It signals the erratic action is drawing an conclusion. Lady Market loves teasing the speculators, perhaps she will deploy twin peaks either at 1267.06, 1277.55, or 1292.66, you pick it
A new table will be inserted for the gap in between 1070-1000, it is premature to do so.
Register for free to join our community of investors and share your ideas. You will also get access to streaming quotes, interactive charts, trades, portfolio, live options flow and more tools.
 News
News  Market Data
  Discover