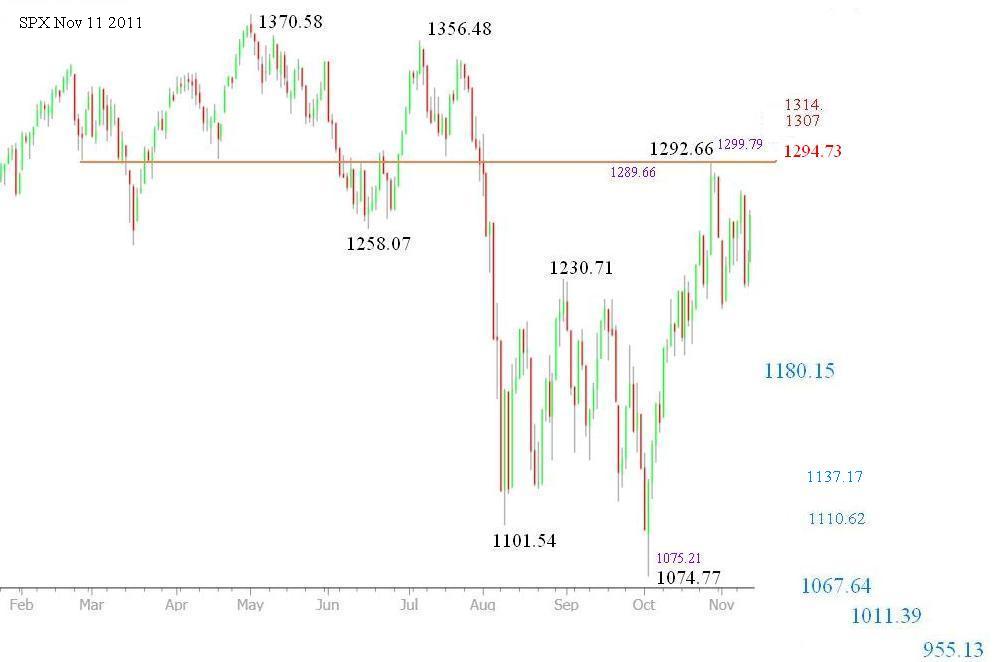
The significance of 1294 can be explained by the following chart ------------------------------------------------------------------ Posted on 31 July 2011 - 12:01 AM S&P500 index dipped below 1294 on 07/29, it closed at 1292.28 (1292 is 0.809 out of 1440 & 667), a point slightly below the critical point 1294. The aberration is within the margin; The intraday low 1282.86 ( 1282.14 is 0.786 out of 1370.58 & 1258.07) gives a slightly negative bias. In overall, index is in the weak “Lagrangian points” that can move in either direction quickly.
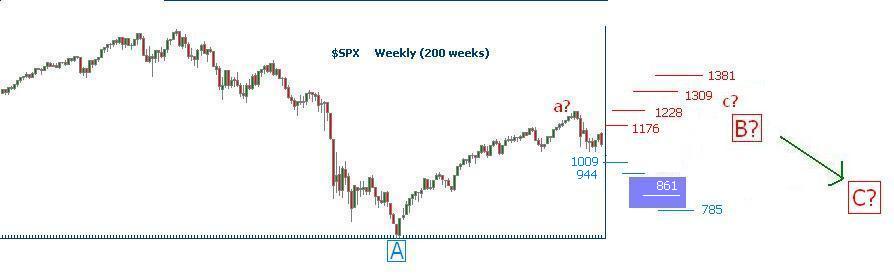
for 'near term' (loosely defined semantics), let me post three charts: Fibonacci retracements/extensions projection usually comes out multiple possible targets. chart 2 naild the low 1074.77 closer enough; chart 1 just a few days old; When index dives below 1176, the downward fulsh will start. refer to chart 3.
Register for free to join our community of investors and share your ideas. You will also get access to streaming quotes, interactive charts, trades, portfolio, live options flow and more tools.
 News
News  Market Data
  Discover