 News
News  Market Data
  Discover
Support: 888-992-3836
Copyright © 2023 InvestorsHub Inc.


Register for free to join our community of investors and share your ideas. You will also get access to streaming quotes, interactive charts, trades, portfolio, live options flow and more tools.
S&P 500: Seasonality is a tailwind, as April has been historically a strong month for US stocks in the fourth year of the US presidential cycle
By: Isabelnet | March 27, 2024
• S&P 500
Seasonality is a tailwind, as April has been historically a strong month for US stocks in the fourth year of the US presidential cycle.

Read Full Story »»»
 DiscoverGold
Market Historically Strong Ahead of Good Friday
By: Almanac Trader | March 27, 2024

Good Friday is the one NYSE holiday with a clear positive bias before and negativity the day after (Stock Trader’s Almanac 2024, page 100). DJIA, S&P 500, NASDAQ, and Russell 2000 all have solid average gains on the three days and full week (shortened) before Good Friday. NASDAQ has been notably strong, up 21 of the last 23 days before Good Friday with an average gain of 0.79%. NASDAQ declines occurred in 2017 (–0.53%) and 2022 (–2.14%).
However, the day after Easter has a weak longer-term post-holiday record. The S&P 500 was down 16 of 20 years from 1984-2003 on the day after Easter while it has been up 13 of the last 20 years. Post-Easter weakness has been generally short-lived with solid average gains 2- and 3-days after.
Read Full Story »»»
DiscoverGold
SPX 5-year Analog Analysis
By: Nautilus Research | March 27, 2024
• #spx $spx Some folks requested an update on some of our analogs - here's the 5-year one .... hmm.....
Overview: The Nautilus Analogs function is pattern recognition in its purest form. With its proprietary algorithm, Nautilus identifies predictive patterns in current price action by systematically comparing them to historical periods that led to exceptional returns (statistically significant from random patterns).

Read Full Story »»»
DiscoverGold
S&P 500 Has Only Done This 14 Times Since 1950
By: Schaeffer's Investment Research | March 27, 2024
• Diving into SPX performance after a run of bullish newsletters
• A good short-term buying opportunity could be ahead
The percentage of bullish newsletters from the Investor Intelligence (II) poll was above 60% in the latest report. This is the first reading above 60% since July 2021, and it's an extreme one -- registering in the 95th percentile for percentage of bulls dating back to 1971.
The tables below compare how the S&P 500 Index (SPX) has performed after newsletters are extremely bullish or bearish. The poll has been a reliable long-term contrarian indicator. When bulls are extremely high, the SPX averages a 6.8% return over the next 12 months, with 68% of the returns positive. When there’s a dearth of bullish newsletters, the index averages a return of 14%, with 80% of the readings positive.
PRIOR INSTANCES
The last time the SPX closed more than 3% away from its all-time high was in mid-December. Since 1950, there have been 14 prior streaks like that. The table below summarizes the index returns after these streaks. The second table is a benchmark showing typical returns since 1959, the year of the first signal.
Based on these figures, the next three months could be a slog. The SPX averaged a loss of 1.85% over the next three months after these streaks, with just half of the returns positive. Typically, you would expect a 2% gain, with a 66% chance of being positive. On the bright side, the underperformance hasn’t lasted much more than three months. The six and 12-month returns are close to the typical market returns.

The table below lists the dates of the 70-day streaks where the SPX did not close more than 3% below its all-time high. There's nothing I see that is particularly unique about the current streak. The Cboe Market Volatility Index (VIX) reading of just over 13 and a 12% return looks in line with most of the other data points.
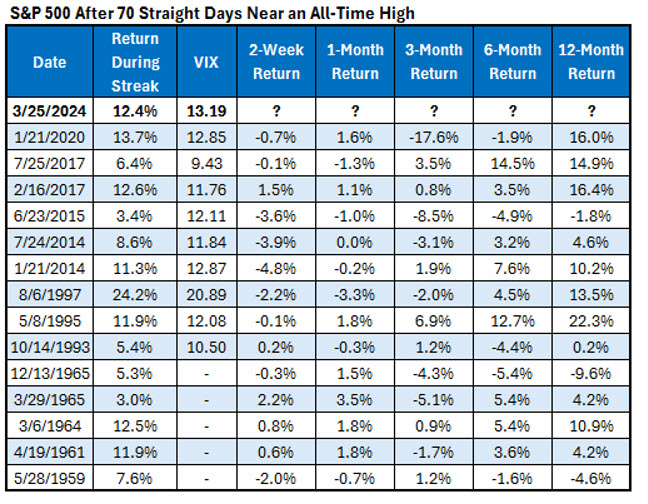
Finally, this last table shows how the SPX performed after the streak ended. For reference, these streaks ended after an average of 113 trading days (43 more trading days, or about two months) and with a median of 92 days (22 more trading days, or about a month).
The summary is interesting in that once the streak ends, it has made for a good short-term buying opportunity, with the index gaining 1.75% on average over the next month, with 71% of the returns positive. A couple of big pullbacks in the data at that point lead to an average three-month return that’s below breakeven. Again, the longer-term six and 12-month returns seem unaffected by these streaks.

Read Full Story »»»
DiscoverGold
$SPX Millions worth of mixed flow again today
By: Cheddar Flow | March 27, 2024
• $SPX Millions worth of mixed flow again today

Read Full Story »»»
DiscoverGold
The 10 Top/Bottom S&P 500 Index percent net change performers
By: Thom Hartle | March 27, 2024
• Today (8:37 CST), the 10 top/bottom percent net change performers in the S&P 500 Index.

Read Full Story »»»
DiscoverGold
AI-generated Buy and Sell Daily Signals
By: Hedgeye | March 27, 2024
NEW SIGNALS TODAY:
• Sell: NVDA
• Buy: N/A
• Close Buy: XLP
• Close Sell: Apple, Japan

Read Full Story »»»
DiscoverGold
Surprise Negative Divergence on Nasdaq Advance-Decline Line
By: Erin Swenlin | March 26, 2024
We were perusing the Advance-Decline Line charts that we have and noticed something that surprised us. The Nasdaq Advance-Decline Line is trending lower while prices continue higher. This is negative divergence we didn't expect to see.
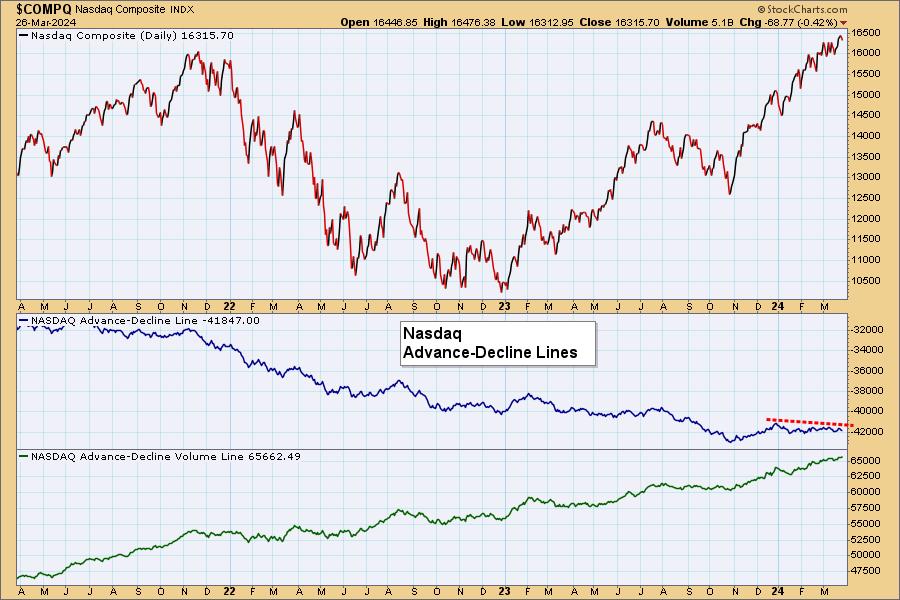
What makes that negative divergence even more interesting is looking at the same Advance-Decline Lines for the SPX and NYSE. Notice there is no negative divergence at all, if anything we see confirmations of the rallies both are experiencing.


Conclusion: We haven't seen any issues with the Nasdaq rally, but this negative divergence could be signaling that the Nasdaq will be the first to show price weakness.
Read Full Story »»»
DiscoverGold
5-Month Streak Looks Like A Secular Bull Market
By: Almanac Trader | March 26, 2024

Not only is it bullish for April and the rest of the year. When November, December, January, February and March are up stocks have been in a secular bull market that extended to at least the next year.
Note a touch of weakness in Q2-Q3 in the Worst Six Months and some huge Q4 rallies. Last 9 months of the year up all 11 times, average gain 11.9%,
Read Full Story »»»
DiscoverGold
$SPX Mixed flow today. It can't seem to choose a direction, despite all of these high premium orders
By: Cheddar Flow | March 26, 2024
• $SPX Mixed flow today
It can't seem to choose a direction, despite all of these high premium orders


Read Full Story »»»
DiscoverGold
Since 1950, when the S&P 500 index has been higher in November, December, January, February, and March, the rest of the year has been higher 100% of the time, with an average gain of 11.9%
By: Isabelnet | March 26, 2024
• S&P 500
Since 1950, when the S&P 500 index has been higher in November, December, January, February, and March, the rest of the year has been higher 100% of the time, with an average gain of 11.9%.

Read Full Story »»»
DiscoverGold
S&P 500: With a reading of 94.74, it is evident that the US stock market is significantly overbought, causing concern among investors who foresee a potential correction in the near future
By: Isabelnet | March 26, 2024
• S&P 500
With a reading of 94.74, it is evident that the US stock market is significantly overbought, causing concern among investors who foresee a potential correction in the near future.

Read Full Story »»»
DiscoverGold
$SPY $494 Million Singular Dark Pool Print (Unusual)
By: Cheddar Flow | March 26, 2024
• $SPY $494M Singular Dark Pool Print (Unusual).

Read Full Story »»»
DiscoverGold
The 10 Top/Bottom NASDAQ 100 Index percent net change performers
By: Thom Hartle | March 26, 2024
• Today (8:34 CST), the 10 top/bottom percent net change performers in the NASDAQ 100 Index.

Read Full Story »»»
DiscoverGold
Markets Monthly Pattern »» Watchlist - Top 10
By: Marty Armstrong | March 26, 2024
• Dow Jones Industrials Index »» Temp High
• NASDAQ Composite Index »» Still Pressing Higher
• NASDAQ 100 Index »» Moving Higher
• S&P 500 Index »» Moving Higher
• Russell 2000 Index »» Pushing Higher
• US Dollar Index »» Knee Jerk Low
• CBOE VIX Index »» Turning to DOWNSIDE
• NY Gold Futures »» Entering Breakout Mode
• NY Silver COMEX Futures »» New Pattern Forming
• NY Crude Oil Futures »» New Highs Still Possible
DiscoverGold
AI-generated Buy and Sell Daily Signals
By: Hedgeye | March 26, 2024
• This is free access to our brand-new AI-generated buy and sell signals.

Read Full Story »»»
DiscoverGold
VIX Signal Helps Build Bullish Case
By: Schaeffer's Investment Research | March 25, 2024
• Until a technical breakdown occurs, the SPX will only encounter minor hesitation points
• Momentum could slow if the SPX breaks the 5,145-5,170 channel this week
“…there has not been a short-term technical breakdown in the SPX, which is still above the 5,000-millenium level as well as its 30-day moving average… The 30-day trendline is currently sitting at 5,060 and is projected to be at around the 5,100-century mark this time next week… .Last week, the VIX again flirted with the 15.40 level, which is half its 2023 high achieved just over one year ago. As of Friday’s close, the VIX is not signaling major weakness, but there are sentiment indicators such as those Senior Market Strategist Matthew Timpane mentioned last week that point to a heightened pullback risk... These sentiment indicators are noteworthy, but will carry more weight and meaning if the SPX breaks below support levels”
-Monday Morning Outlook, March 18, 2024
On the heels of stocks trading higher again last week and the S&P 500 Index (SPX —5,234.18) notching another all-time high, I am highlighting the importance of giving more weight to sentiment indicators when they are conflicting with price action, and less when sentiment is in line with price action.
So while many sentiment indicators we track showed optimism creeping into the market -- a necessary ingredient that foreshadows weakness -- it is not a sufficient condition for the onset of notable market weakness.
In other words, there must be a defined technical breakdown that suggests latecomers to the rally are feeling pain and therefore at risk of selling. As more and more latecomers to the party feel that pain, selling power eventually overcomes buying power and a short-term correction and/or a longer, sustained period of selling materializes.
Ahead of the scheduled Federal Open Market Committee (FOMC) meeting last week, neither the SPX nor the Cboe Market Volatility Index (VIX —13.63) indicated that sentiment risks were worth acting on, unless one wanted to hedge FOMC uncertainty with portfolio insurance being cheap relative to what it might cost in the event of a major negative surprise from the Fed.
“110 points above the SPX close on Friday is the 5,247 level, which is a round 10% above the 2023 close. As such, this might be considered the next big level of potential resistance.”
-Monday Morning Outlook, March 4, 2024
So where are we now, beyond the obvious all-time high? Per the chart below, the SPX is at a potential hesitation or pivot level. Due to the momentum, I’m more inclined to call this a potential hesitation point until I see evidence that the momentum off the late-October low is hinting at running out of steam, which I don’t see at this moment.
But it is no surprise, per an observation I made earlier this month, that the 5,250 area is where the SPX struggled late last week. My observation about the potential importance of this level hinged on the idea that anyone anchoring to the 2023 close may be tempted to take profits with the index exactly 10% above last year’s close, especially with the first quarter about to end.
Moreover, note in the chart below that as the SPX approached 5,250, the top rail of a channel in place since late last year and early this year came into play. The good news for bulls, if investors anchoring to the 2023 close are no longer relevant, is that the top rail of the channel moves higher with each passing day. At the end of this shortened trading week, the top rail of the SPX channel will be just above the round 5,300-century mark.

Anything can happen any given day or week with respect to equity and index price action. So with the potential resistance topic covered, what are the potential support levels as we head into the last week of trading in the first quarter of 2024?
The first level of support is the bottom rail of the channel, which comes into the week at 5,145 and ends at 5,170. A break of this channel would hint at a loss of momentum. But I see the 30-day moving average, which marked a mid-January low, as having importance too, even if there is a channel break. The 30-day moving average enters the week at 5,100 and is projected to be around 5,130-5,135 at week’s end.
“More importantly for investors, however, is how stocks have reacted to what might be viewed as bad news regarding investors factoring in numerous rate cuts in 2024 to changing their expectations of a much slower path to lower rates… It suggests to me that investors are placing more weight on the prospects for continued economic growth without the help of the Fed, even though the central bank continues to steal headlines. In fact, what is the appropriate level of the fed funds rate and what is perceived to be the appropriate level may well be two different animals.”
-Monday Morning Outlook, February 26, 2024
A potentially bullish signal for equities, after the VIX failed to overtake the important 15.40 level the week prior, is the VIX’s break below a trendline connecting higher lows since December. In past commentaries, I noted the SPX went sideways when the VIX retreated to this trendline and advanced higher for a short period. Now, we are moving into a period of potentially even lower volatility, which could have bullish implications for equities in the near term, if the VIX works its way down to at least the December 2023 low.

Beyond important levels, I have a general observation that is worth pondering again after circling back to an observation made in late February, as excerpted above.
The reason why stocks rallied last week was that the Fed continued to project three rate cuts by year’s end. Keep in mind, however, that in the one month leading into last week’s FOMC meeting and following a string of hotter-than-expected inflation data, Fed funds futures traders reduced the odds of the first rate cut occurring in June from 78% to 64%.
Despite the increased probability of rates being higher for longer, the SPX rallied 4% during that period. This is again relevant because it reinforces that investors are placing more weight on growth, and less weight on the need for a rate cut.
Read Full Story »»»
DiscoverGold
Wall Street's Price Targets for the S&P 500 $SPX
By: Barchart | March 25, 2024
• Wall Street's Price Targets for the S&P 500 $SPX.

Read Full Story »»»
DiscoverGold
The 10 Top/Bottom S&P 500 Index percent net change performers
By: Thom Hartle | March 25, 2024
• Today (8:34 CST), the 10 top/bottom percent net change performers in the S&P 500 Index.

Read Full Story »»»
DiscoverGold
The 10 Top/Bottom NASDAQ 100 Index percent net change performers
By: Thom Hartle | March 25, 2024
• Today (8:34 CST), the 10 top/bottom percent net change performers in the NASDAQ 100 Index.

Read Full Story »»»
DiscoverGold
AI-generated Buy and Sell Daily Signals
By: Hedgeye | March 25, 2024
• This is free access to our brand-new AI-generated buy and sell signals.

Read Full Story »»»
DiscoverGold
The Market Greed/Fear Index stands at 86.28, indicating an extreme level of greed in the US stock market, which could potentially lead to overconfidence and poor decision-making
By: Isabelnet | March 25, 2024
• Sentiment
The Market Greed/Fear Index stands at 86.28, indicating an extreme level of greed in the US stock market, which could potentially lead to overconfidence and poor decision-making.

Read Full Story »»»
DiscoverGold
A 25% or more increase in the S&P 500 in 21 weeks (using the first signal in a cluster) suggests a bullish outlook over the next 12 months, with an average gain of 21.5% since 1950
By: Isabelnet | March 25, 2024
• S&P 500
A 25% or more increase in the S&P 500 in 21 weeks (using the first signal in a cluster) suggests a bullish outlook over the next 12 months, with an average gain of 21.5% since 1950.

Read Full Story »»»
DiscoverGold
Good news for the $QQQ bulls: This upcoming week has the single highest win rate over the last two decades -- green 78% of the time
By: TrendSpider | March 23, 2024
• Good news for the $QQQ bulls:
This upcoming week has the single highest win rate over the last two decades -- green 78% of the time.

Read Full Story »»»
DiscoverGold
118 new 52-week highs for the S&P 500 (using first signal in 6 months) suggest a bullish outlook over the next 12 months, with an average gain of 12% since 1950
By: Isabelnet | March 23, 2024
• S&P 500
118 new 52-week highs for the S&P 500 (using first signal in 6 months) suggest a bullish outlook over the next 12 months, with an average gain of 12% since 1950.

Read Full Story »»»
DiscoverGold
CoT: Peek Into Future Through Futures, How Hedge Funds Are Positioned
By: Hedgopia | March 23, 2024
• Following futures positions of non-commercials are as of March 19, 2024.
E-mini S&P 500: Currently net short 194.2k, down 45.7k.

Yet again, equity bears failed to cash in on an opening the markets offered them. Leading up to this week’s FOMC meeting and after a rip-roaring rally from last October’s low, the S&P 500 suffered marginal weekly declines back-to-back, forming candles with long upper shadows (more on this here).
Undeterred, bulls this week began the first two sessions with decent gains, which got further amplified post-FOMC – on Wednesday and Thursday. For the week, the large cap index added 2.3 percent to 5234 – 17th up week in 21. From last October’s low through Thursday’s fresh high of 5261, it surged 28.2 percent!
Overbought, yes, but the upside momentum is yet to decisively break. A rising trend line from last October has been defended. For several sessions before Wednesday’s mini-breakout, bulls struggled at 5170s, which is now the one to watch if it holds.
Nasdaq (mini): Currently net long 11.2k, up 9.8k.

The Nasdaq 100 jumped three percent to 18339 this week, rallying back above a rising trend line from last October’s low, albeit only marginally. Last week, the trendline was slightly breached.
That said, the tech-heavy index has essentially gone sideways this month, having printed 18333 on the 1st. A new intraday high of 18465 was reached on Thursday but the session acted tentative, to say the least.
At 17719 lies the 50-day, coinciding with the daily lower Bollinger band at 17758. This is a must-save for the bulls.
Russell 2000 mini-index: Currently net short 13.5k, down 5.6k.

It was one of those weeks! The Russell 2000 had something to offer for both bulls and bears. The small cap index rallied 1.6 percent to 2072 but also got rejected – once again – at 2100.
On the 8th, a two-year high of 2116 completed a measured-move target of a 1700-1900 range breakout on December 13th. To boot, horizontal resistance at 2100 goes back to January 2021. This ceiling was tested again this week, with Thursday tagging 2106 and retreating.
For small-cap bulls’ consolation, 2000 continued to attract bids, as the index touched 2010 on Tuesday. Until this 100-point back-and-forth resolves one way or the other, range traders will have a field day. A likely breach ahead opens the door toward a breakout retest at 1900.
US Dollar Index: Currently net long 679, down 5.5k.

A golden cross, in which the 50-day crosses the 200-day from below, formed this week. If the pattern lives up to its expectations, better days lie ahead for the dollar.
The US Dollar Index this week jumped 1.1 percent to 104.18. Resistance at 103-104 goes back to December 2016.
For now, dollar bulls are probably eyeing the February 14th high of 104.88. Momentum is with them. Since defending lateral support at 1.0230s on the 8th, the index has rallied in eight of 10 sessions.
VIX: Currently net short 44.8k, down 4.3k.

Rather ominously for volatility bulls, a rising trend line from December 12th when VIX bottomed at 11.81 was compromised this week. Concurrently, on both Thursday and Friday, the volatility index produced potentially bullish hammers, which showed up right at/just underneath the daily lower Bollinger band. Thursday’s intraday low of 12.40 was the lowest since early January.
These are mixed signals. As things stand, it is hard to imagine VIX persisting lower. Last December, the index touched 11.80s for three sessions in a row before gradually trending higher.
Read Full Story »»»
DiscoverGold
S&P 500 Index (SPX) »» Weekly Summary Analysis
By: Marty Armstrong | March 23, 2024
S&P 500 Cash Index closed today at 523418 and is trading up about 9.73% for the year from last year's settlement of 476983. Immediately, this market has been rising for 4 months going into March suggesting that this has been a bull market trend on the monthly time level which has been confirmed by electing all of our model's long-term Bullish Reversals from the key low. As we stand right now, this market has made a new high exceeding the previous month's high reaching thus far 526110 while it has not broken last month's low so far of 485352. Nevertheless, this market is still trading above last month's high of 511106.
ECONOMIC CONFIDENCE MODEL CORRELATION
Here in S&P 500 Cash Index, we do find that this particular market has correlated with our Economic Confidence Model in the past. The Last turning point on the ECM cycle low to line up with this market was 2009 and 2002. The Last turning point on the ECM cycle high to line up with this market was 2022 and 2007 and 2000.
MARKET OVERVIEW
NEAR-TERM OUTLOOK
The S&P 500 Cash Index has continued to make new historical highs over the course of the rally from 1974 moving into 2024. We have elected two Bullish Reversals to date.
This market remains in a positive position on the weekly to yearly levels of our indicating models. Pay attention to the Monthly level for any serious change in long-term trend ahead.
Looking at the indicating ranges on the Daily level in the S&P 500 Cash Index, this market remains in a bullish position at this time with the underlying support beginning at 517987.
On the weekly level, the last important high was established the week of March 18th at 526110, which was up 21 weeks from the low made back during the week of October 23rd. So far, this week is trading within last week's range of 526110 to 513159. Nevertheless, the market is still trading upward more toward resistance than support. A closing beneath last week's low would be a technical signal for a correction to retest support.
When we look deeply into the underlying tone of this immediate market, This market has made a new historical high this past week reaching 526110. Here the market is trading positive gravitating more toward resistance than support. We have technical support lying at 515635 which we are still currently trading above for now.
Right now, the market is above momentum on our weekly models hinting this is still bullish for now as well as trend, long-term trend. Looking at this from a wider perspective, this market has been trading up for the past 11 weeks overall.
INTERMEDIATE-TERM OUTLOOK
YEARLY MOMENTUM MODEL INDICATOR
Our Momentum Models are rising at this time with the previous low made 2022 while the last high formed on 2023. However, this market has rallied in price with the last cyclical high formed on 2022 warning that this market remains strong at this time on a correlation perspective as it has moved higher with the Momentum Model.
Interestingly, the S&P 500 Cash Index has been in a bullish phase for the past 11 months since the low established back in March 2023.
Critical support still underlies this market at 417150 and a break of that level on a monthly closing basis would warn that a sustainable decline ahead becomes possible. Nevertheless, the market is trading above last month's high showing some strength.
DiscoverGold
Nasdaq Composite Index (COMP) »» Weekly Summary Analysis
By: Marty Armstrong | March 23, 2024
NASDAQ Composite Index Cash closed today at 1642882 and is trading up about 9.44% for the year from last year's settlement of 1501135. Currently, this market has been rising for 4 months going into March suggesting that this has been a bull market trend on the monthly time level which has been confirmed by electing all of our model's long-term Bullish Reversals from the key low. As we stand right now, this market has made a new high exceeding the previous month's high reaching thus far 1653886 while it has not broken last month's low so far of 1520888. Nevertheless, this market is still trading above last month's high of 1613422.
ECONOMIC CONFIDENCE MODEL CORRELATION
Here in NASDAQ Composite Index Cash, we do find that this particular market has correlated with our Economic Confidence Model in the past. The Last turning point on the ECM cycle low to line up with this market was 2022 and 2009 and 2002. The Last turning point on the ECM cycle high to line up with this market was 2007 and 2000.
MARKET OVERVIEW
NEAR-TERM OUTLOOK
The NASDAQ Composite Index Cash has continued to make new historical highs over the course of the rally from 2009 moving into 2024. Prominently, we have elected four Bullish Reversals to date.
This market remains in a positive position on the weekly to yearly levels of our indicating models. Pay attention to the Monthly level for any serious change in long-term trend ahead.
Focusing on our perspective using the indicating ranges on the Daily level in the NASDAQ Composite Index Cash, this market remains in a bullish position at this time with the underlying support beginning at 1627545.
On the weekly level, the last important high was established the week of March 18th at 1653886, which was up 21 weeks from the low made back during the week of October 23rd. So far, this week is trading within last week's range of 1653886 to 1595186. Nevertheless, the market is still trading upward more toward resistance than support. A closing beneath last week's low would be a technical signal for a correction to retest support.
When we look deeply into the underlying tone of this immediate market, we see it is currently still in a weak posture. This market has made a new historical high this past week reaching 1653886. Here the market is trading positive gravitating more toward resistance than support. We have technical support lying at 1596090 which we are still currently trading above for now.
Right now, the market is above momentum on our weekly models hinting this is still bullish for now as well as trend, long-term trend. Looking at this from a wider perspective, this market has been trading up for the past 11 weeks overall.
INTERMEDIATE-TERM OUTLOOK
YEARLY MOMENTUM MODEL INDICATOR
Our Momentum Models are rising at this time with the previous low made 2022 while the last high formed on 2023. However, this market has rallied in price with the last cyclical high formed on 2021 warning that this market remains strong at this time on a correlation perspective as it has moved higher with the Momentum Model.
Interestingly, the NASDAQ Composite Index Cash has been in a bullish phase for the past 11 months since the low established back in March 2023.
Critical support still underlies this market at 1486003 and a break of that level on a monthly closing basis would warn that a sustainable decline ahead becomes possible. Nevertheless, the market is trading above last month's high showing some strength.
DiscoverGold
Markets Monthly Pattern »» Watchlist - Top 10
By: Marty Armstrong | March 23, 2024
• Dow Jones Industrials Index »» Temp High
• NASDAQ Composite Index »» Still Pressing Higher
• NASDAQ 100 Index »» Moving Higher
• S&P 500 Index »» Moving Higher
• Russell 2000 Index »» New Pattern Forming
• US Dollar Index »» Knee Jerk Low
• CBOE VIX Index »» Turning to DOWNSIDE
• NY Gold Futures »» Entering Breakout Mode
• NY Silver COMEX Futures »» New Pattern Forming
• NY Crude Oil Futures »» Moving Higher
DiscoverGold
$SPY Very Unusual $1.2 Million Far OTM Call This has a 540 strike and is above the ask
By: Cheddar Flow | March 22, 2024
• $SPY Very Unusual $1.2M Far OTM Call
This has a 540 strike and is above the ask

Read Full Story »»»
DiscoverGold
$TQQQ $867K Calls
By: Cheddar Flow | March 22, 2024
• $TQQQ

Read Full Story »»»
DiscoverGold
Best Six Months Ends in April
By: Almanac Trader | March 22, 2024

• After 5 months of solid gains, are markets ready for a pause?
Bullish Presidential Cycle Sitting President Pattern flattens out the mid-February to late-March seasonal retreat considerably without 2020 in the average.
April is the final month of the “Best Six Months” for DJIA and the S&P 500. From our Seasonal MACD Buy Signal on October 9, 2023, through (March 21, 2024), DJIA is up 18.4% and S&P 500 is up 20.9%. Fueled by interest rate cut expectations and AI speculation, these gains are approximately double the historical average already and could continue to increase before the “Best Months” come to an end.
This AI-fueled bull market has enjoyed solid gains since last October and will likely continue to push higher in the near-term, but momentum does appear to be waning with the pace of gains slowing. With April and the end of DJIA’s and S&P 500’s “Best Six Months” quickly approaching we are going to begin shifting to a more cautious stance. We maintain our bullish stance for 2024, but that does not preclude the possibility of some weakness during spring and summer.
Read Full Story »»»
DiscoverGold
$SPX: Small speculators in stock indexes have reached their most bullish net position ever
By: SentimenTrader | March 22, 2024
• Small speculators in stock indexes have reached their most bullish net position ever.

Read Full Story »»»
DiscoverGold
$SPX Oh boy... $87.2 Million Calls
By: Cheddar Flow | March 22, 2024
• $SPX Oh boy... Looks who's back

Read Full Story »»»
DiscoverGold
Bullish Tech Flow Coming in Hot
By: Cheddar Flow | March 22, 2024
• Bullish Tech Flow Coming in Hot

Read Full Story »»»
DiscoverGold
The 10 Top/Bottom S&P 500 Index percent net change performers
By: Thom Hartle | March 22, 2024
• Today (8:34 CST), the 10 top/bottom percent net change performers in the S&P 500 Index.

Read Full Story »»»
DiscoverGold
$SPX $NDX 'Abandoned Baby's' at Uppr-BB's on the Daily's?. With 'Hammer' Candle on the $VIX Lwr-BB...
By: Sahara | March 21, 2024
• $SPX $NDX 'Abandoned Baby's' at Uppr-BB's on the Daily's?.
With 'Hammer' Candle on the $VIX Lwr-BB...

Read Full Story »»»
DiscoverGold
AI-generated Buy and Sell Daily Signals
By: Hedgeye | March 22, 2024
• This is free access to our brand-new AI-generated buy and sell signals.

Read Full Story »»»
DiscoverGold
Where Can We Expect the NAS100 to Top?
By: Dr. Arnout Ter Schure | March 21, 2024
• The “last push higher to ~$19K,” which we could not exclude in our last update, is now underway, with an ideal target of $18700+/-100.
Completion Of An Impulse
Unfortunately, we have not been able to provide a public update on the NASDA100 (NDX) since mid-February, see here, while our premium members continued to receive our daily updates. Since then, we have been tracking the Elliott Wave Principle’s (EWP) “green W-5” that we postulated back then:
“Yesterday, the index reached $18K, as forecasted in our last update. Although one last push higher to ~$19K cannot be excluded, the downside risk is at least 15% from current levels.”
Moreover, when we wrote our last update, the NDX was trading at around $17600. Fast forward, and today, it is trading in the $18420s. A ~4.7% gain in five weeks. Thus, it pays to stay informed more often than once a month. We have since updated our understanding of the market’s price pattern and view the index as completing a final (grey) W-v of “the green W-5,” ideally at around $18700+/-100 via what is called in EWP-terms an ending diagonal (ED). See Figure 1 below.

Figure 1. NDX hourly chart with detailed EWP count and technical indicators
The Dreaded Ending Diagonal
In a five-wave ending diagonal, the wave-structure is most often a 3-3-3-3-3 count as all five of the waves of an ending diagonal break down to only three waves each, indicating exhaustion of the larger degree trend. Also, Wave 1 and Wave 4 may overlap with each other. Most ending diagonals have a wedge shape to them where they fit within two converging lines.
The 3rd, 4th, and 5th waves often reach the 123.60%, 50.0-62.8%, and 161.80% Fibonacci extensions of W-1, measured from the W-2 low, respectively. In Figure 1 above, we can see that W-i, ii, iii, and iv thus far are all made up of three waves and that W-iii and W-iv topped and bottomed at the exact Fib-extensions. Lastly, W-iv overlapped with W-i, whereas the two grey converging lines thus far contain the price action. Thus, the price action is ticking off all the ED boxes.

Figure 2. Daily NDX chart with detailed EWP count and technical indicators
When we assess the daily chart, see Figure 2 above, we find that the typical W-5 = W-1 relationship targets ~$18615, which is close to the $18800 Fib-based level shown in Figure 1. Besides, in Figure 2 we can see that the previous orange W-5 of green W-3 was longer than the orange W-1, thus we can allow for a bit of an extension.
Lastly, the colored dotted lines are the warning levels that will tell us if the uptrend is in jeopardy. The Bulls’ 1st warning is the blue level at $18,3000. The 2nd warning is the grey level at $18000, etc. This means that below the red warning level (the green W-4 low), the black W-4? is underway to ideally NDX15900+/-200. Lastly, please note that a break below the October 2023 low tells us the bull market is over.
Read Full Story »»»
DiscoverGold
S&P 500: In the past, there has been a consistent pattern where high levels of optimism among retail investors in the financial markets, along with low volatility, have often signaled short-term peaks in the market
By: Isabelnet | March 21, 2024
• S&P 500
In the past, there has been a consistent pattern where high levels of optimism among retail investors in the financial markets, along with low volatility, have often signaled short-term peaks in the market.

Read Full Story »»»
DiscoverGold
McClellan Oscillator back above zero line as $SPX $QQQ continue their unrelenting climb to bullish glory. Short-term breadth bullish, long-term breadth bullish, it's seems like it's a bull market or something.
By: David Keller | March 21, 2024
• McClellan Oscillator back above zero line as $SPX $QQQ continue their unrelenting climb to bullish glory. Short-term breadth bullish, long-term breadth bullish, it's seems like it's a bull market or something.

Read Full Story »»»
DiscoverGold
S&P 500 Options Skew drops to lowest level since the runup to the Global Financial Crisis. This means traders are more concerned with capturing upside gains than they are with protection.
By: Barchart | March 21, 2024
• S&P 500 Options Skew drops to lowest level since the runup to the Global Financial Crisis. This means traders are more concerned with capturing upside gains than they are with protection.

Read Full Story »»»
DiscoverGold
Interest is building at $SPX 5300
By: Markets & Mayhem | March 21, 2024
• Interest is building at $SPX 5300.

Read Full Story »»»
DiscoverGold
Republicans Call Out the IEAs. The Energy Report
By: Phil Flynn | March 21, 2024
For years in my daily Energy Report on many occasions, and the Fox Business Network, I have called out the International Energy Agency’s (IEA) questionable data that seemed not so much based on facts but trying to push its big green energy agenda. Now it appears that House Republicans are doing the same, mirroring almost the same words and thoughts from some of my previous Energy Reports. In a letter to the Executive director of the International Energy Agency Fatih Birol, Republicans said that they ‘are concerned that the IEA has strayed from its core mission-promoting energy security. Wow! They took the words right out of my mouth or from a previous Energy Report but no matter, they are right to call them out as this has become a major issue as their dereliction of duty has become a threat to world energy security as well as US national security.
Some readers thought that my criticism of the IEA was just sour grapes on my part because the misreporting of supply and demand would impact my commodity positions. Ok, while there might be some truth in that the real reason was that I believe this continual underreporting of demand and over-estimation of supply was a blatant attempt to discourage investment in fossil fuels that would lead the world into an energy crisis and threaten the global economy and security putting undo burdens on the poor and the middle class of the world. But not to be negative. I did assure you that the green energy elites would be ok. I also stated that this green energy agenda would lead to global instability and sadly that has already begun to happen.
House Republicans agreed. Their words that could have been taken from my report saying, “In recent years the IEA has been undermining energy security by discouraging sufficient investment in energy supplies specifically oil natural gas and coal. Moreover its energy modeling no longer provides policymakers with balanced assessments of energy and climate proposals. Instead, it has become an energy transition cheerleader.” House Republicans went on to say that, “until recently the IEA has served as a valuable source of reliable information on the security of oil markets and it has provided A mechanism whereby oil-consuming countries can respond effectively to oil shortages. The IEA also provides global energy forecasts as part of its mission. They said, “As you have noted IEA forecasts have a tremendous influence on shaping how the world sees future energy needs consequently the IEA must conduct its energy security mission in an objective manner we believe that the IEA is failing to fulfill these responsibilities.”
House Republicans go on to say by its admission the IEA has placed greater emphasis on building net emission energy systems to comply with internationally agreed climate goals”. Yet I think it would be much better to tell the truth even if you think your massive big green energy donors and advocates can’t handle the truth because it destroys the hypocrisy and real dangers of its green energy agenda.
There is also a danger that gasoline prices will continue to go up as the surplus of gasoline supplies has disappeared according to the Energy Information Administration (EIA) weekly report. One of the problems with supplies being below normal if you have any hiccups in the system, it creates price increases and that is what we are seeing. Major refinery outages and demand that’s been better than expected have kept gasoline supplies tight. Even as gasoline demand slipped week over week causing the futures to pull back, the reality is that the supply surplus is gone. Now supplies have hit the lowest level of the year. That is the seventh straight week that gasoline supplies have fallen according to “Quantum Commodity Intelligence.” They pointed out the gasoline exports surged 21 million barrels a day for only the second time this year and said that Inventories fell by 3.3 million barrels or 1.4% to 230.7 million barrels in the week to 15 March, and their lowest since late December.
The pace of destocking slowed, however, and inventories inched back above their year-ago level but remained around 2% below their five-year average for the week. Stocks fell in every region, led by a 1.8 million barrel (-2.3%) draw in the US Gulf, where inventories slumped to a three-year low of 76.6 million barrels. That was followed by a 580,000 barrel draw in the Midwest, where BP has only just restarted its Whiting refinery after a six-week unplanned outage. Midwest refinery runs jumped 311,000 bpd on the week to 3.9 million bpd, their highest since the outage at the start of February. US-run rates inched 0.8% higher to 15.8 million bpd.
Also, the weak demand narrative for oil disappeared in yesterday’s Energy Information Administration report should demand robust. The EIA said that demand based on total products supplied over the last four-week period averaged 20.1 million barrels a day, up by 2.2% from the same period last year. Over the past four weeks, motor gasoline product supplied averaged 8.8 million barrels a day, up by 0.3% from the same period last year. Distillate fuel product supplied averaged 3.7 million barrels a day over the past four weeks, down by 1.9% from the same period last year. Jet fuel product supplied was down 0.2% compared with the same four-week period last year.
It seemed like oil prices were less excited yesterday about the Federal Reserve’s more dovish take on inflation and interest rates. Other markets like copper, platinum, platinum and silver exploded after the Fed’s outlook but oil struggled partly because in recent weeks we have seen these others metals fall in anticipation that the Fed was going to be more hawkish. Well it is still near the highs. Petroleum products were also overbought while the others were oversold. We’re looking for oil and products to consolidate for another leg higher so try to position yourselves on pullbacks from longer-term positions in the short term we expect to see some pretty good swings so day traders should start to have a lot of fun.
It seems like natural gas just can’t get a break after getting a little bit of a boost with winter returning. Now it has to face the fact that the Freeport LNG export facility is having more problems as we all remember the shutdown of the Freeport LNG export terminal caused natural gas to plummet from $11.00 when it’s shut down. Hart Energy reports that, “Freeport LNG on March 20 said its Train 2 liquefaction unit at the Texas plant has been shut down, while Train 1 will be taken down imminently as it expects inspections and any subsequent repairs at both the units to be completed by May. “It was during the January freeze that damage occurred in one of the Train 3 motors. Once we understood the cause of the damage, we knew it would be prudent to take proactive steps to inspect our other two trains,” a company spokesperson told Reuters in an email. Freeport said its Train 3 was now online and producing LNG. Each liquefaction train at Freeport can turn about 0.7 Bcf/d of gas into LNG. Earlier in the day, the company said that after maintenance work, Freeport LNG’s production capacity will increase by 10% from 15 million metric tons (MMmt) a year to just over 16.5 MMmt a year roughly by June. Additionally, the company’s Train 4, which has received all regulatory approvals, will add another 25% of LNG production capacity when it becomes operational, it said. Outages at Freeport LNG, the third-biggest LNG export plant in the United States.
Read Full Story »»»
DiscoverGold
$SPX Flow Flip $34.9 Million Puts
By: Cheddar Flow | March 21, 2024
• $SPX Flow Flip

Read Full Story »»»
DiscoverGold
Money managers Reduced their exposure to the US Equity markets since last week...
DiscoverGold
NAAIM Exposure Index
March 21, 2024 
The NAAIM Number
93.22
Last Quarter Average
67.81
»»» Read More…
The 10 Top/Bottom NASDAQ 100 Index percent net change performers
By: Thom Hartle | March 21, 2024
• Today (8:40 CST), the 10 top/bottom percent net change performers in the NASDAQ 100 Index.

Read Full Story »»»
DiscoverGold
The AAII Investor Sentiment
By: AAII | March 21, 2024
Bullish 43.2%
Neutral 29.6%
Bearish 27.2%
• Historical 1-Year High
Bullish: 52.9%
Neutral: 39.5%
Bearish: 50.3%
Read Full Story »»»
DiscoverGold
AI-generated Buy and Sell Daily Signals
By: Hedgeye | March 21, 2024
• This is free access to our brand-new AI-generated buy and sell signals.

Read Full Story »»»
DiscoverGold
The Dow Creating Confusion on Schedule
By: Marty Armstrong | March 20, 2024
We are in the process of forming a high here in March. As I have said, watch the Daily Bearish Reversals. The market has continued to hold them as it is posturing for these turning points. This is a good thing, for we are not creating a blow-off isolated high. There are so many people who are bearish, and they keep shorting the market and then have to buy back their shorts, which is creating this sideways consolidation pattern.
The Monthly Timing Array still shows an ideal high here in March, then perhaps a 2-month correction into May.
When we look at the Weekly, there was a Directional Change for this week. But the ideal turning point is the first week of April, followed by a Panic Cycle the week of April 8th and what would be a correction for three weeks into the end of the month.
We may see that the intraday high could come during the first week of April, and then the market will start to decline. That would leave March as the high on a closing basis. The primary overhead resistance stands at 39329.05, followed by 40052.32. We can see that unfolding in this short covering...
DiscoverGold
|
Followers
|
180
|
Posters
|
|
|
Posts (Today)
|
0
|
Posts (Total)
|
68362
|
|
Created
|
06/10/03
|
Type
|
Free
|
| Moderators DiscoverGold | |||
:::::::::::: Welcome to S&P 500 & Nasdaq Analysis and Trends :::::::::::::
• The purpose of this board is to help others with Short & Long term S&P 500 & Nasdaq analysis and direction.
• This is strickly an educational board helping traders to learn market direction, swing and bottom trading.
• I ask that everyone respect opinions on the board whether you agree with them or not. We are all here to make money and avoid the
minimum loss we can.
Rules of the Board
Most of this board's WATCHERS are "lurkers" who appreciate info available without the need to sift through tons of "empty" posts.
1. Respect everyone opinions on trades.
2. No Pumping of Stocks.
3. No OTCBB or PINK STOCKS
*********************************************************************************************************
To help us evaluate our performance, please "BoardMark" the board if you find it useful.
To do so, just click on "Add to Favorites" Button at Right just above the Posts Dates.
 Presently, the Board has 180 Boardmarks, Thank you!
*Information Posted on this Board is not Meant to Suggest any Specific Action, But to Point Out the Technical Signs That Can Help Our Readers Make Their Own Specific Decisions. Your Due Deligence is a Must.
EXCHANGE TRADED FUNDS~ETFs COMPONENTS~RSI and I/V charts#msg-5495097 COMPONENTSFOR ^NDX / QQQQ ~ I/V charts #msg-9787995
Gold~ Silver~ HUI~ XAU~ US$~ €uro~ Crude #msg-29347660 (thanks,bob)
Cookies/Bandwidth/Security/Privacy #msg-9353921 PIEs/Cookies/Macromedia/Flash #msg-9412363 PerformanceTips for WinXP #msg-9854670
| Volume | |
| Day Range: | |
| Bid Price | |
| Ask Price | |
| Last Trade Time: |


