S&P 500 Has Only Done This 14 Times Since 1950 By: Schaeffer's Investment Research | March 27, 2024
• Diving into SPX performance after a run of bullish newsletters
• A good short-term buying opportunity could be ahead
The percentage of bullish newsletters from the Investor Intelligence (II) poll was above 60% in the latest report. This is the first reading above 60% since July 2021, and it's an extreme one -- registering in the 95th percentile for percentage of bulls dating back to 1971.
The tables below compare how the S&P 500 Index (SPX) has performed after newsletters are extremely bullish or bearish. The poll has been a reliable long-term contrarian indicator. When bulls are extremely high, the SPX averages a 6.8% return over the next 12 months, with 68% of the returns positive. When there’s a dearth of bullish newsletters, the index averages a return of 14%, with 80% of the readings positive.
PRIOR INSTANCES
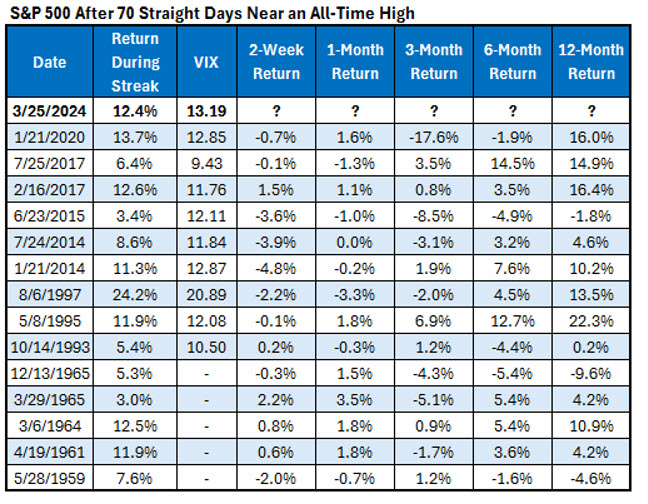
The last time the SPX closed more than 3% away from its all-time high was in mid-December. Since 1950, there have been 14 prior streaks like that. The table below summarizes the index returns after these streaks. The second table is a benchmark showing typical returns since 1959, the year of the first signal.
Based on these figures, the next three months could be a slog. The SPX averaged a loss of 1.85% over the next three months after these streaks, with just half of the returns positive. Typically, you would expect a 2% gain, with a 66% chance of being positive. On the bright side, the underperformance hasn’t lasted much more than three months. The six and 12-month returns are close to the typical market returns.
The table below lists the dates of the 70-day streaks where the SPX did not close more than 3% below its all-time high. There's nothing I see that is particularly unique about the current streak. The Cboe Market Volatility Index (VIX) reading of just over 13 and a 12% return looks in line with most of the other data points.
Finally, this last table shows how the SPX performed after the streak ended. For reference, these streaks ended after an average of 113 trading days (43 more trading days, or about two months) and with a median of 92 days (22 more trading days, or about a month).
The summary is interesting in that once the streak ends, it has made for a good short-term buying opportunity, with the index gaining 1.75% on average over the next month, with 71% of the returns positive. A couple of big pullbacks in the data at that point lead to an average three-month return that’s below breakeven. Again, the longer-term six and 12-month returns seem unaffected by these streaks.
Information posted to this board is not meant to suggest any specific action, but to point out the technical signs that can help our readers make their own specific decisions. Caveat emptor! • DiscoverGold
Register for free to join our community of investors and share your ideas. You will also get access to streaming quotes, interactive charts, trades, portfolio, live options flow and more tools.


 News
News  Market Data
  Discover