 News
News  Market Data
  Discover
Support: 888-992-3836
Copyright © 2023 InvestorsHub Inc.


Register for free to join our community of investors and share your ideas. You will also get access to streaming quotes, interactive charts, trades, portfolio, live options flow and more tools.
$NDX as long as the index can stay above $17100 we can allow for another rally to ideally $17740-890
By: Intelligent Investing | February 1, 2024
• $NDX
Yesterday the potential impulse path we were tracking on Monday was invalidated (chart 1) and we switched to a continuation of the (grey W-iv) correction down to ideally $17150-500 (chart 2).
That target zone has now been reached (chart 3).
Thus, as long as the index can stay above $17100 we can allow for another rally to ideally $17740-890.


Read Full Story »»»
 DiscoverGold
Money managers Increased their exposure to the US Equity markets since last week...
DiscoverGold
NAAIM Exposure Index
February 1, 2024 
The NAAIM Number
87.36
Last Quarter Average
67.81
»»» Read More…
$SPY & $QQQ Highly Unusual Bullish prints
By: Cheddar Flow | February 1, 2024
• $SPY & $QQQ Highly Unusual Bullish prints
The SPY one is a high premium ATH call order that was executed above the ask to show urgency
The QQQ one is a weekly put sell order that was either sold to open to collect premium or closing of their position (OI is too large to tell)

Read Full Story »»»
DiscoverGold
The AAII Investor Sentiment
By: AAII | February 1, 2024
Bullish 49.1%
Neutral 26.4%
Bearish 24.5%
• Historical 1-Year High
Bullish: 52.9%
Neutral: 39.9%
Bearish: 50.3%
Read Full Story »»»
DiscoverGold
The 10 Top/Bottom S&P 500 Index percent net change performers
By: Thom Hartle | February 1, 2024
• Today (8:33 CST), the 10 top/bottom percent net change performers in the S&P 500 Index.

Read Full Story »»»
DiscoverGold
The 10 Top/Bottom NASDAQ 100 Index percent net change performers
By: Thom Hartle | February 1, 2024
• Today (8:33 CST), the 10 top/bottom percent net change performers in the NASDAQ 100 Index.

Read Full Story »»»
DiscoverGold
SPX Presidential Election years
By: Nautilus Research | February 1, 2024
• #seasonality $spy $spx SPX Presidential Election years.

Read Full Story »»»
DiscoverGold
AI-generated Buy and Sell Daily Signals
By: Hedgeye | February 1, 2024
• This is free access to our brand-new AI-generated buy and sell signals.

Read Full Story »»»
DiscoverGold
The Ord Oracle: SPX Update
By: Tim Ord | January 31, 2024
SPX Monitoring Purposes: Long SPX on 1/18/24 at 4780.94.
Our Gain 1/1/23 to 12/31/23: SPX=28.12%; SPX gain 23.38%.
Monitoring Purposes GOLD: Long GDX on 10/9/20 at 40.78.
Our gain for 2023 came in at 28.12% and SPX gain for 2023 came in at 23.38. We made 8 SPX trades, with one loss and 7 wins in 2023.
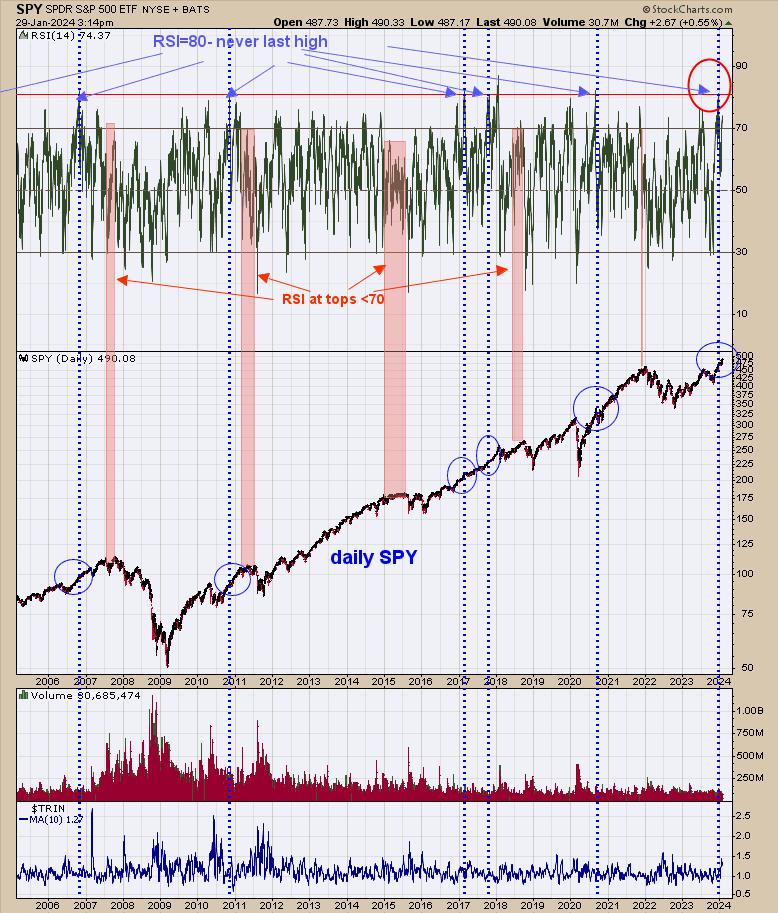
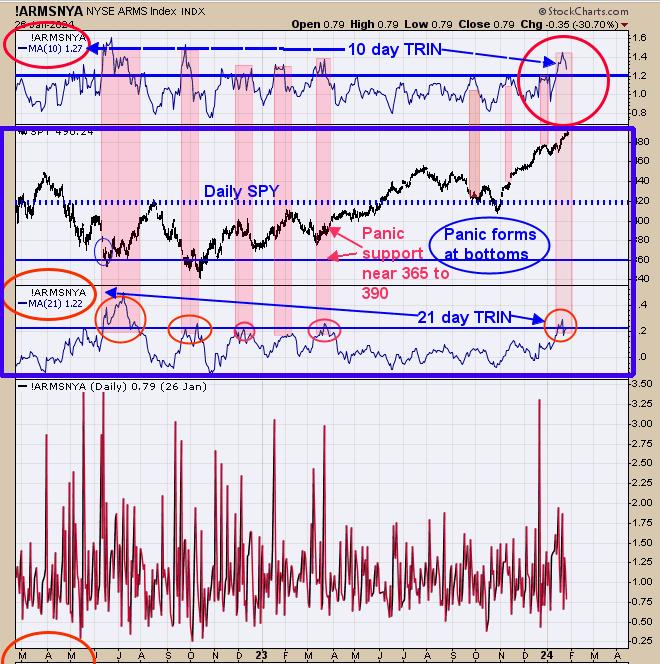
We have the SPY up six days in a row going into last Thursday, which predicts that the SPY will be higher within five days 93% of the time. The top window is the 10-day average of the TRIN, which stands at 1.27; readings above 1.20 are considered bullish. The window below daily SPY is the 21-day TRIN; reading above 1.20 are bullish (current reading is 1.22). SPY tends to trend when both 10- and 21-day TRIN are in bullish levels (noted in shaded pink). In general, the SPY (SPX) rally should continue.
We updated this chart from last Thursday. Back then, we said, "SPY (SPX) may be starting to trend (market is consistently up every week). The above is daily SPY going back to 2005. The top window is the RSI for the SPY. It's common for the market to trend when the daily RSI trades to 80. We market those times when the RSI reached 80 with dotted blue lines. The RSI reached 80 on December 18, 2023 (about a month ago). In previous times when the RSI reached 80, the market trended for multiple months." This more evidence that a trending market is likely.
Tim Ord,
Editor
Read Full Story »»»
DiscoverGold
Here’s what to expect from stocks in February after January’s big rally
By: Mark Hulbert | January 31, 2024
• U.S. market tends to take a breather after a strong January run
The Dow’s average February return after rising in January is just 0.16%.
Wall Street’s excitement over the bullish posture of the January Indicator tells us more about their exuberance than how the U.S. stock market will actually perform this year.
There’s a belief on Wall Street that “as goes January, so goes the year.” After a rocky start to the month, which initially suggested that the January Indicator might be negative for the rest of 2024, the U.S. stock market has rebounded nicely — making it almost certain that January will be a positive month for the market and the January Indicator will be bullish for the year.
If only the January Indicator rested on a strong statistical foundation.
I’ve questioned the January Indicator before, and in this column, I’m looking at it in a new way. For each month since 1896, I calculated the Dow Jones Industrial Average’s DJIA success rate at predicting the stock market’s direction over the subsequent 11 months. As you can see from the accompanying chart, several months are almost as good an indicator as January — such as July and December. And the success rate for another month — November — is just as good as December.
So there is nothing particularly unique about January.
You might conclude from these results that there should be a November, July or December Indicator in addition to January. However, the data do not support that conclusion. The reason many different months have what appears to be decent predictive abilities is that the stock market rises far more often than not. So it only looks like the stock market’s direction in a given month “predicts” the market’s subsequent-11-months direction. To claim that it does makes no more sense than concluding that, because night follows day, day “causes” night.
Another implication of the chart is that, because the market rises more often than not, you would do better than the January Indicator by always predicting that the market would be up over the subsequent 11 months. Since 1896, such a prediction would have been successful 66.2% of the time. This is represented by the red line in the chart, and you’ll notice that this is better than the success rate of not just January but those of all the other months as well.
Another reason to question the statistical foundation of the January Indicator is that the market in February typically reverses its January direction. This is not what you would expect if there were a strong basis in reality for the January Indicator, as opposed to being little more than an artifact of investor sentiment.
Consider that the Dow’s average February return after rising in January is just 0.16%, which is below the average gain across all months since 1896 of 0.62%. The most likely cause of this below-average performance is that exuberant traders jump on the bullish bandwagon at the end of those Januarys in which it becomes clear that the market will be up for the month. This causes the market to get ahead of itself, leading to below-average performance in February.
Read Full Story »»»
DiscoverGold
$SPX They are buying the intraday dip again...
By: Cheddar Flow | January 31, 2024
• $SPX They are buying the intraday dip again...

Read Full Story »»»
DiscoverGold
January Barometer: Bulls Should Buckle Up for 2024
By: Schaeffer's Investment Research | January 31, 2024
• When the SPX wins -- and wins big -- in January, it usually means more gains to come
• The S&P 500 Index (SPX) is off to a good start for the year
The S&P 500 Index (SPX) is off to a good start for the year, with a 3% lead heading into the last day of January. This positive start is often considered an auspicious sign for the remainder of the year. The January Barometer is a well-known seasonality indicator that has been a reliable guide for the remaining months. As you can see from the table below, stocks have performed exceptionally well over the next 11 months following a positive January. Otherwise, they’ve been subpar. Schaeffer's Managing Editor Emma Duncan already wrote about the January Barometer here, but In this article, I delve deeper into the numbers to assess whether the outlook for the rest of the year remains optimistic given our current market circumstances.

STOCK PERFORMANCE AFTER A BIG YEAR
The S&P 500 gained 24% in 2023, a strong year for stocks. I was curious how stocks have tended to behave after these overwhelmingly positive years. The table below summarizes S&P 500 returns following years with gains of at least 20%, a phenomenon observed 20 times in the past. January has averaged a slight loss after these instances, with exactly half of them positive. It’s good news that the market is up this January. In the 10 instances when January was positive after a 20% or more gain for the index in the previous year, the S&P 500 averaged a 15% return for the rest of the year, with all 10 returns positive.

ENDING JANUARY NEAR ALL-TIME HIGHS
With one day left of this month's trading, the S&P 500 also sits very close to its all-time high. The table below shows how the S&P 500 performed based on its proximity to the all-time high at the end of January. When the index was within 2% of its all-time high it averaged a gain of 9.64% for the rest of the year with 78% of the returns positive. Other years, the index averaged a gain of 7.44% with 75% of returns positive. So, it doesn’t show clear outperformance, but there’s also no increased likelihood of a pullback in the calendar year either.

Finally, let’s put all these scenarios together. The table below shows each of the years since 1950 in which the S&P 500 was positive in January and finished the month within 2% of its all-time high after a year in which it gained at least 20%. There were seven years in which this occurred. The index averaged a return of 18% for the rest of the year with all returns positive. It failed to gain double digits over the last 11 months of the year only one time. That year, 1959, it gained an adequate 8% for the rest of the year. Based on the numbers in this article, 2024 is set up for a bullish year.

Read Full Story »»»
DiscoverGold
The 10 Top/Bottom S&P 500 Index percent net change performers
By: Thom Hartle | January 31, 2024
• Today (8:34 CST), the 10 top/bottom percent net change performers in the S&P 500 Index.

Read Full Story »»»
DiscoverGold
The 10 Top/Bottom NASDAQ 100 Index percent net change performers
By: Thom Hartle | January 31, 2024
• Today (8:34 CST), the 10 top/bottom percent net change performers in the NASDAQ 100 Index.

Read Full Story »»»
DiscoverGold
January Barometer: Why It’s Important & Why It Works
By: Almanac Trader | January 31, 2024

As the S&P 500 goes in January, so goes the year 74.4% of the since 1938. The next 11 months follow January 67.4% of the time. The January Barometer was devised by Yale Hirsch in 1972. With a negative Santa Claus Rally and First Five Days JB holds the key. When January is up after a down SCR and FFD, S&P 500 advanced three times over the remaining eleven months and the full year with average gains of 15.1% and 19.9% respectively.
It all started with the 20th “Lame Duck” Amendment to the Constitution in 1934 where newly elected Senators and Representatives take office in the first week of January and new Presidents are inaugurated on January 20. Prior to that, new members of Congress were not seated until December of the new year. Presidents were not inaugurated until March 4.
Being the first month of the year, it is the time when people readjust their portfolios and try to make a fresh start. Financial analysts rethink their outlook for the coming year. There is also an increase in cash that flows into the market in January, making market direction even more important. Then there is all the information to digest: federal budgets, national goals and priorities, FOMC meetings, 4th quarter GDP data, earnings, and a plethora of other economic data.
Read Full Story »»»
DiscoverGold
AI-generated Buy and Sell Daily Signals
By: Hedgeye | January 31, 2024
• This is free access to our brand-new AI-generated buy and sell signals.

Read Full Story »»»
DiscoverGold
$SPX Looks like the bulls are stepping back in the arena again
By: Cheddar Flow | January 30, 2024
• $SPX Looks like the bulls are stepping back in the arena again

Read Full Story »»»
DiscoverGold
$TQQQ is receiving some short-term Bullish activity here
By: Cheddar Flow | January 30, 2024
• $TQQQ is receiving some short-term Bullish activity here
These are aggressive bets, due to the call orders being OTM and near expiration
The system highlighted them in blue, because of they are 'highly unusual' orders

Read Full Story »»»
DiscoverGold
The S&P 500 hit record highs last week at the same time an indicator of underlying selling pressure spiked to panic levels
By: SentimenTrader | January 30, 2024
• Something odd is happening under the surface of the stock market.
The S&P 500 hit record highs last week at the same time an indicator of underlying selling pressure spiked to panic levels.
That's never happened before.

Read Full Story »»»
DiscoverGold
SPX >13% above 1-year MA. Peak, or scaling a 'wall of worry' (aka momentum)?
By: Nautilus Research | January 30, 2024
• #spx $spy SPX >13% above 1-year MA. Peak, or scaling a 'wall of worry' (aka momentum)?

Read Full Story »»»
DiscoverGold
It's getting a little easy at this point, isn’t it? Maybe a little too easy? NOT saying “sell”. The stuff I follow is still bullish. But it usually doesn’t stay easy for long. Nasdaq High/Low Logic is one indicator telling me to mentally prepare for some “chop.”
By: Jay Kaeppel | January 30, 2024
• It's getting a little easy at this point, isn’t it? Maybe a little too easy? NOT saying “sell”. The stuff I follow is still bullish. But it usually doesn’t stay easy for long. Nasdaq High/Low Logic is one indicator telling me to mentally prepare for some “chop.”

Read Full Story »»»
DiscoverGold
NASDAQ100 Rally Continues. $18K Next?
By: Dr. Arnout Ter Schure | January 29, 2024
Eeny, Meeny, Miny, Moe
In our last update from two weeks ago, see here, our primary expectations were
1. either a long-term top (blue W-B) and set course for $8600+/-2000 or
2. a drop to ideally around $15800+/-200 for the black W-4?, before a final rally to as high as $20000+/-1000 for the black W-5?. Our alternative is
3. For a mild correction to have ended on January 5, a rally to $ 17414-713 is underway.
Unfortunately, we could not discern between these three potentials back then, but the NASDAQ100 (NDX) broke already above its December 2023 high on January 18, and therewith signaling option (C) was underway. Since then, we have successfully tracked the index for our premium members using a standard Fibonacci-based Elliott Wave Principle (EWP) impulse pattern. See Figure 1 below.
Figure 1. NDX hourly chart with detailed EWP count and technical indicators

The internals of an Impulse
In an EWP impulse pattern, we expect the third of a third wave, i.e., orange W-3 of grey W-iii, to reach the 100-123.6% Fibonacci extension, W-4 should then ideally drop to the 100-76.4% Fib-extension, W-5 of W-iii to the 161.8% extension, etc. So far, the index has adhered well to this pattern and should either be in grey W-iv or have already completed it. We don’t know yet at this stage, but we certainly have price levels above or below, which we can get an answer to this question.
Regardless, an impulse consists of five waves; so far, there have been only three waves since the January 5th low. Hence, we must expect another grey W-v to ideally $17738-890 once the current minor correction since last week’s high has run its course while staying above critical price levels. Note the grey W-iv typically reaches the 100% Fib-extension level but can also bottom at 123.60% (shallow) or 76.40% (deep). Below the latter, i.e., the orange warning level, increases the odds grey W-v may not materialize.
Namely, the colored dotted lines (blue, grey, orange, and red) subsequently increase the warning levels for the Bulls, which can be used to prevent havoc on one’s portfolio. A drop below the red line from current price levels
Our alternative scenario using the regular NASDAQ is shown in Figure 2 below.
Figure 2. Daily NAS chart with detailed EWP count and technical indicators

Given that the rally from the October 2023 low was essentially straight up with very few down days, besides the five-day decline into the January 5 low, the correct interpretation of the price action from an EWP perspective is not entirely straightforward. As such, the expected high at around NDX17738-890 (NAS15760-920) may also only be green W-3 of red W-v. A pullback to around NDX17100+/-100 and NAS15250+/-100 for the green W-4, followed by another rally for the green W-5, should be anticipated.
Read Full Story »»»
DiscoverGold
AI-generated Buy and Sell Daily Signals
By: Hedgeye | January 30, 2024
• This is free access to our brand-new AI-generated buy and sell signals.

Read Full Story »»»
DiscoverGold
S&P 500 hits fresh closing high ahead of Fed meeting, big tech earnings
By: Investing | January 29, 2024
NEW YORK (Reuters) -U.S. stocks advanced on Monday as market participants looked ahead to this week's slew of megacap earnings, economic data and the Federal Reserve's monetary policy meeting.
All three major U.S. stock indexes advanced, with the tech-laden Nasdaq enjoying the largest percentage gain.
The S&P 500 notched yet another record closing high.
With the bellwether index up 3.3% so far in the first month of 2024, BlackRock (NYSE:BLK) raised its overall U.S. stocks view to "overweight" from "neutral."
"Today is the calm before the storm," said Ryan Detrick, chief market strategist at Carson Group in Omaha. "This is a truly headline-driven week, with earnings, the Fed, the jobs report and ongoing geopolitical uncertainties."
"So with stocks at all time high, if we see any disappointments that could upset the apple cart and cause some well-deserved volatility," Detrick added.
A spate of earnings from high profile tech and tech-adjacent momentum stocks waits in the wings, starting on Tuesday with Alphabet (NASDAQ:GOOGL) Inc and Microsoft Corp (NASDAQ:MSFT), Qualcomm (NASDAQ:QCOM) Inc and Wednesday and culminating on Thursday with Apple Inc (NASDAQ:AAPL), Amazon.com (NASDAQ:AMZN) and Meta Platforms Inc (NASDAQ:META).
Other closely watched results include General Motors (NYSE:GM) Inc on Tuesday, Boeing (NYSE:BA) Co on Thursday, with oil supermajors Exxon Mobil Corp (NYSE:XOM) and Chevron Corp (NYSE:CVX) wrapping up the week on Friday.
The Federal Open Markets Committee is scheduled to convene on Tuesday for its two-day monetary policy meeting, at which its voting members are widely expected to leave the key Fed funds target rate unchanged at 5.25% to 5.50%.
"Powell is probably going to be somewhat cautious. The Fed doesn't want to be burned by inflation, and will push back on the (expected) March cut as a near certainty," Detrick said.
Fed Chair Jerome Powell and other policymakers have warned not to expect interest rate cuts before inflation cools down to its average 2% annual target, but have also vowed to remain agile as they respond to economic data.
This week's roster of economic reports includes the labor market, with the Job Openings and Labor Turnover Survey, ADP, fourth-quarter employment costs, productivity, and planned layoffs, and the January employment report on Friday.
Case-Shiller home prices, consumer confidence, the Institute for Supply Management's purchasing managers' index, construction spending and factory orders are also on deck.
Robust economic data of late - particularly last week's strong gross domestic product and personal consumption expenditures data - have simultaneously calmed fears of imminent recession and tossed cold water on hopes that the Fed would begin cutting interest rates as soon as March.
The Dow Jones Industrial Average rose 224.02 points, or 0.59%, to 38,333.45. The S&P 500 gained 36.96 points, or 0.76%, at 4,927.93 and the Nasdaq Composite advanced 172.68 points, or 1.12%, to 15,628.04.
Ten of the 11 S&P 500 sector indexes rose, led by consumer discretionary, up 1.37%, followed by a 0.97% gain in information technology.
Energy sector was the sole declining sector.
Tesla (NASDAQ:TSLA) Inc surged 4.2% after the electric car maker revealed capex plans.
Robot vacuum maker iRobot (NASDAQ:IRBT) slid 8.8% as the company and Amazon scrapped merger plans in the face of opposition from EU antitrust regulators.
Meta Platforms rose 1.7% after brokerage Jefferies raised its target price on the stock to $455 from $425.
Warner Bros Discovery (NASDAQ:WBD) lost 1.2% as brokerage Wells Fargo downgraded the streaming platform to "equal weight" from "overweight."
Financial technology firm SoFi Technologies (NASDAQ:SOFI) jumped 20.2% after posting a fourth-quarter profit.
Stocks on the NYSE scored 397 new highs and 50 new lows.
On the Nasdaq 2,975 stocks rose and 1,314 fell as advancing issues outnumbered decliners by a roughly 2.3-to-1 ratio.
The S&P 500 posted 45 new 52-week highs and no new lows while the Nasdaq recorded 226 new highs and 101 new lows.
Volume on U.S. exchanges was relatively light, with 10.3 billion shares traded, compared to an average of 11.5 billion shares over the previous 20 sessions.
Read Full Story »»»
DiscoverGold
Safe to say, these whales are bullish on tech
By: Cheddar Flow | January 29, 2024
• Safe to say, these whales are bullish on tech

Read Full Story »»»
DiscoverGold
The 10 Top/Bottom S&P 500 Index percent net change performers
By: Thom Hartle | January 29, 2024
• Today (8:34 CST), the 10 top/bottom percent net change performers in the S&P 500 Index.

Read Full Story »»»
DiscoverGold
The 10 Top/Bottom NASDAQ 100 Index percent net change performers
By: Thom Hartle | January 29, 2024
• Today (8:34 CST), the 10 top/bottom percent net change performers in the NASDAQ 100 Index.

Read Full Story »»»
DiscoverGold
AI-generated Buy and Sell Daily Signals
By: Hedgeye | January 29, 2024
• This is free access to our brand-new AI-generated buy and sell signals.

Read Full Story »»»
DiscoverGold
The 12 Most Heavily Shorted Stocks according to FactSet - $UPST $BYND $GRPN $AI and $CVNA making the list
By: Barchart | January 28, 2024
• The 12 Most Heavily Shorted Stocks according to FactSet - $UPST $BYND $GRPN $AI and $CVNA making the list

Read Full Story »»»
DiscoverGold
Think QQQ pulls back next month? History would agree...
By: TrendSpider | January 26, 2024
• Think $QQQ pulls back next month? History would agree...
February is the Nasdaq's worst performing month over the last 20 years, with a win rate of just 40%.

Read Full Story »»»
DiscoverGold
Earnings per share for the S&P 500 are expected to reach $229 in 2024 and $266 in 2025, according to Morgan Stanley forecasts. These projections suggest positive prospects for growth and profitability
By: Isabelnet | January 27, 2024
• Earnings per share for the S&P 500 are expected to reach $229 in 2024 and $266 in 2025, according to Morgan Stanley forecasts. These projections suggest positive prospects for growth and profitability.

Read Full Story »»»
DiscoverGold
CoT: Peek Into Future Through Futures, How Hedge Funds Are Positioned
By: Hedgopia | January 27, 2024
• Following futures positions of non-commercials are as of January 23, 2024.
E-mini S&P 500: Currently net short 189.5k, up 20.2k.

No sooner did 4800, which had held down the S&P 500 since late December, give way last week than it rallied to 4900 in no time. On Friday, the large cap index tagged 4907, before giving back those gains to end the session down 0.1 percent to 4891. Nevertheless, it rallied 1.1 percent for the week – its third consecutive up week and 12th in 13.
Last Friday, when 4800 cracked, the index also surpassed the prior high of 4819 from January 2022. A breakout retest is just a matter of time and will be healthy, as this will help determine how genuine the breakout is and if recent positive trends seen in margin debt and equity flows are here to stay (more on this here).
For now, upward momentum is strong, with the daily RSI over 72 and the weekly over 70. This also makes the index susceptible to an unwinding of the extremely overbought condition it is in.
Short-term support is at 4860s, followed by the important 4800-4810s.
Nasdaq 100 index (mini): Currently net long 33k, down 3.5k.

Ahead of next week’s December-quarter results from Apple (AAPL), Microsoft (MSFT), Google owner Alphabet (GOOG), Amazon (AMZN) and Facebook owner Meta (META), the Nasdaq 100 formed a weekly spinning top, with an intraday high of 17665 and a close of 17421.
This week, of the majors, results from Netflix (NFLX) drew positive reaction, while those from Tesla (TSLA) and Intel (INTC) were treated harshly. The problem for these stocks, including the five reporting next week, is that they have had massive rallies the past three months. From last October’s low, the Nasdaq 100 is up 25.7 percent, and 69.2 percent from the October 2022 low.
Shorts are likely to use the earnings reports to get active (more on this here). In fact, this week’s candle suggests it has begun.
Russell 2000 mini-index: Currently net short 6.2k, up 20.4k.

Non-commercials switched back to net shorts in Russell 2000 mini-index futures. Three weeks ago, having stayed net short uninterrupted for 146 weeks, they went net long. This only lasted a couple of weeks.
They have probably decided that the December 27th high of 2072 in the cash is unlikely to get surpassed anytime soon. Earlier on December 13th, the Russell 2000 broke out of a 200-point range between 1900 and 1700, which had been in place since January last year. A measured-move target of the breakout came to 2100, which was just about hit two weeks later.
This week, the small cap index did rally 1.8 percent but was also denied at 2000 twice – on Tuesday and Wednesday. It now increasingly looks like it is once again headed for a breakout retest at 1900, which already occurred in the week before – successfully.
US Dollar Index: Currently net long 1.6k, up 347.

The weekly RSI ended this week at 49.25. Inability to take out the median – likely – should open the door to lower prints.
Having said that, the US dollar index (103.23), up 0.2 percent this week, did enjoy its fourth up week in a row. Five weeks ago, it bottomed at 100.32 on December 28th.
Before that, the index peaked on October 3rd at 107.05 and began to really come under pressure early November. Post-Fed pivot on December 13th, it sliced through horizontal support at 103-104 as well as the 200-day. It is currently trapped between the average (103.29) and the 50-day (102.75).
As things stand, odds favor a breach of the 50-day in the sessions ahead.
VIX: Currently net short 49.2k, up 5.4k.

On December 12th – the day before the Fed made the pivot – VIX tagged 11.81 intraday and gradually headed higher, eventually reaching 15.40 on the 17th this month. Volatility bulls were unable to hang on to that high but should like the fact that since that low a month and a half ago the index has made higher lows, with a low of 12.41 this week occurring on Wednesday; the week closed at 13.26, only down 0.04 points. Last week, too, VIX rallied – hand in hand with the S&P 500, which in and of itself is rare.
Volatility likely gets bid up in the sessions ahead.
Read Full Story »»»
DiscoverGold
S&P 500 Index (SPX) »» Phase Transition in Motion Weekly Summary Analysis
By: Marty Armstrong | January 27, 2024
S&P 500 Cash Index closed today at 489097 and is trading up about 2.53% for the year from last year's settlement of 476983. Caution is now required for this market is starting to suggest it may rally further on the MONTHLY level. Up to now, this market has been rising for 2 months going into January reflecting that this has been only still, a bullish reactionary trend. As we stand right now, this market has made a new high exceeding the previous month's high reaching thus far 490669 while it is still trading above last month's high of 479330.
ECONOMIC CONFIDENCE MODEL CORRELATION
Here in S&P 500 Cash Index, we do find that this particular market has correlated with our Economic Confidence Model in the past. Our next ECM target remains Tue. May 7, 2024. The Last turning point on the ECM cycle low to line up with this market was 2009 and 2002. The Last turning point on the ECM cycle high to line up with this market was 2022 and 2007 and 2000.
MARKET OVERVIEW
NEAR-TERM OUTLOOK
The S&P 500 Cash Index has continued to make new historical highs over the course of the rally from 1974 moving into 2024. Distinctly, we have elected two Bullish Reversals to date.
This market remains in a positive position on the weekly to yearly levels of our indicating models. Pay attention to the Monthly level for any serious change in long-term trend ahead.
Focusing on our perspective using the indicating ranges on the Daily level in the S&P 500 Cash Index, this market remains in a bullish position at this time with the underlying support beginning at 486841.
On the weekly level, the last important high was established the week of January 22nd at 490669, which was up 13 weeks from the low made back during the week of October 23rd. So far, this week is trading within last week's range of 490669 to 484405. Nevertheless, the market is still trading upward more toward resistance than support. A closing beneath last week's low would be a technical signal for a correction to retest support.
When we look deeply into the underlying tone of this immediate market, we see it is currently still in a semi neutral posture despite declining from the previous high at 490669 made 0 week ago. This market has made a new historical high this past week reaching 490669. Here the market is trading positive gravitating more toward resistance than support. We have technical support lying at 489803 which we are currently trading below implying the market is very weak. This infers that this level will now be resistance. Our Major Channel Support lies at 426511 and a break of that level would be a bearish indication for this market.
Right now, the market is above momentum on our weekly models hinting this is still bullish for now as well as trend, long-term trend. Looking at this from a wider perspective, this market has been trading up for the past 3 weeks overall.
INTERMEDIATE-TERM OUTLOOK
YEARLY MOMENTUM MODEL INDICATOR
Our Momentum Models are rising at this time with the previous low made 2022 while the last high formed on 2023. However, this market has rallied in price with the last cyclical high formed on 2022 warning that this market remains strong at this time on a correlation perspective as it has moved higher with the Momentum Model.
Interestingly, the S&P 500 Cash Index has been in a bullish phase for the past 9 months since the low established back in March 2023.
Critical support still underlies this market at 433520 and a break of that level on a monthly closing basis would warn that a sustainable decline ahead becomes possible. Nevertheless, the market is trading above last month's high showing some strength.
DiscoverGold
Nasdaq Composite Index (COMP) »» Warning Forming Key High Weekly Summary Analysis
By: Marty Armstrong | January 27, 2024
NASDAQ Composite Index Cash closed today at 1545536 and is trading up about 2.95% for the year from last year's settlement of 1501135. Caution is now required for this market is starting to suggest it may rally further on the MONTHLY level. Up to this moment in time, this market has been rising for 2 months going into January reflecting that this has been only still, a bullish reactionary trend. As we stand right now, this market has made a new high exceeding the previous month's high reaching thus far 1562907 while it is still trading above last month's high of 1515007.
ECONOMIC CONFIDENCE MODEL CORRELATION
Here in NASDAQ Composite Index Cash, we do find that this particular market has correlated with our Economic Confidence Model in the past. Our next ECM target remains Tue. May 7, 2024. The Last turning point on the ECM cycle low to line up with this market was 2022 and 2009 and 2002. The Last turning point on the ECM cycle high to line up with this market was 2007 and 2000.
MARKET OVERVIEW
NEAR-TERM OUTLOOK
The historical perspective in the NASDAQ Composite Index Cash included a rally from 2009 moving into a major high for 2021, the market has been in a bearish trend since the high moving into the low in 2022 for a declining trend during that year. The last Yearly Reversal to be elected was a Bullish at the close of 2022.
This market remains in a positive position on the weekly to yearly levels of our indicating models. Pay attention to the Monthly level for any serious change in long-term trend ahead.
Focusing on our perspective using the indicating ranges on the Daily level in the NASDAQ Composite Index Cash, this market remains in a bullish position at this time with the underlying support beginning at 1543885.
On the weekly level, the last important high was established the week of January 22nd at 1562907, which was up 13 weeks from the low made back during the week of October 23rd. So far, this week is trading within last week's range of 1562907 to 1533363. Nevertheless, the market is still trading downward more toward support than resistance. A closing beneath last week's low would be a technical signal for a correction to retest support.
When we look deeply into the underlying tone of this immediate market, we see it is currently still in a semi neutral posture despite declining from the previous high at 1562907 made 0 week ago. The broader perspective, this current rally into the week of January 22nd reaching 1562907 has exceeded the previous high of 1515007 made back during the week of December 25th.
Right now, the market is above momentum on our weekly models hinting this is still bullish for now as well as trend, long-term trend. Looking at this from a wider perspective, this market has been trading up for the past 3 weeks overall.
INTERMEDIATE-TERM OUTLOOK
YEARLY MOMENTUM MODEL INDICATOR
Our Momentum Models are rising at this time with the previous low made 2022 while the last high formed on 2023. However, this market has rallied in price with the last cyclical high formed on 2021 warning that this market remains strong at this time on a correlation perspective as it has moved higher with the Momentum Model.
Interestingly, the NASDAQ Composite Index Cash has been in a bullish phase for the past 9 months since the low established back in March 2023.
Critical support still underlies this market at 1418150 and a break of that level on a monthly closing basis would warn that a sustainable decline ahead becomes possible. Nevertheless, the market is trading above last month's high showing some strength.
DiscoverGold
QQQ Weekly doji candle into big tech earnings week...
By: TrendSpider | January 26, 2024
• $QQQ Weekly doji candle into big tech earnings week...

Read Full Story »»»
DiscoverGold
Mixed Flow on $SPY & $QQQ...
By: Cheddar Flow | January 26, 2024
• Mixed Flow on $SPY & $QQQ
High premium put sells with a shorter-expiration, paired with slightly longer-expiration put buys
This is a sign of indecision

Read Full Story »»»
DiscoverGold
Tech earnings will be in the limelight
By: Raymond James Financial | January 26, 2024
Key Takeaways
• Watching the Fed and quarterly refunding update
• The pace of job gains should continue to slow
• Tech earnings next week will be in the limelight
This week marks the 100th anniversary of the Winter Olympics. In 1924, athletes from around the world gathered in Chamonix, France to compete in five different winter sports – ranging from skiing, snowboarding, bobsledding, ice hockey and the much-loved figure skating competition. Over the years, the Winter Olympics have grown to be one of the world’s biggest sporting events, with over 2 billion viewers tuning in to watch! And while there are no Winter Olympics this year (the next one is in Italy in 2026), we will have our own version of financial Olympics next week with the Federal Reserve (Fed) meeting, Treasury’s quarterly refunding announcement and Tech earnings. With investment spectators looking on, these events will be pivotal in shaping our views going forward. Here’s what we’ll be watching:
• The Fed and quarterly refunding update | Fed policymakers are expected to hold policy rates steady at next week’s FOMC meeting; however, rate cuts are still on the horizon. But with economic growth humming along (Atlanta Fed 1Q24 GDP is running at a 2.4% pace) policymakers do not appear to be in a rush to cut rates as quickly or aggressively as the market expects. After several Fed members pushed back against the market’s overly optimistic expectations, the probability of a March rate cut has receded – with the market only expecting a ~48% chance of a 25 basis point rate cut, down from ~80% about a month ago. Market expectations are still pricing in five rate cuts this year – still more than the three rate cuts the Fed penciled in last December and the three to four rate cuts our economist expects. But, given that Chairman Jerome Powell has professed that the Fed could cut rates before inflation decelerated to 2.0% and core PCE inflation is already running below the Fed’s 2.0% target on a 3- and 6-month annualized basis, the market is wondering what the Fed is waiting for. Hence, the ongoing tug-of-war. Perhaps the BLS revisions to the inflation data on February 9 will give the Fed the confirmation it needs that this disinflationary trend is not an illusion that will be revised away. The Treasury Department’s quarterly refunding announcement could be another pivotal event next week. While auction sizes are likely to increase again, demand for Treasurys has improved as markets prepare for the Fed’s upcoming easing cycle. The issuance composition – bills versus longer-dated bonds – will be closely watched.
• Important week of economic data | The ongoing strength in the labor market and consumer spending have led consensus expectations to shift away from a recession to a soft landing. We remain in the camp that a recession will take place (although it will be the mildest in history) as our expectation of a softening labor market should lead to weakness in consumer spending. Next week is a critical week of economic data points – particularly for the labor market. What are we watching? First, job openings (which have fallen 27% from the peak in early 2022) will be released Tuesday. We expect job openings to continue to trend lower to the lowest level in three years. Second, the most important release of the week will be the January jobs report on Friday, which should show that the pace of job gains slowed to 150k. If our forecast is correct, it would bring the six-month moving average of job gains to nearly the lowest level (180k) since September 2020. Lastly, ISM Manufacturing on Thursday should show that manufacturing remained in contraction territory for the 14th consecutive month – the longest negative streak since 2002. Ultimately, these data releases should reflect that economic activity is slowing as we move through the early stages of 2024. We expect this weakening trend to continue, potentially tipping the economy into a mild recession beginning in 2Q.
• Tech earnings will be in the limelight | Mega-cap Tech related names (MAGMAN) drove equity returns in 2023. However, heading into 2024 market consensus expected returns to broaden to other equity sectors and market cap sizes. While still early (only 26% of the market cap have reported), that has not happened. Instead, the S&P 500 has risen to a record high and our composite of MAGMAN stocks is up ~7% while the rest of the Index is flat year-to-date. The outperformance by MAGMAN has in large part been backed by fundamentals. Over the last 12 months, MAGMAN stocks climbed ~70% on a price return basis, roughly in line with an expected YoY earnings growth of 55% in 4Q23. In fact, MAGMAN’s earnings growth far outpaces the rest of the Index, as 4Q23 S&P 500 earnings ex-MAGMAN are expected to decline 10% YoY. Investor attention will be on the mega-cap Tech companies next week as many of the names (MSFT, APPL, AMZN, GOOGL, META) will report earnings. Thus far, despite a lowered bar, it has been a fairly lackluster start to the 4Q23 earnings season as the percentage of companies beating on the top and bottom line have been below the historical average and the magnitude of beats is at the lowest level since 2008. With the market at record highs and valuations near the upper end of its range over the last 20 years, any disappointments from the MAGMAN names (particularly given the forecasted 55% EPS growth) will likely lead to increased volatility over the coming weeks.

Read Full Story »»»
DiscoverGold
SPX Millions worth of calls with a 4800-5000 strike hitting the tape
By: Cheddar Flow | January 26, 2024
• $SPX Millions worth of calls with a 4800-5000 strike hitting the tape

Read Full Story »»»
DiscoverGold
S&P 500 likely to achieve additional record highs in 2024
By: Raymond James Financial | January 24, 2024
• Despite some market volatility, Raymond James CIO Larry Adam notes that we're in the opening stages of a bull market expected to last years.
https://cfvod.kaltura.com/p/1727781/sp/172778100/thumbnail/entry_id/1_3e9u6ihr/version/100031/width/854/height/506
Read Full Story »»»
DiscoverGold
The 10 Top/Bottom S&P 500 Index percent net change performers
By: Thom Hartle | January 26, 2024
• Today (8:34 CST), the 10 top/bottom percent net change performers in the S&P 500 Index.

Read Full Story »»»
DiscoverGold
The 10 Top/Bottom NASDAQ 100 Index percent net change performers
By: Thom Hartle | January 26, 2024
• Today (8:34 CST), the 10 top/bottom percent net change performers in the NASDAQ 100 Index.

Read Full Story »»»
DiscoverGold
AI-generated Buy and Sell Daily Signals
By: Hedgeye | January 26, 2024
• This is free access to our brand-new AI-generated buy and sell signals.

Read Full Story »»»
DiscoverGold
SPX 4-year presidential cycle update
By: Nautilus Research | January 24, 2024
• #seasonality SPX 4-year presidential cycle update.

Read Full Story »»»
DiscoverGold
The $SPX reached $4903.68 intraday, while the 1.618x extension for, an ideal, (grey) W-iii is at $4903.86 (!)
By: Intelligent Investing | January 24, 2024
• You can’t make this up.
The $SPX reached $4903.68 intraday, while the 1.618x extension for, an ideal, (grey) W-iii is at $4903.86 (!)
The arrows have been our preferred, ideal, path since Friday.
Other than a shallower orange W-4 (blue box was our adjusted target on Monday) than “normal” (orange box) the #SPX500 is humming along well: downside tends to disappoint whereas upside surprises in a Bull run.
Trade safely!


Read Full Story »»»
DiscoverGold
Stocks w/ most active options trading:
By: Barchart | January 25, 2024
• Stocks w/ most active options trading:
$TSLA - 4.7M
$NVDA - 1.5M
$AMD - 1.4M
$AAPL - 779k
$INTC - 670k
$PYPL - 659k
$AMZN - 581k
$GOOGL - 462k
$BA - 448k
$AAL - 414k
$IBM - 367k
$MSFT - 362k
$NFLX - 329k
$MARA - 308k
$META - 277k
$SOFI - 262k
Read Full Story »»»
DiscoverGold
Largest stocks that report earnings tomorrow
By: Evan | January 25, 2024
• Largest stocks that report earnings tomorrow
American Express $AXP
Colgate $CL
Norfolk Southern $NSC
First Citizens Bancshares $FCNCA
Booz Allen $BAH
Autoliv $ALV
Gentex $GNTX
Moog $MOG.A
Badger Meter $BMI
First Hawaiian $FHB
Read Full Story »»»
DiscoverGold
All these stocks hit new 52 week highs at some point today
By: Evan | January 25, 2024
• All these stocks hit new 52 week highs at some point today
Microsoft $MSFT
Google $GOOGL
Amazon $AMZN
Berkshire Hathaway $BRK.B
$AMD
Caterpillar $CAT
Qualcomm $QCOM
Micron $MU
$UBER
ServiceNow $NOW
$IBM
General Electric $GE
Accenture $ACN
Applied Materials $AMAT
$ASML
BNY Mellon $BK
$CRH
Cognizant $CTSH
Doordash $DASH
$DELL
Digital Realty $DLR
Energy Transfer $ET
General Dynamics $GD
Intuit $INTU
Lam Research $LRCX
Marriot $MAR
Marvell $MRVL
News Corp $NWSA
Regeneron $REGN
Ross Stores $ROST
Seagate $STX
Take-Two $TTWO
Textron $TXT
Workday $WDAY
Western Digital $WDC
Read Full Story »»»
DiscoverGold
The internal condition of the S&P 500 Technology sector is excellent. In the past month, a breadth composite surpassed 68% on two occasions, an achievement not witnessed since Q3 2009.
By: Dean Christians | January 25, 2024
• The internal condition of the S&P 500 Technology sector is excellent.
In the past month, a breadth composite surpassed 68% on two occasions, an achievement not witnessed since Q3 2009.

Read Full Story »»»
DiscoverGold
A variety of tech calls just flooded the tape
By: Cheddar Flow | January 25, 2024
• A variety of tech calls just flooded the tape

Read Full Story »»»
DiscoverGold
Money managers Increased their exposure to the US Equity markets since last week...
DiscoverGold
NAAIM Exposure Index
January 25, 2024
The NAAIM Number
84.13
Last Quarter Average
67.81
»»» Read More…
|
Followers
|
178
|
Posters
|
|
|
Posts (Today)
|
0
|
Posts (Total)
|
68007
|
|
Created
|
06/10/03
|
Type
|
Free
|
| Moderators DiscoverGold | |||
:::::::::::: Welcome to S&P 500 & Nasdaq Analysis and Trends :::::::::::::
• The purpose of this board is to help others with Short & Long term S&P 500 & Nasdaq analysis and direction.
• This is strickly an educational board helping traders to learn market direction, swing and bottom trading.
• I ask that everyone respect opinions on the board whether you agree with them or not. We are all here to make money and avoid the
minimum loss we can.
Rules of the Board
Most of this board's WATCHERS are "lurkers" who appreciate info available without the need to sift through tons of "empty" posts.
1. Respect everyone opinions on trades.
2. No Pumping of Stocks.
3. No OTCBB or PINK STOCKS
*********************************************************************************************************
To help us evaluate our performance, please "BoardMark" the board if you find it useful.
To do so, just click on "Add to Favorites" Button at Right just above the Posts Dates.
 Presently, the Board has 178 Boardmarks, Thank you!
*Information Posted on this Board is not Meant to Suggest any Specific Action, But to Point Out the Technical Signs That Can Help Our Readers Make Their Own Specific Decisions. Your Due Deligence is a Must.
EXCHANGE TRADED FUNDS~ETFs COMPONENTS~RSI and I/V charts#msg-5495097 COMPONENTSFOR ^NDX / QQQQ ~ I/V charts #msg-9787995
Gold~ Silver~ HUI~ XAU~ US$~ €uro~ Crude #msg-29347660 (thanks,bob)
Cookies/Bandwidth/Security/Privacy #msg-9353921 PIEs/Cookies/Macromedia/Flash #msg-9412363 PerformanceTips for WinXP #msg-9854670
| Volume | |
| Day Range: | |
| Bid Price | |
| Ask Price | |
| Last Trade Time: |


