Register for free to join our community of investors and share your ideas. You will also get access to streaming quotes, interactive charts, trades, portfolio, live options flow and more tools.
$GDX made a swing high today. The key level below is 31.55
By: CyclesFan | June 6, 2022
• $GDX made a swing high today. The key level below is 31.55. A break below that would mean it has started the decline into the next daily cycle low that may happen as early as June 27. If the daily cycle topped on day 14 it means the May low is in danger of being taken out.

Read Full Story »»»
 DiscoverGold
Central banks bought 19.4 tonnes of gold in April, remain net buyers in 2022 - WGC
By: Neils Christensen | June 6, 2022
Central bank gold demand is attracting new attention in 2022; however, official reserves have been "meandering" between buyers and sellers, according to the latest report from the World Gold Council.
Monday, the WGC said that central banks were again net purchases of the precious metal with global reserves increasing by 19.4 tonnes in April.
"So far in 2022, central banks' monthly gold reported activity has been bobbing between net purchases and sales linked to a fairly small number of banks. As such, any significant purchase or sale from those can tip the balance in a given month," wrote Mukesh Kumar, Senior Analyst at the WGC, in the latest report.
According to the latest reserve data, four central banks were the primary purchasers in April. Uzbekistan bought 8.7 tonnes of gold; Kazakhstan increased its gold reserves by 5.3 tonnes. The WGC noted that this is the first increase for both countries this year and follows three months of consecutive selling.
Turkey continued its gold buying this year, adding a further 5.6 tonnes, taking its gold reserves to 436.7 tonnes, representing 27.8%. Finally, India increased its gold holdings by a fractional 0.9t to 761.3t.
On the selling side, Germany sold 0.9 tonnes of gold in April, which the WGC said was likely related to coin-minting. Both Mexico and Czech Republic both sold 0.1 tonnes of gold.
"On a year-to-date basis, central banks remain net purchasers on the whole. Egypt is the largest buyer following its chunky 44.1t purchase in March, but Turkey is not far behind, having bought 42.5t to the end of April. Kazakhstan and Uzbekistan remain the largest sellers so far in 2022 despite the purchases in April," said Kumar.
Although the Czech Republic has been selling its gold, newly appointed central bank governor Aleš Michl said that he plans to increase the nation's gold reserves to 100 tonnes.
Central bank gold demand has been attracting new attention this year due to Russia's ongoing invasion of Ukraine. As a result, Western Nations, led by the U.S., have imposed significant sanctions against Russia. According to market analysts, the weaponization of the U.S. dollar could prompt some central banks to increase their gold holdings and diversify away from the U.S. dollar.
In a recent report, analysts at Société Générale said that developing country central banks could lead the charge in gold demand.
"The current freeze of some of Russia's central bank reserve assets highlights the risks inherent in some USD-based holdings, including Treasuries, in a context in which most central banks have expressed a wish to 'de-dollarize' their asset allocations. From low starting points, non-OECD countries have increased their gold holdings, but remain significantly underinvested compared to OECD countries," the analysts wrote in the report.
"If our reasoning proves right and non-OECD central banks increase their gold holdings by, let's say, 5% – in theory, they could go much higher given their current very low weighting versus OECD central banks – that would represent the equivalent of 475 tonnes of gold."
Moe Zulfiqar, research analyst at Lombardi Financial, said that growing central bank demand could be the significant driver in pushing gold prices to $3,000 an ounce.
"Central banks need gold as the world becomes more polarized and currencies get questioned. The yellow precious metal has a history of preserving wealth in times of currency devaluation and crisis. Central banks know this well. They hold a lot of currency in their reserves and will need a lot of gold to hedge against volatility," said Zulfiqar.
Read Full Story »»»
 DiscoverGold
Gold acting dum as usual. Bots are in total control of chaotic trading patters.
Jack Chan: Gold Price Exclusive Update
By: Jack Chan | June 4, 2022

Our proprietary cycle indicator is down, but bottoming.
To public readers of our updates, our cycle indicator is one of the most effective timing tool for traders and investors. It is not perfect, because periodically the market can be more volatile and can result in short term whipsaws. But overall, the cycle indicator provides us with a clear direction how we should be speculating.
Investors
During a major buy signal, investors can accumulate positions by cost averaging at cycle bottoms, ideally when prices are at or near the daily 200ema.
During a major sell signal, investors should be hedged or in cash.
Traders
Simply cost average in at cycle bottoms when prices are at or near the daily 200ema; and cost average out at cycle tops when prices are above the daily 50ema.

Gold sector is on long term BUY signal, suggesting that the correction since 2020 has been completed.

GLD is on short term buy signal.

GDX is on short term buy signal.

XGD.to is on short term buy signal.

GDXJ is on short term buy signal.
Analysis

Speculation rising from level of previous bottoms.

Our ratio is on buy signal.

Trend is up for the dollar.

$HUI is testing support.
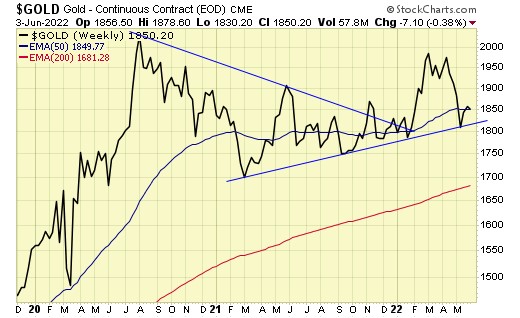
Gold is testing support.

The inverted head & shoulder is in progress.
Summary
Long term – on BUY signal.
Short term – on buy signals.
Gold sector cycle is down but bottoming.
Speculation has reached level of previous bottoms, expect overall higher prices.
$$$ We are holding a core position and will continue to accumulate positions.
Read Full Story »»»
 DiscoverGold
NY Gold Futures »» Weekly Summary Analysis
By: Marty Armstrong | June 4, 2022
This market made a new high today after the past 2 trading days. The market opened higher and closed lower. The immediate trading pattern in this market has exceeded the previous session's high intraday reaching 187860. Therefore, this market closed below the opening print while also closing down from the previous closing.
Presently, we have not broken out and it still remains below our uptrend technical resistance projection which stands at 186718.
Clearly, this market is still above the critical support point at this time, which lies at 184103. This market has exceeded intraday 2 of three projected resistance points and it has closed below 2 others. Our underlying pivot providing some support lies at 184364 and a close below this level will warn of a shift to retest support. Presently, the projected extreme resistance stands at 190593.
Additionally, our central point cyclical study models also ended in a bearish mode for the closing warning that the upward momentum is subsiding. Given the fact that we have made a new high and this study just turned down today, caution is advised that this may prove to be a temporary high and a break of today's low of 184970 would tend to confirm that possibility. Furthermore, the short-term Stochastics have also signaled a possible crash is likely. During the last session, we did close above the previous session's Intraday Crash Mode support indicator which was 179250 settling at 187140. The current Crash Mode support for this session was 183580 which we closed above at this time. The Intraday Crash indicator for the next session will be 184364. Remember, opening below this number in the next session will warn that the market may enter an abrupt panic sell-off to the downside. Now we have been holding above this indicator in the current trading session, and it resides lower for the next session. If the market opens above this number and holds above it intraday, then we are consolidating. Prevailing above this session's low will be important to indicate the market is in fact holding. However, a break of this session's low of 184970 and a closing below that will warn of a continued decline remains possible. The Secondary Intraday Crash Mode support lies at 181075 which we are trading above at this time. A breach of this level with a closing below will signal a sharp decline is possible.
Intraday Projected Crash Mode Points
Today...... 183580
Previous... 179250
Tomorrow... 184364
This market has not closed above the previous cyclical high of 186910 while it has exceeded that level intraday. Obviously, it is pushing against this resistance level.
ECONOMIC CONFIDENCE MODEL CORRELATION
Here in NY Gold Futures, we do find that this particular market has correlated with our Economic Confidence Model in the past. The Last turning point on the ECM cycle low to line up with this market was 2015. The Last turning point on the ECM cycle high to line up with this market was 2020 and 2011 and 1996.
MARKET OVERVIEW
NEAR-TERM OUTLOOK
The historical perspective in the NY Gold Futures included a rally from 2015 moving into a major high for 2020, the market has been consolidating since the major high with the last significant reaction low established back in 2015. The market is still holding above last year's low. The last Yearly Reversal to be elected was a Bullish at the close of 2020.
This market remains in a positive position on the weekly to yearly levels of our indicating models.
Looking at the indicating ranges on the Daily level in the NY Gold Futures, this market remains moderately bearish position at this time with the overhead resistance beginning at 185190 and support forming below at 183760. The market is trading closer to the resistance level at this time. An opening above this level in the next session will imply a bounce is unfolding.
On the weekly level, the last important high was established the week of May 30th at 187860, which was up 2 weeks from the low made back during the week of May 16th. So far, this week is trading within last week's range of 187860 to 183020. Nevertheless, the market is still trading downward more toward support than resistance. A closing beneath last week's low would be a technical signal for a correction to retest support.
Looking at this from a broader perspective, this last rally into the week of May 30th reaching 187860 failed to exceed the previous high of 200300 made back during the week of April 18th. That rally amounted to only two typical reaction weeks. Right now, the market is neutral on our weekly Momentum Models warning we have overhead resistance forming and support in the general vacinity of 179720. Resistance is to be found starting at 187090. Looking at this from a wider perspective, this market has been trading up for the past 9 weeks overall.
INTERMEDIATE-TERM OUTLOOK
YEARLY MOMENTUM MODEL INDICATOR
Our Momentum Models are declining at this time with the previous high made 2020 while the last low formed on 2021. However, this market has rallied in price with the last cyclical high formed on 2020 and thus we have a divergence warning that this market is starting to run out of strength on the upside.
Critical support still underlies this market at 175200 and a break of that level on a monthly closing basis would warn that a sustainable decline ahead becomes possible. Immediately, the market is trading within last month's trading range in a neutral position.
 DiscoverGold
 A Bit Of A Sticky Place In Metals
By: Avi Gilburt | June 2, 2022
• Following the Elliott Wave analysis:
As I have been saying for several weeks now, the silver chart has been providing us with the clearest signals in the metals complex. Therefore, I have been hyper-focused on silver of late.
But, even where silver is positioned right now does cause a bit of consternation. You see, the structure into last week’s high did not clearly look complete. Rather, there is a reasonable interpretation that would suggest that high is a (b) wave within an expanded b-wave structure, as I have outlined on the 8-minute silver chart. Therefore, the 5-wave decline we just saw into today’s low could easily be a [c] wave within a b-wave.
But, in order for that expanded structure to be accurate, we need to see a clear 5-wave rally off today’s low. And, I cannot say that this is what the silver market has clearly presented to us today. Rather, it is looking a bit more like a 3-wave rally structure thus far.
Therefore, if we see an impulsive decline from today’s high, that will likely signal that wave iv (red) is indeed complete, and that we have begun a decline in wave v of the c-wave of [2], pointing us down into the 19-20 region.
Now, if you have been following closely, you would know that I am almost “hoping” for a lower low in the GDX. That would re-set the count, as shown in yellow, and likely set us up to start a true impulsive rally. That type of rally would be much more tradable than a diagonal structure. Until then, I am giving GDX a bit of room to let me know if we can get that lower low or not. And, if we get that lower low, it will be completed with a positive divergence on the daily chart, which would make that lower low a strong buying opportunity.
And, as far as GLD, well, I think we may be stuck in a larger diagonal, so even though I do expect much higher to be seen in the coming year or so, I do not think the structure will be easily tradable.

GDXdaily

GLDdaily

silver-8min

Silver-144min
Read Full Story »»»
 DiscoverGold
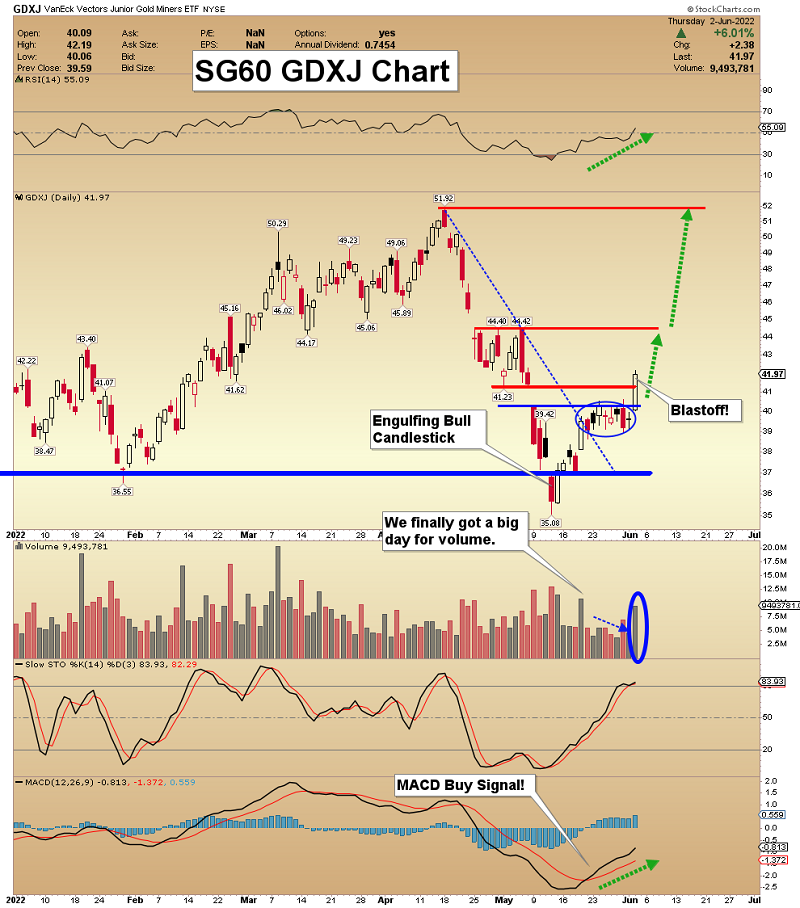
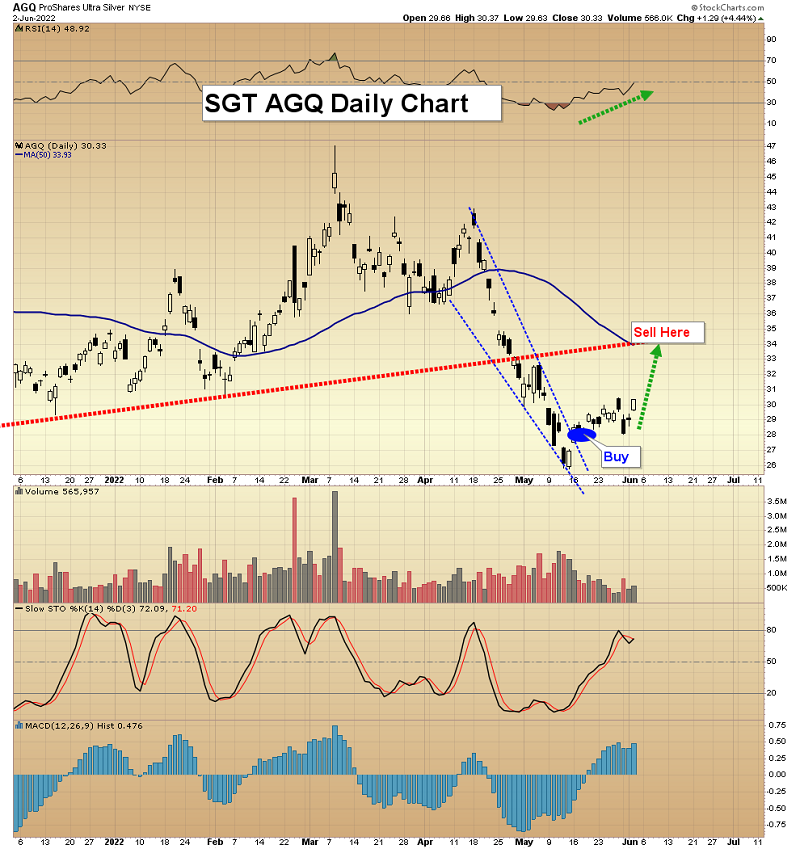
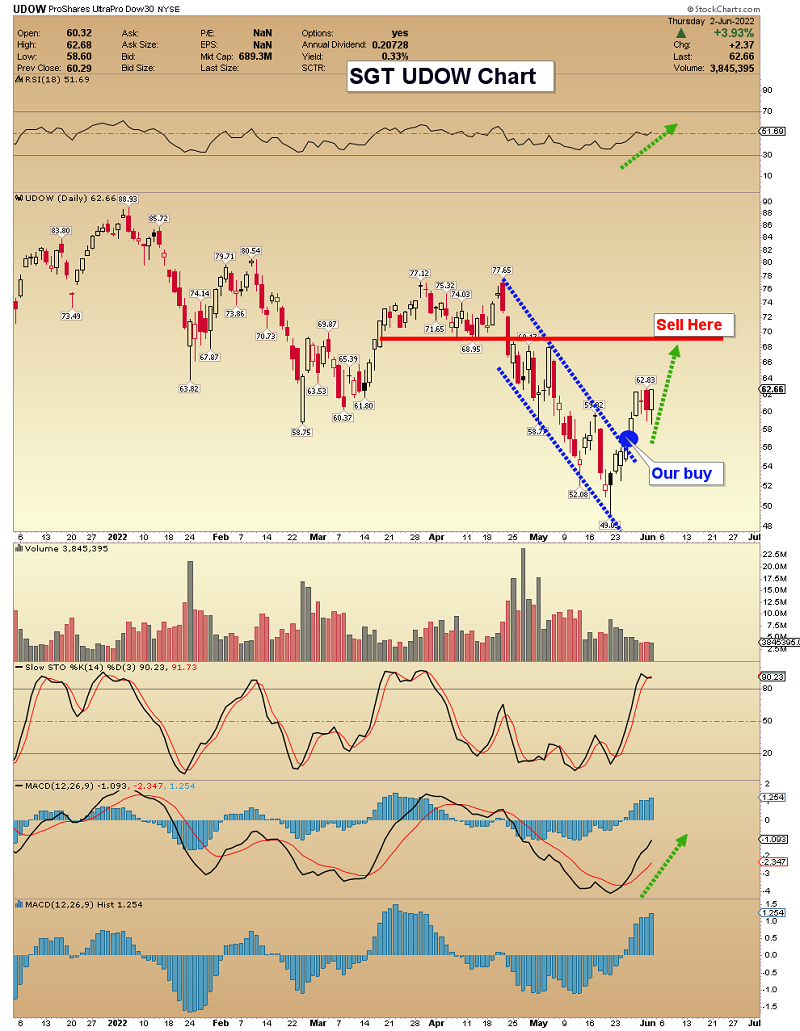
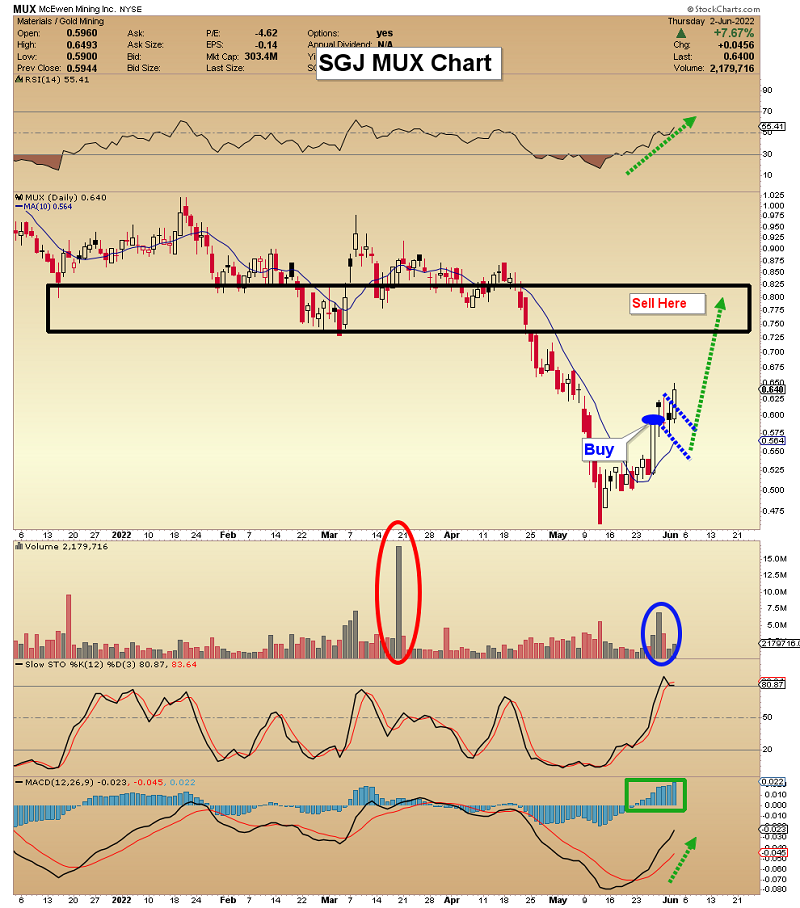
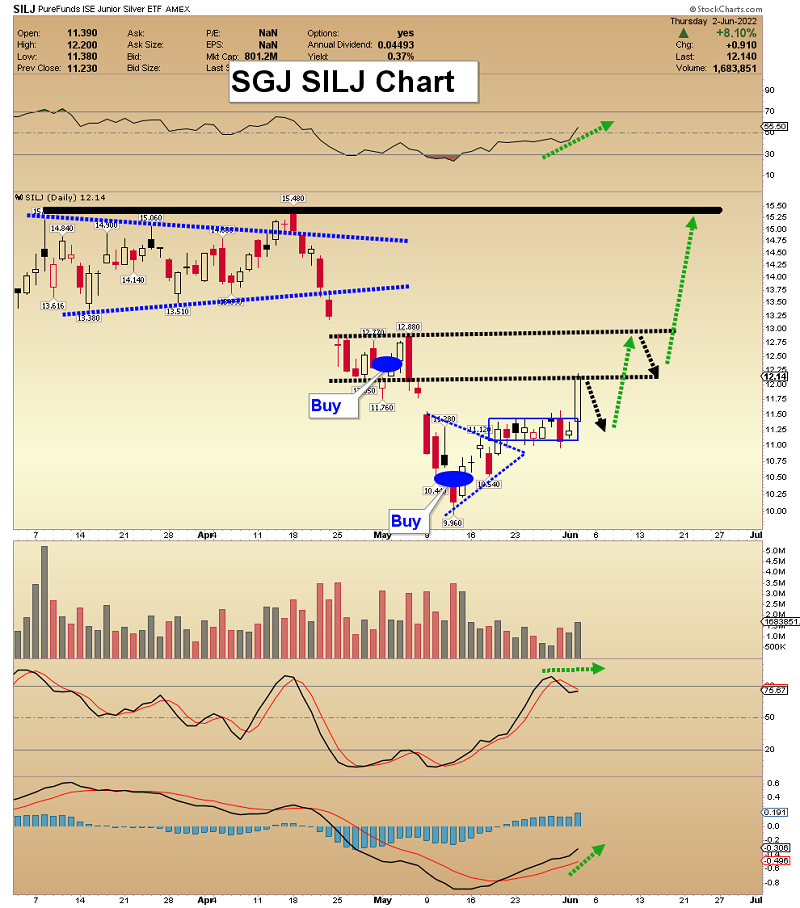
Gold & Silver Stocks Upside Blastoff Begins
By: Morris Hubbartt | June 4, 2022
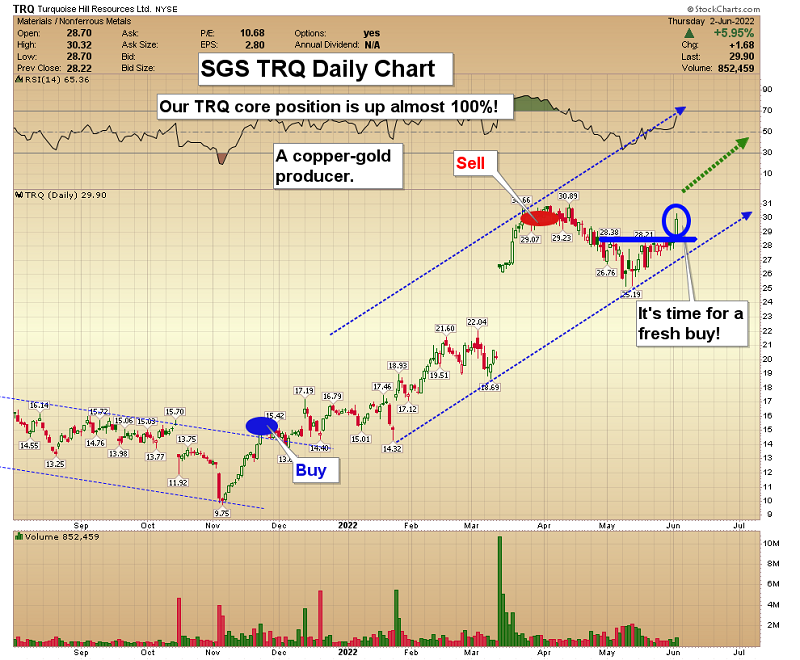
Super Force Signals (SFS) is being rebranded as Super Gold Signals (SGS at https://supergoldsignals.com), to reflect the growing global importance of gold.
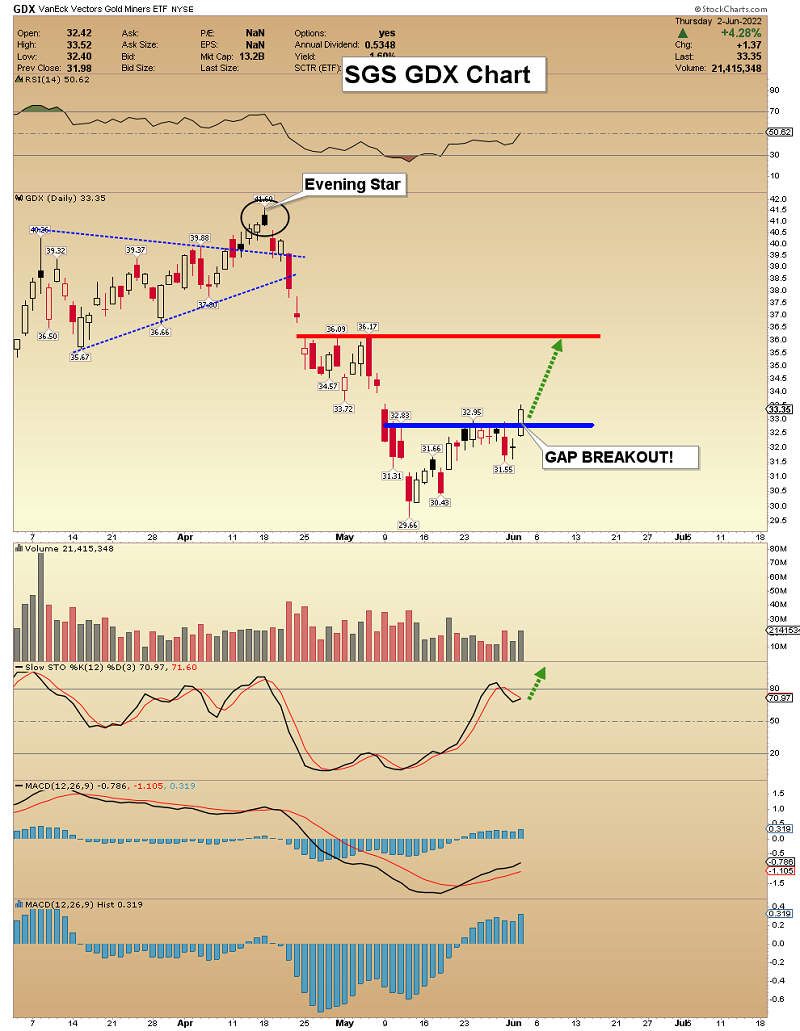
SG60 Key Charts, Signals, & Video Analysis
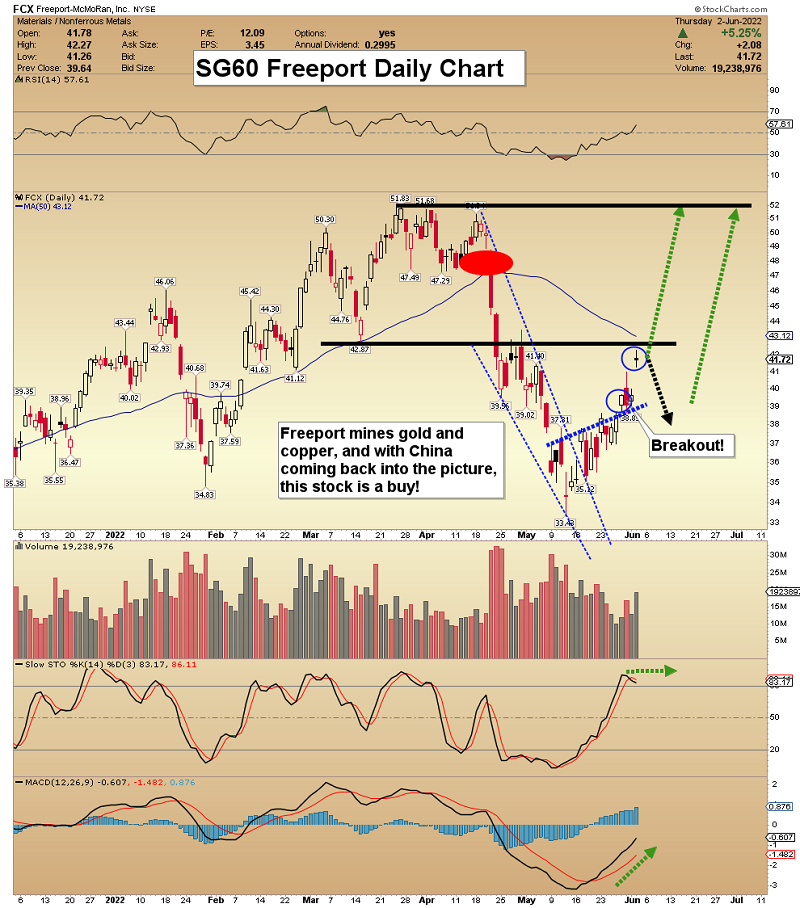
SGT Key Charts, Signals, & Video Analysis
SGJ Key Charts, Signals, & Video Analysis
If readers are interested in junior “blastoff” plays like MUX, KOS, and SILJ, my SGJ newsletter at only $249/year could be ideal. I’m doing a Blastoff Special special of just $199 for 14 months, good through this weekend! Click here or send me an email if you want the offer, and we’ll do it. Thank-you.
Read Full Story »»»
 DiscoverGold
Top 10 largest gold mining companies in 2021 ranked by reserves - report
By: Vladimir Basov | June 3, 2022
Kitco ranked gold mining companies based on their most recent reported attributable proven & probable reserves in-situ.
Russian gold mining giant Polyus boasts the largest gold reserves base globally. As at 31 December 2021, the company reported 101 million ounces of gold in reserves compared to 104 million ounces of gold as at 31 December 2020. The company said that changes in the estimates from 2020 to 2021 are due to depletion by mining and changes to stockpile inventories due to additions from mining and reclaim for processing, adding that 40% of the company’s estimated ore reserves are attributable to Polyus’ key greenfield project, Sukhoi Log.
Newmont has the second largest gold reserves base across the industry.
For 2021, Newmont reported 92.8 million ounces of gold mineral reserves, slightly lower than the prior year total of 94.2 million ounces. The company said that depletion of 7.1 million ounces and unfavorable net revisions of 0.8 million ounces were largely offset by additions of 6.5 million ounces.
Barrick is third with 69 million ounces of gold reserves reported in 2021, a minor increase over 2020 (68Moz). Reserve replenishment, net of depletion, was achieved at three of Barrick’s tier one gold assets – Kibali, Cortez and Turquoise Ridge – while Bulyanhulu, North Mara, and Phoenix also all achieved this milestone.
Newcrest sits fourth. The company reported 54 million ounces of gold as at 31 December 2021, a 10% increase compared to 2020 (49Moz). The company said that Red Chris ore reserves initial estimates added 5.6 million ounces of gold; Havieron ore reserve initial estimate added 0.65 million ounces of gold; and Lihir added one million ounces of gold in probable reserves, underpinned by completion of the Phase 14A pre-feasibility study.
Gold Fields is fifth with 47.4 million ounces of gold in reserves reported in 2021 compared to 50.3 million ounces in 2020. A 6% decrease in reserves over 2020 was primarily driven by an increase in cut-off grades, updated resource models and enhanced South of Wrench area mine design and scheduling at South Deep.
On February 8, 2022, the merger of Agnico Eagle with Kirkland Lake Gold was completed. At December 31, 2021, Agnico Eagle's proven and probable mineral reserves were a record 25.7 million ounces of gold. At December 31, 2021, Kirkland Lake Gold's proven and probable mineral reserves were 18.9 million ounces of gold. Therefore, combined gold reserves of the merged company amounted to 44.6 million ounces as at December 31, 2021. Hence, Agnico Eagle sits sixth.
Kinross’ total estimated proven and probable gold reserves at December 31, 2021 were approximately 32.6 million ounces. The increase of 2.7 million ounces in estimated gold reserves compared to December 31, 2020 was mainly a result of the conversion of 3.0 million ounces of resources to probable reserves at Chulbatkan.
Harmony Gold’s total attributable gold mineral reserves amounted to 31.4 million ounces at 30 June 2021, a 32% increase on the 23.8 million ounces declared at 30 June 2020. The gold reserve ounces in South Africa represent 58% while the Papua New Guinea gold reserve ounces represent 42% of Harmony’s total mineral reserves as at 30 June 2021.
AngloGold Ashanti’s ore reserves increased from 29.7 million ounces in December 2020 to 29.8 million ounces in December 2021. This annual net increase of 0.1 million ounces includes additions due to exploration and modelling changes of 4.1 million ounces. This increase was partially offset by depletion of 2.6 million ounces and reductions due to other factors of 1.4 million ounces.
In 2021, Polymetal’s gold reserves increased by 9% year-on-year
to 27.1 Moz on the back of successful near-mine exploration at Nezhda, Veduga and Kutyn (Albazino hub), as well as initial reserve estimates at Elevator (Varvara hub), Saum (Voro hub), and Nevenrekan (Omolon hub).

Read Full Story »»»
 DiscoverGold
Fed Reloads Gold Stocks
By: Adam Hamilton | June 3, 2022
The gold miners’ stocks collapsed into mid-May, exasperating contrarian traders. Plunging gold stocks were amplifying a sharp gold selloff, which was driven by heavy gold-futures selling fueled by a monster US-dollar rally. That anomalous carnage gutted sentiment, leaving this sector grinding along near lower support and mired in herd bearishness. But that major drawdown reloaded the gold stocks for big upside.
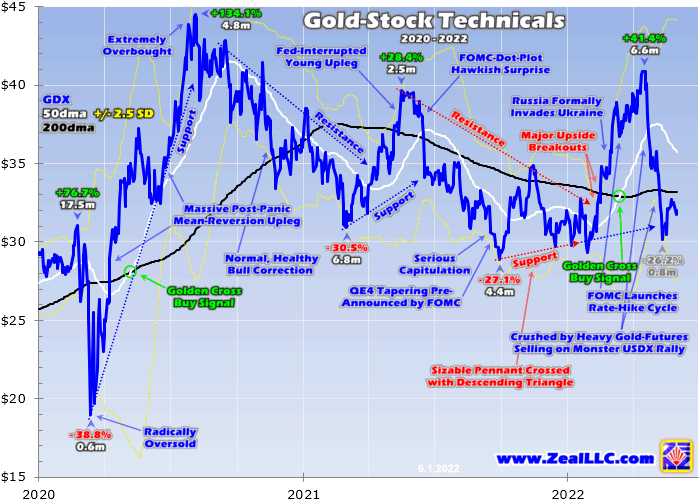
While deeply out of favor now, the gold miners’ stocks were faring well and gaining popularity before that recent drubbing. That was readily evident in the GDX VanEck Gold Miners ETF, which has long been this sector’s leading benchmark and trading vehicle. The gold stocks were thriving into mid-April, with GDX up a strong 27.6% year-to-date. That trounced the flagship S&P 500 stock index, which fell 7.9% in that span.
Those excellent 2022 gains were part of a larger GDX bull-market upleg, which extended to +41.4% over 6.6 months. Yet that was still small compared to GDX’s previous five uplegs during this secular bull, which averaged awesome 85.0% gains! This latest young upleg had lots of room to run, buttressed by strong spring-rally seasonals into late May. But then everything went pear-shaped, utterly derailing that upleg.
Vexed traders capitulated and fled, abandoning this high-potential sector. But the causal chain of market events slamming gold stocks was exceedingly-unusual, has fully run its course, and was so unique that it can’t be repeated. So that anomalous sector setback has created fantastic buying opportunities in now-battered gold stocks. The Federal Reserve was the culprit behind GDX plunging 26.2% in just 18 trading days!
The Fed just executed its most-extreme policy shift ever in its century-plus history! Back in March 2020 the S&P 500 plummeted 33.9% in just over a month, in a full-blown stock panic over pandemic-lockdown fears. Dreading a resulting economic depression, Fed officials freaked out. Their Federal Open Market Committee slammed its federal-funds rate to zero, and redlined its monetary printing presses to crazy extremes.
The Fed kept that zero-interest-rate policy in place until mid-March 2022, when it launched a new rate-hike cycle. Way more importantly, the Fed also ballooned its balance sheet by an insane 115.6% or $4,807b over just 25.5 months into mid-April 2022! Effectively more than doubling the US monetary base in just a couple years, that radically-unprecedented quantitative easing spawned today’s raging inflation.
Vastly-more money conjured out of thin air was injected into the system, which soon started chasing and bidding up the prices on far-slower-growing goods and services. Legendary American economist Milton Friedman warned in 1963 that “Inflation is always and everywhere a monetary phenomenon.” Last year as reported headline inflation mounted and grew red-hot, Fed officials realized they had to reverse course hard.
So they started jawboning about a coming rate-hike cycle and slowing QE4’s epic money printing. Their tightening talk has only grown more aggressive this year, peaking between mid-April to mid-May when the gold stocks plunged. It has profoundly impacted the entire financial markets, nearly bludgeoning the S&P 500 itself into a new bear. The US stock markets plunged 18.7% at worst from early January to mid-May!
Just two days after hitting an all-time high as 2022 dawned, heavy selling erupted after minutes from the FOMC’s mid-December meeting. They revealed Fed officials were already discussing soon ramping up quantitative tightening to destroy some of QE4’s vast torrents of money printing. Removing the majority of that from the system is probably the only way to stake this inflation beast, but bearish for QE4-levitated stocks.
Fed officials’ hawkish jawboning grew more extreme as 2022 marched on, crescendoing in that mid-April-to-mid-May timeframe when gold stocks were gutted. After hiking the FFR just 25 basis points off ZIRP in mid-March, Fed officials wanted to convince traders that hiking pace needed to accelerate dramatically to fight red-hot inflation. So they increasingly forecast bigger 50bp hikes, and markets feared huge 75bp ones!
The FOMC indeed hiked a half-point at its next meeting in early May, its first 50bp rate hike dared since May 2000 which helped burst the dot-com bubble. In his subsequent press conference, the Fed chair warned “there’s a broad sense on the Committee that additional 50-basis-point increases should be on the table for the next couple of meetings.” This tightening cycle is shaping up to be the fastest since the late-1980s!
Piling on the epic hawkishness, QT jawboning was extreme too. In early April the Fed vice-chair gave a speech calling for bigger-and-faster QT, “I expect the balance sheet to shrink considerably more rapidly than in the previous recovery, with significantly-larger caps and a much-shorter period to phase in the maximum caps.” The Fed’s original QT1 gradually ramped from $10b per month to $50b over an entire year.
At that same wildly-hawkish early-May FOMC meeting where the Fed hiked 50bp and promised a couple more half-point jumps soon, it revealed QT2. That would start at $47.5b of monthly bond runoffs in this current June, and double to $95b monthly just three months later in September! QT has never before been attempted at this scale, and QT1 was prematurely killed soon after hitting terminal velocity in Q4’18.
The Fed caved on unwinding QE1, QE2, and QE3 with QT1 because the S&P 500 plunged 19.8% to the verge of a new bear market. QT1 only unwound 22.8% of those earlier QE money-printing campaigns, a far cry from the half-unwind Fed whisperers predicted when QT1 launched. But with inflation raging, the Fed pegged QT2 at nearly-double QT1’s final monthly pace blasting to full-steam in just a quarter of the time!
The crucial takeaway for gold stocks is the Fed has never before done such an uber-hawkish hard pivot in its entire century-plus history! A big FFR hike with more promised soon combined with big QT monetary destruction at wildly-unprecedented levels is something never before witnessed. And Fed officials can’t repeat the extreme shock of rapidly transitioning from ZIRP and QE4 to this new tight monetary regime again.
This recent epic Fed hawkishness didn’t directly hammer gold stocks lower, as they really don’t care what the FOMC is doing. All that matters to the gold miners is the price of gold, which is influenced by the Fed’s machinations. The primary driver of gold’s short-term price action is leveraged gold-futures trading. Low margin requirements enable huge leverage around 25x+, which is crazy-risky necessitating a myopic focus.
As gold has been the ultimate global currency for millennia, gold-futures speculators watch the fortunes of the US dollar for their main trading cues. When the dollar rallies, they usually sell gold futures which has an outsized impact on gold’s price due to their extreme leverage. The US dollar in turn is heavily affected by the FOMC’s monetary-policy direction, as interest-rate differentials are important in world currency trading.
So gold stocks follow gold, which is often slaved to leveraged gold-futures trading, which usually runs inverse to the US dollar, which is very dependent on what the Fed is doing! This casual mechanism is the sole reason gold stocks were eviscerated in that month between mid-April to mid-May. This multi-year GDX chart for perspective and scale really illuminates how violent that Fed-spawned gold-stock plunge proved.
The leading US Dollar Index benchmark for this world reserve currency started marching higher in mid-January as new-rate-hike-cycle Fedspeak mounted. The USDX shot up again into early March on safe-haven buying after Russia invaded Ukraine, but stalled for the rest of that month consolidating its gains. Then the USDX started rallying solidly again in early April, but not fast enough to shake loose gold-futures selling.
Although the USDX surged a strong 5.3% higher between mid-January to mid-April, that didn’t faze the gold-futures speculators. Goosed by Russia’s war against Ukraine, gold surged 8.5% higher during that exact span! The major gold stocks dominating GDX amplified that mightily to a hefty 30.2% gain! That made for great 3.6x upside leverage to gold, better than GDX’s usual 2x-to-3x range on material gold moves.
Everything was awesome in contrarian-land until a catalytic inflation report in mid-April. That latest March print of the US Consumer Price Index came in up a red-hot 8.5% year-over-year! That was its fastest rise since December 1981, a scary 40.3-year high underscoring the first inflation super-spike since the 1970s is underway. The next day the wholesale Producer Price Index shot up a record-for-this-iteration 11.2% YoY!
So market-implied rate-hike expectations started to soar, and Fed officials upped the hawkishness of their jawboning. The USDX started nearly shooting parabolic that day, as gold closed at $1,977 while GDX neared its $40.87 upleg high. Over the next month between mid-April to mid-May, the USDX rocketed another incredible 4.9% higher! That’s a monster surge in the usually-glacial world of major currencies.
That huge dollar rally peaked at an extraordinary 19.4-year USDX secular high in mid-May! How often does the US dollar rocket vertically on the most-extreme Fed-tightening pivot ever? Only once, this event was unique in market history. With the dollar blasting stratospheric, those hyper-leveraged gold-futures speculators ran for the exits dumping huge amounts of long contracts while ramping up their downside bets.
Their aggregate trading is only reported weekly in the famous Commitments-of-Traders reports, which are current to Tuesday closes. Over five CoT weeks from mid-April to mid-May, speculators sold a massive 59.8k long contracts and short-sold another 21.4k! That added up to enormous gold-equivalent selling of 252.6 metric tons, far too much for markets to absorb so fast. That pummeled gold prices sharply-lower.
Gold dropping 8.4% to $1,811 in that single wild month scared gold investors, who are mainly momentum players. So they soon started selling in sympathy, as evident in the combined holdings of the dominant GLD and IAU gold ETFs which are the best high-resolution proxy for global investment demand. From mid-April to mid-May those holdings shrunk 3.6%, which spewed another 59.1t of gold into world markets.
All that heavy gold-futures and gold-ETF-share selling hammering the yellow metal is the sole reason GDX plunged 26.2% within that same month-long span. That was a brutal kick in the teeth for gold-stock speculators and investors, slamming the miners’ stocks low enough to trigger a frustrating mass-stopping in mid-May. Cascading capitulation-like selling tripped even loose trailing stops, forcing out most traders.
While gold’s 200-day moving average which is major bull-market support largely held, GDX knifed down right through its own 200dma. The gold stocks didn’t find their own support until a lower zone extending from a big technical chart formation they broke out above earlier this year. That serious drawdown was challenging to weather psychologically, but it was bound to be short-lived. Market extremes never last long.
Once they set expectations for a series of consecutive big 50bp rate hikes and the biggest-and-fastest-ramping quantitative tightening ever attempted, Fed officials had to have hit peak-hawkishness. The lower their aggressive tightening batters stock markets into serious bear territory, the greater the odds the resulting negative wealth effect will spawn a severe recession or even a devastating full-blown depression.
And that wildly-overbought US Dollar Index can’t shoot parabolic to multi-decade highs for long. In fact it already started rolling over hard since cresting in mid-May. And despite their extreme leverage, the gold-futures speculators’ capital firepower is limited and finite. They can only do so much selling before they exhaust their longs to dump. Their heavy selling already reversed to buying in the latest CoT into late May.
The gold bounce that fueled already turned around identifiable investment-capital flows since mid-May as well. Those combined GLD+IAU gold-ETF holdings surged 21.7t higher in one week, already unwinding 3/8ths of their big mid-April-to-mid-May draw. And if gold is poised to mean revert higher and resume its interrupted upleg with the Fed’s hawkish shock passed, the gold stocks will follow it up amplifying its gains.
The gold miners’ fundamentals remain strong, making their anomalously-pummeled stock prices major bargains today. In mid-May as gold and gold stocks were bottoming, I analyzed the new Q1’22 operational and financial results they just reported. The GDX-top-25 gold miners dominating this sector earned hefty profits. Those should surge even higher later this year on expected better production and lower costs.
Gold’s own outlook remains incredibly-bullish too. Thanks to this profligate Fed’s extreme QE4 money printing, we are already in the first inflation super-spike since the 1970s which suffered two of them. Gold soared 196.6% higher during the first, which ran 30.0 months into a 12.3%-YoY CPI peak in December 1974! Then gold skyrocketed 322.4% in the second, that crested at a 14.8% CPI in March 1980 after 40.0 months!
Gold ought to at least double in today’s inflation super-spike after the Fed more than doubled the US money supply. And contrary to gold-futures speculators’ irrational paranoia, Fed-rate-hike cycles have actually proven bullish for gold. There have been a dozen before today’s in this modern monetary era since 1971. Through the exact spans of all twelve prior ones, gold averaged impressive 29.2% gains!
In eight of those where gold rallied after entering them relatively-low, its average gains soared to 49.0%! And in the other four where gold fell, its average losses were an asymmetrically-small 10.5%. Gold tends to thrive during Fed-rate-hike cycles because they are so darned bearish for stock markets. Sustained selling in bears naturally boosts gold investment demand for prudently diversifying stock-heavy portfolios.
So that anomalous gold-stock plunge from mid-April to mid-May effectively reloaded gold stocks for more big upside! Their prices were battered back down to major support from which their last prematurely-truncated upleg launched. That offers traders a rare second chance to deploy in this high-potential sector before it powers much higher. Raging inflation and a Fed-tightening-driven stock bear are super-bullish for gold!
If you regularly enjoy my essays, please support our hard work! For decades we’ve published popular weekly and monthly newsletters focused on contrarian speculation and investment. These essays wouldn’t exist without that revenue. Our newsletters draw on my vast experience, knowledge, wisdom, and ongoing research to explain what’s going on in the markets, why, and how to trade them with specific stocks.
That holistic integrated contrarian approach has proven very successful. All 1,296 newsletter stock trades realized since 2001 averaged outstanding +20.0% annualized gains! While we suffered a mass-stopping during gold stocks’ recent plunge, we’ve rebuilt our trading books with cheap fundamentally-superior mid-tier and junior gold and silver miners to ride their coming upside. Subscribe today and get smarter and richer!
The bottom line is the Fed just reloaded gold stocks for another big run higher. Their latest bull upleg was interrupted by the Fed’s most-extreme hawkish pivot ever witnessed. Fed officials transitioned into a big-and-fast new rate-hike cycle, and launched the most-aggressive QT monetary destruction ever attempted! That ignited a monster US-dollar rally which unleashed heavy gold-futures selling, slamming gold sharply-lower.
But that anomalous market event is already reversing, with the dollar rolling over and gold recovering on resuming buying from both gold-futures speculators and investors. The Fed’s shock-and-awe tightening jawboning has passed. Higher gold prices are very bullish for these battered gold stocks, which already have great fundamentals. So they are likely to rebound strongly as gold resumes powering higher on balance.
Read Full Story »»»
 DiscoverGold
Like for instance right now. It dropped to a little above 1846 a couple times, now it’s about 1850. I don’t care how much higher it goes, I saw the signal. It WILL go back to 1847.
I don’t blame you, I watched the ticker closely today, it was brought down with small fraction of a second trades that would later match that trade exactly with bid/ask range. It was precision, like a bot. If this much economic hell has not rocketed gold, I don’t know if anything will. I think smart money is getting outsmarted by algos. I’m contemplating big changes myself. Well big for me anyway. What’s also different this time is miners never caught up with gold price rise and normally it would lead and not be tied to gold with every pulse down but not up.
had to dump GDX earlier today at 33.93..;..this market is hard to keep anything. That is the way bear markets are....everything is a trade, unless you just decide to short and hold your breath.....looing at odds, I would say 2-1 that the S and P's next 500 pts are down, not up....GDx will be worth a repurchase at some point.
Gold just got tamped down to where nice run started yesterday
Another proposed major miner merger lifts the gold complex
By: David Erfle | June 3, 2022
In a sector where investor confidence is extremely low, mining companies re-kindled efforts last year to explore alliances and partnerships to bring promising projects online and share the risk between parties. Depleting gold reserves and asset scarcity, along with market pressure to bulk up company valuations, sent larger miners out seeking deals to boost growth and profitability.
As covid restrictions were being lifted, deal flow among gold miners increased significantly into late 2021 with the value of the top five gold mergers totaling $16.1bn.The volume of mergers and acquisitions (M&A) jumped last year as well, with the largest being the $10.6bn combination between Agnico Eagle Mines (AEM) and Kirkland Lake Gold announced in late September.
While there was a rush for deals directly followingthe announcement of this high-profile merger of equals, M&A activity slowed in the mining sector after Kinross Gold (KGC)forked out $1.4bn for Great Bear Resources in December. In fact, M&A deal flow had mostly dried up in the mining complex until this week.
On Tuesday, South African mining firm Gold Fields (GFI) announced a deal to buy Canada's Yamana Gold (AUY) in a $6.7bn, all-share deal. The proposed combination would turn two senior gold miners into the world's fourth largest producer.
The new Gold Fields could see its total output climb to 3.8 million ounces from 2024, which would make the company the third-biggest gold miner, CEO Chris Griffith said. Within a decade, Griffith sees Gold Fields potentially increasing production to 4.8 million ounces.
If the deal is approved, Gold Fields shareholders will end up with 61% of the combined $15.6 billion company, and Yamana Gold shareholders the remaining 39%.Gold Fields said Yamana's board has unanimously approved the deal, which is expected to close in the second half of 2022.
Since the 2010-2011 industry acquisition wave took place at a major top in the gold complex, global gold miners have returned to fundamentals and balance sheet health, over adding ounces at any price. After the industry acquisition wave during the previous gold boom left a legacy of over $80 billon of write-downs when gold prices crashed,recent M&A activityhas been taking place when sentiment is low and gold miners are on sale at depressed levels.
Just ahead of the Agnico/Kirkland deal being announced in late September of last year, the GDX struck a wash-out low of $28.33. The global gold miner ETF has yet to revisit this level, while printing a series of higher lows for the past eight months. In this space directly following the deal, I mentioned that we may look back on the high-profile Agnico/Kirkland deal announcement being instrumental in creating another significant bottom in the mining space.
As opposed to a flurry of over-priced deals that took place during a major mining cycle peak in 2010-2011, the high-profile Barrick/Randgold merger announcement in September of 2018 became the catalyst thatstruck a significant bottomin a deeply oversold mining complex as well.
Two weeks previous to the Barrick/Randgold announcement, the GDX struck a low of $16.69 in mid-September. This marked a significant low after a 2-year correction of out-sized sector gains from January to August 2016. After which, the global miner ETF proceeded to nearly double in 12 months.
The recent consolidation of the mining sector has just entered its 22nd month after peaking in August of 2020. Technical confirmation suggesting a GDX low may be in place would be a weekly close above $35 with strong volume.
Meanwhile, the GDXJ has been trending upwards after reaching a lower low on long-term support at $35 in mid-May. Up-sessions have been taking place on higher volume than down-sessions, signaling investor accumulation in the higher risk junior ETF. Technical confirmation suggesting a GDXJ low may be in place would be a weekly close above $47 with strong volume.
Just as the aforementioned high-profile deals began a wave of sector deal flow, I expect the proposed Gold Fields/Yamana merger to spark more M&A activity in the mining space and continue on a positive course into Q3. And in turn, may provide the catalyst to bring some much-needed generalist investor capital back into the mining space.
In an interview after the agreement with Gold Fields was announced on Tuesday,Yamana executive chairman Peter Marrone said the company considered other options before agreeing to be acquired by Gold Fields. This suggests there are discussions for other prospective deals in the gold industry.
"We cannot be, and should not be, the only company that is considering being part of something bigger," Marrone said. He also mentioned discussions in the industry seem to be taking place. "Anecdotally, they've been taking place with us, so that suggests they've been taking place more broadly as well," he said.
While underground gold reserves held by major mining firms continue to be low and falling, new reserves are becoming increasingly harder to find as resources are used up, and exploration has become more costly. Major mining companies have a few ways to remedy their shortages. They must either discover new underground resources through exploration, or acquire them via the takeover of junior development companies.
After years of underinvestment during the previous bear market, global miner production profiles are under pressure which makes further M&A inevitable during the next few years. The current situation in the mining space has provided an opportunity for global mining companies using strategic M&A to position themselves in becoming the clear winners during the next decade.
This is a good time for resource stock speculators to take advantage of the current weakness in the mining complex to perform proper due diligence on a carefully selected watch list of quality juniors. If you require assistance in choosing a basket of M&A candidates, and would like to receive my research, newsletter, portfolio, watch list, and trade alerts, pleaseclick here for instant access.
Read Full Story »»»
 DiscoverGold
Gold is acting kinda dumb again today at first glance, which means I’m gonna watch it close just to prove that criminals are manipulating it as usual.
yep I loaded the boat with this yesterday. Luckily. I added things up:
pro dollar: 1. currency, 2. euros know their own currency is shot to hell so they give our currency a daily infusion of capital.
Anti: 1. The annual trillion dollar deficits are probably beyond a failsafe point. Owing 10 trillion is one thing, but 31 trillion with rising rates is a disaster. Every point higher requires 300 billion in interest, without taking off any of the debt itself.
2. With this administration, they think nothing of adding on another 2 or 3 trillion per year, especially if we have a recession where tax revenues dry up.
3. Clearly the war shows the u.s. thinks nothing of stealing money of the dollars owned by other countries, which is in the international, SWIFT BANKING SYSTEM. U.s. has confiscated 300 billion dollars of Russian reserves in the Swift system.........\j Every country now on earth say that move and is taking steps to get out of dollars, or at least downsize away from them. And gold is a nice way to diversify. 4. All the other countries have completely blown out their own fiat currencies....everybody knows what is gonna happen over the next 5 to 20 years.
But what I really think has started this next leg up, which started today, is america stealing russian's money, because russia would not do what america wanted in Ukraine. All countries now know that america can grab their money any time they want.
Jobless, labor costs, and poor factory orders says hi Ho silver and gold again.
Gold is absolutely controlled completely today. And I don’t know if it likes 1842 or maybe lower. It looks to me like it’s ready to drop again imo.
Best Gold Stocks To Buy In June
By: Vladimir Zernov | May 31, 2022
• Newmont Corporation and Barrick Gold will benefit from the continuation of the gold market rebound.
Key Insights
• Gold found support near the $1800 level and is trying to settle above the $1850 level.
• Gold stocks have also started to rebound as speculative traders moved back into this market segment.
• Newmont and Barrick Gold are trading at 16 forward P/E, which is a reasonable valuation for leading gold mining companies.
Shares of gold stocks have recently rebounded as Treasury yields pulled back from highs. Leading gold stocks will likely lead the way in case this rebound continues.
Newmont Corporation
Analyst estimates for Newmont have been moving higher in recent months despite the pullback in gold markets.
Currently, the company is expected to report earnings of $4.12 per share in the current year and $4.18 per share in the next year, so the stock is trading at 16 forward P/E.
While Newmont is not extremely cheap, traders are ready to pay a premium for one of the leading gold mining companies of the world. The stock will remain one of the primary bets on the potential upside in the gold markets due to Newmont’s size and its diversified portfolio of mines.
Barrick Gold
Barrick Gold is another leading gold stock that is trying to rebound after the recent strong pullback. Currently, Barrick Gold is trading at 16 forward P/E, in line with Newmont.
Analyst estimates for Barrick Gold have moved a bit lower in recent months, and it remains to be seen whether this trend will change in the upcoming weeks in case gold prices stay near current levels.
At the same time, the stock will remain a solid bet on gold markets for the same reasons as Newmont. Reasonable valuation and the diversified portfolio of mines will serve as strong catalysts for Barrick in case the gold price continues to move higher and settles above the recent highs near the $1865 level.
Read Full Story »»»
 DiscoverGold
The bot machines say 1848 is where it wants to be. And will be there or come back there until they say different.
$GDX made a daily cycle low on May 12
By: CyclesFan | May 28, 2022
• $GDX made a daily cycle low on May 12. Friday's candle was red on an up day which favors a down day on Tuesday. A close below the 10 DMA next week would mean that this is a bearish cycle or at least a neutral one, with a lower low or a retest of the low coming in late June.

Read Full Story »»»
 DiscoverGold
Jack Chan: Gold Price Exclusive Update
By: Jack Chan | May 28, 2022

Our proprietary cycle indicator is down, but bottoming.
To public readers of our updates, our cycle indicator is one of the most effective timing tool for traders and investors. It is not perfect, because periodically the market can be more volatile and can result in short term whipsaws. But overall, the cycle indicator provides us with a clear direction how we should be speculating.
Investors
During a major buy signal, investors can accumulate positions by cost averaging at cycle bottoms, ideally when prices are at or near the daily 200ema.
During a major sell signal, investors should be hedged or in cash.
Traders
Simply cost average in at cycle bottoms when prices are at or near the daily 200ema; and cost average out at cycle tops when prices are above the daily 50ema.

Gold sector is on a new long term BUY signal, suggesting that the correction since 2020 has been completed.

GLD is on short term buy signal.

GDX is on short term buy signal.

XGD.to is on short term buy signal.

GDXJ is on short term buy signal.
Analysis

Speculation rising from level of previous bottoms.

Our ratio is on a new buy signal.

Trend is up for the dollar.

$HUI is testing support.

Gold is testing support.

A flag is in progress in our flagship.

GDX is flagging also.
Summary
Long term – on BUY signal.
Short term – on buy signals.
Gold sector cycle is down but bottoming.
Speculation has reached level of previous bottoms, expect overall higher prices.
$$$ We are holding a core position and will continue to accumulate positions.
Read Full Story »»»
 DiscoverGold
Gold is goofy today, same with cryptos. Kinda weird.
It’s coming, get used to it. Gold gonna fly when US and Fed cannot control it anymore.
https://english.almayadeen.net/news/economics/russia-will-pay-its-foreign-debt-in-rubles
NY Gold Futures »» Weekly Summary Analysis
By: Marty Armstrong | May 21, 2022
NY Gold Futures closed today at 184210 and is trading up about 0.73% for the year from last year's settlement of 182860. Up to now, this market has been declining for 2 months and if the market continues to remain beneath the previous month's low of 187090 on a closing basis, then it will remain weak for now. This price action here in May is warning that we may have at least a temporary high in place beginning perhaps a bearish reactionary move on the monthly level if we see lower prices next month or close lower. Otherwise, there remains the potential for a one-month Knee-Jerk reaction low. As we stand right now, this market has made a new low breaking under the previous month's low dropping to 178500 intraday and remains trading beneath that level.
ECONOMIC CONFIDENCE MODEL CORRELATION
Here in NY Gold Futures, we do find that this particular market has correlated with our Economic Confidence Model in the past. The Last turning point on the ECM cycle low to line up with this market was 2015. The Last turning point on the ECM cycle high to line up with this market was 2020 and 2011 and 1996.
MARKET OVERVIEW
NEAR-TERM OUTLOOK
The historical perspective in the NY Gold Futures included a rally from 2015 moving into a major high for 2020, the market has been consolidating since the major high with the last significant reaction low established back in 2015. The market is still holding above last year's low. The last Yearly Reversal to be elected was a Bullish at the close of 2020.
This market remains in a positive position on the weekly to yearly levels of our indicating models.
Looking at the indicating ranges on the Daily level in the NY Gold Futures, this market remains neutral with resistance standing at 184970 and support forming below at 183480. The market is trading closer to the support level at this time.
On the weekly level, the last important high was established the week of March 7th at 207880, which was up 30 weeks from the low made back during the week of August 9th. We have been generally trading down for the past 4 weeks, which has been a very dramatic move of 10.88%.
Looking at this from a broader perspective, this last rally into the week of April 18th reaching 200300 failed to exceed the previous high of 207880 made back during the week of March 7th. That rally amounted to only three typical reaction weeks. Subsequently, the market has breached that low of the week of March 28th and has closed beneath it warning the market is weak. Since then, the market has consolidated for the past 4 weeks. Right now, the market is below momentum on our weekly models casting a bearish cloud over the price action. Looking at this from a wider perspective, this market has been trading up for the past 4 weeks overall.
INTERMEDIATE-TERM OUTLOOK
YEARLY MOMENTUM MODEL INDICATOR
Our Momentum Models are declining at this time with the previous high made 2020 while the last low formed on 2021. However, this market has rallied in price with the last cyclical high formed on 2020 and thus we have a divergence warning that this market is starting to run out of strength on the upside.
Critical support still underlies this market at 175200 and a break of that level on a monthly closing basis would warn that a sustainable decline ahead becomes possible. Nevertheless, the market is trading below last month's low warning of weakness at this time.
 DiscoverGold
 good luck with that
Burry is a genius. my target for the S and P is about 1800, so this means There is over 55 percent more of a drop to go.
No Bottom Yet In Metals, But May Still Be Stuck In A 4th
By: Avi Gilburt | May 21, 2022
• Following the Elliott Wave analysis:
I have been noting of late that silver has been providing us with the clearest perspective in the metals complex of late, which is why I have been so keenly focused on its movements.
For those following me on Friday, you would remember that I was expecting an imminent bottom in silver, so much so that I even suggested a “lotto-type” trade on the long side in silver Friday morning. But, I was not sure if that rally was going to be a corrective rally in wave 4 within this c-wave of a more expanded wave [2], or if the bottom had been struck, and we were starting the next impulsive rally higher.
I even went so far as marking up an 8-minute chart to identify if the rally off Friday’s expected low was taking shape impulsively or correctively. And, until today, the market was showing us the potential for an impulsive move. Yet, today, the action was taking shape as more of a b-wave pullback within wave 4 than the continuation of an impulsive move up. Of course, it is possible we are developing a 1-2, i-ii off the low, but I will need to let the market prove that to me. And, to be honest, that is a very reasonable count, as we had two VERY nice 5-wave structures develop off last week’s low. But, for now, I am tracking the corrective count until we break out through resistance.
Now, since the .382 retracement of wave 3 is the common expectation for wave 4, which in our case is in the 22.75 region, it also resides just south of the 1.00 extension within the c-wave down, which is also a common target for a 4th wave. So, for now, that is going to be my ideal target zone for a 4th wave bounce.
Since the current move off this week’s high is taking shape as an overlapping corrective structure, I am assuming it is a corrective b-wave within wave 4. So, as long as the support box over 21 holds in silver, I am looking for another rally to be seen in silver it the coming days.
As far as GLD is concerned, it all looks like a big diagonal, so I really have no other reasonable count right now other than a wave iv even with a lower low. So, I am not going to be touching the GLD, as it is likely going to be a tough rally to outline since it will likely be within a 3-wave structures. But, a rally is nonetheless what I expect once this downside has confirmed to be completed.
Now, GDX is kind of a hybrid between GLD and silver. If we do get a 4th and 5th wave in GDX as similar to silver, then GDX can also see a marginally lower low and reset its count as did silver. In that event, I think GDX and silver will likely present us with the best opportunities going forward into the last half of 2022 and into 2023. So, for now, I am going to reserve my opinion on GDX.
In summary, silver has presented us with the clearest chart I am seeing in the metals complex of those that I track. Of course, we may have a 1-2, i-ii off the lows in silver, as we have two REALLY nice 5-wave structures of the lows. But, until silver can at least clear the 23.25 region, I am viewing any further rally as a corrective wave iv.
In the bigger picture, I am again going to be looking for an opportunity to do an aggressive long side trade in silver, or possibly in GDX as well. Once we have a confirmed c-wave completed, I think we will see some amazing opportunities presented in the metals complex in the coming months.

GDXdaily

GLDdaily

silver-8min

Silver-144min
Read Full Story »»»
 DiscoverGold
Gold Stocks: Bull Candlesticks Call The Turn
By: Morris Hubbartt | May 21, 2022
Super Force Signals (SFS) is being rebranded as Super Gold Signals (SGS at https://supergoldsignals.com), to reflect the growing global importance of gold.
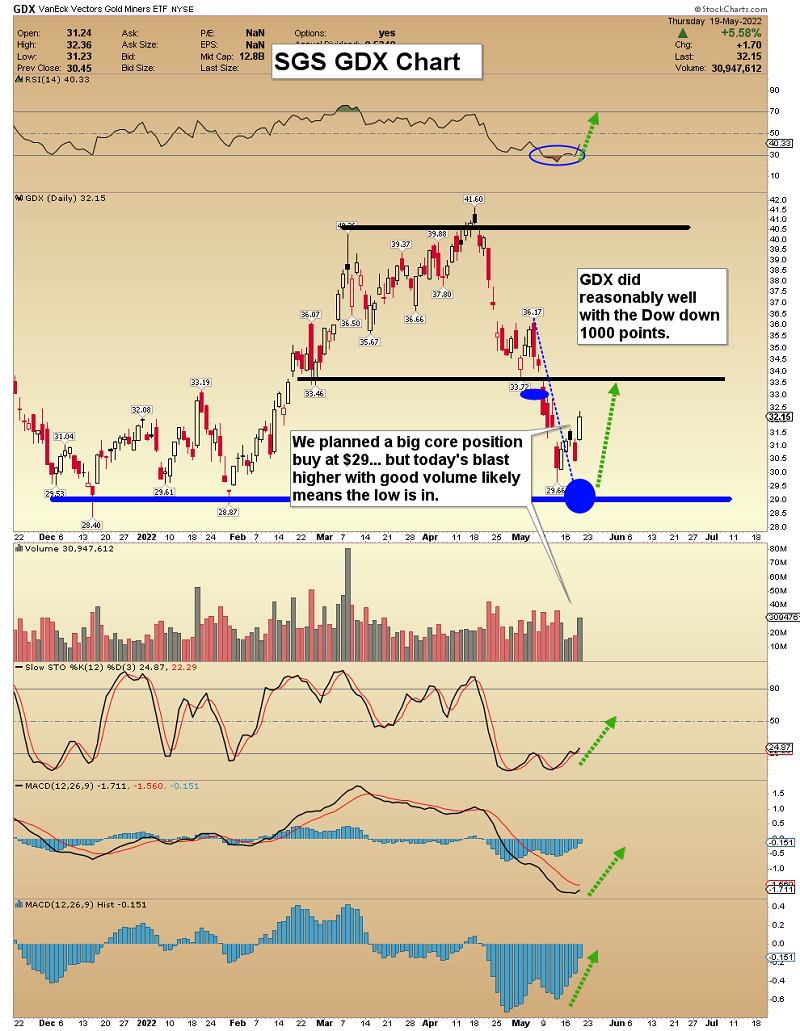
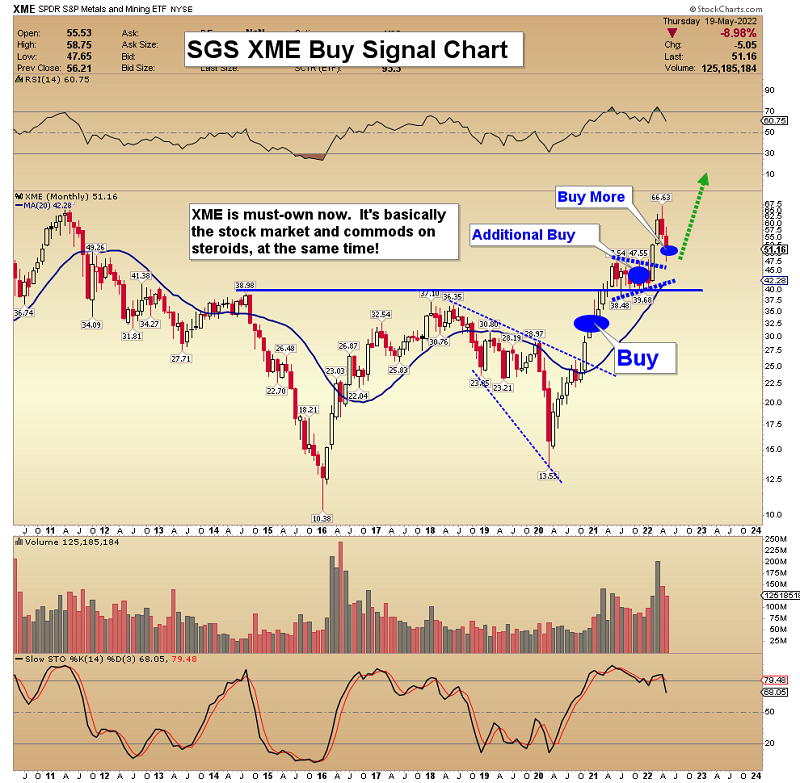
SG60 Key Charts, Signals, & Video Analysis
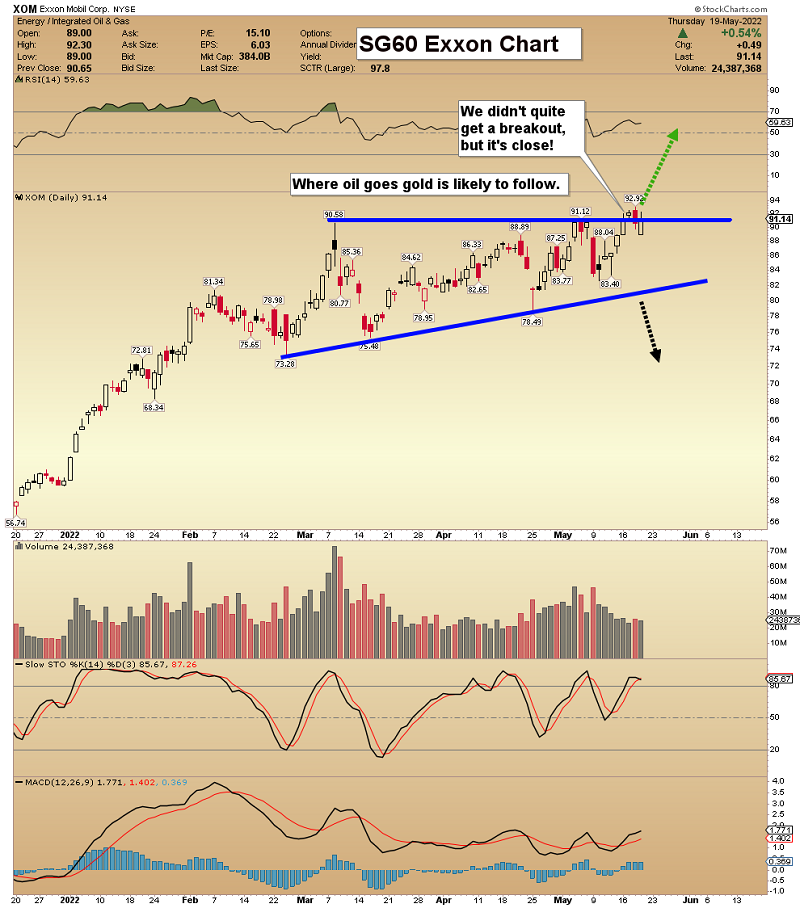
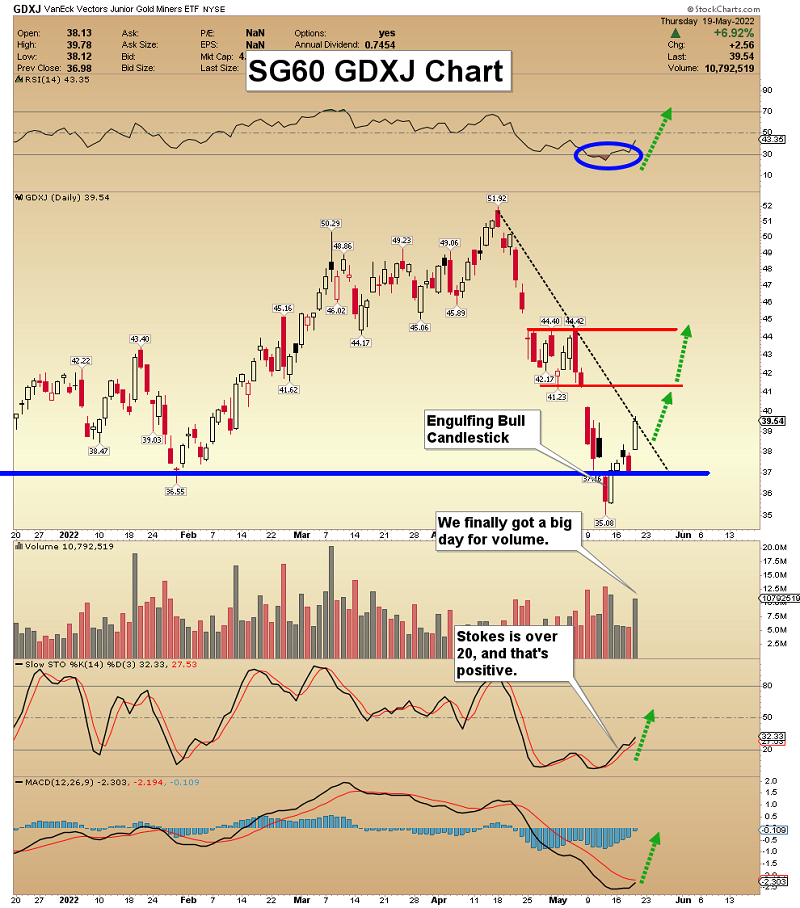
SGT Key Charts, Signals, & Video Analysis
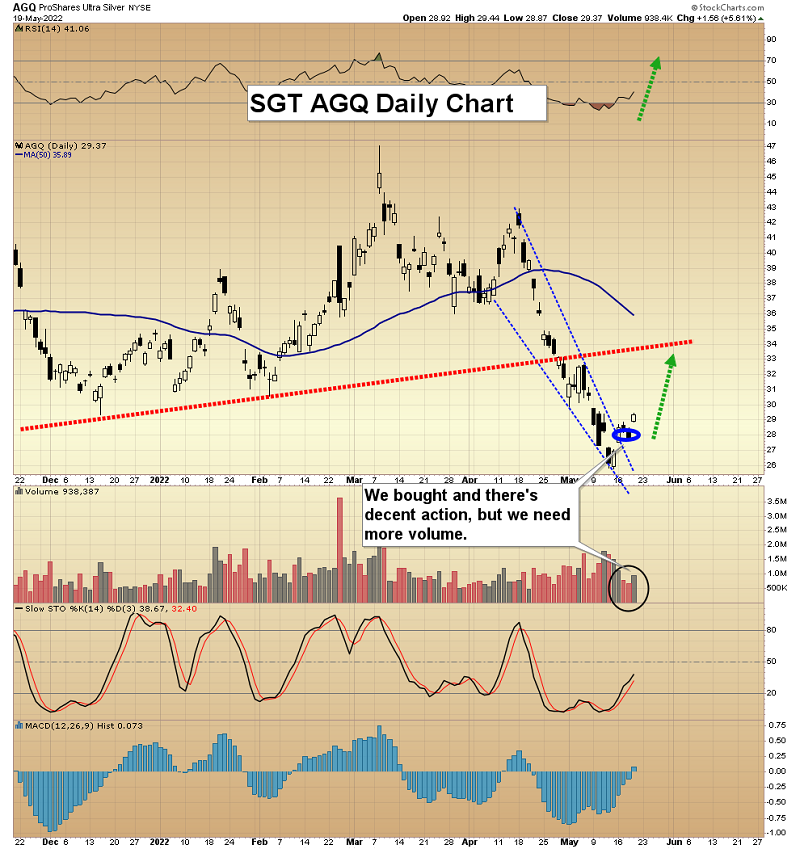
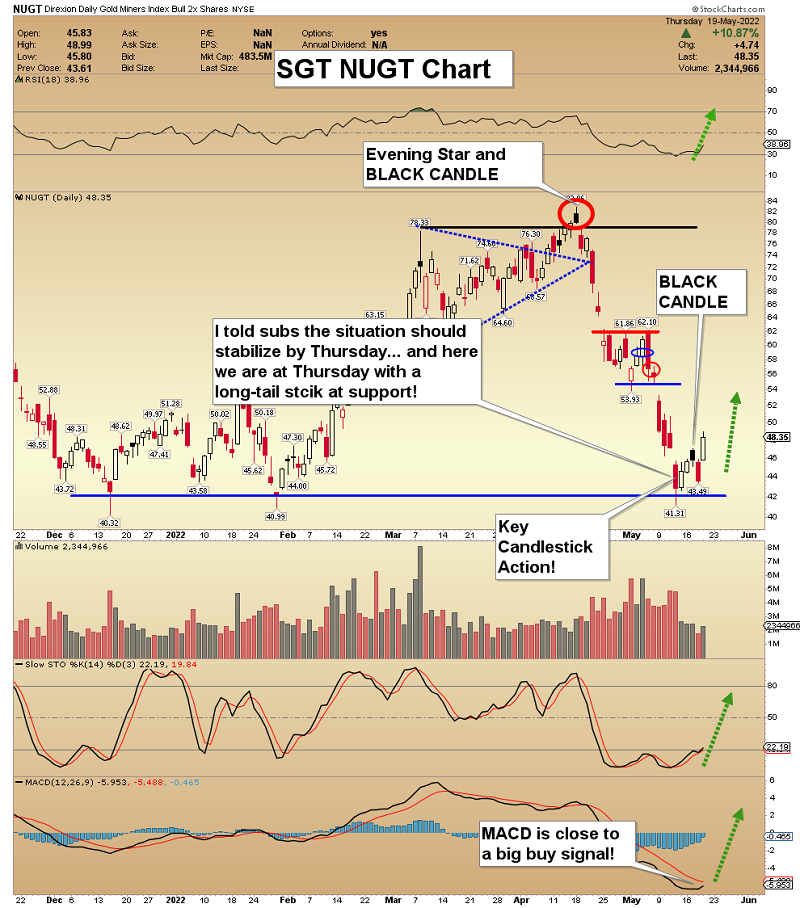
With the gold stocks and silver putting powerful bull candlestick formations, I help investors take the opportunity with plays on NUGT and AGQ. Stoplosses on every trade keep potential drawdowns in check. At $499/yr, subs love the action, and I’m offering a half price $249/14mth special offer, which I’ll keep open through this weekend. If you want the offer, please send me an email and I’ll make it happen. Thanks!
SGJ Key Charts, Signals, & Video Analysis
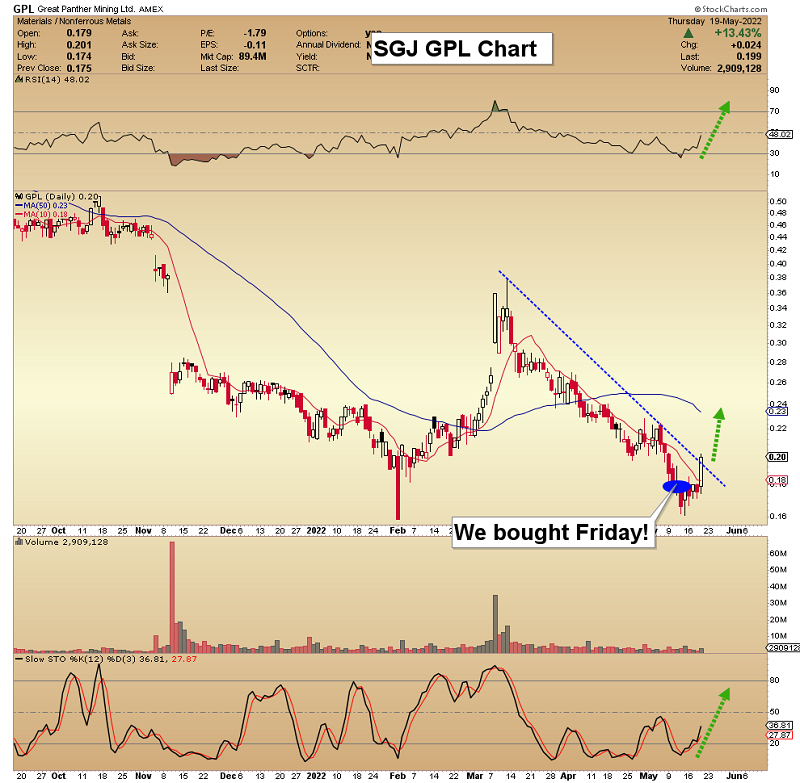
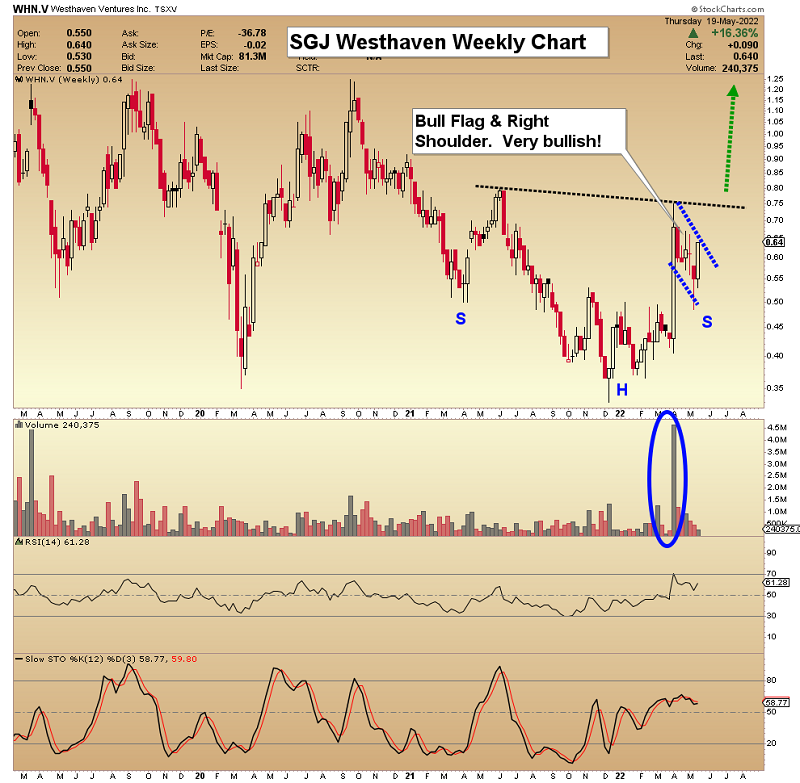
Read Full Story »»»
 DiscoverGold
Jack Chan: Gold Price Exclusive Update
By: Jack Chan | May 21, 2022

Our proprietary cycle indicator is down, but bottoming.
To public readers of our updates, our cycle indicator is one of the most effective timing tool for traders and investors. It is not perfect, because periodically the market can be more volatile and can result in short term whipsaws. But overall, the cycle indicator provides us with a clear direction how we should be speculating.
Investors
During a major buy signal, investors can accumulate positions by cost averaging at cycle bottoms, ideally when prices are at or near the daily 200ema.
During a major sell signal, investors should be hedged or in cash.
Traders
Simply cost average in at cycle bottoms when prices are at or near the daily 200ema; and cost average out at cycle tops when prices are above the daily 50ema.

Gold sector is on a new long term BUY signal, suggesting that the correction since 2020 has been completed.

GLD is on short term sell signal.

GDX is on short term sell signal.

XGD.to is on short term sell signal.

GDXJ is on short term sell signal.
Analysis

Speculation according to COT data is now at level of previous bottoms.
Expect overall higher prices.

Our ratio is on sell signal, but a new buy signal is imminent.

Trend is up for the dollar.

$HUI is testing support.

Gold is testing support.

The multi year “cup with handle” is in progress.

The sharp sell off of the past few weeks and a firm bounce this week has resulted in a new price pattern: an inverse head & shoulder.
Summary
Long term – on BUY signal.
Short term – on mixed signals.
Gold sector cycle is down but bottoming.
Speculation has reached level of previous bottoms, expect overall higher prices.
$$$ We are holding a core position and will continue to accumulate positions.
Read Full Story »»»
 DiscoverGold
immanent blast off in metals, silver gonna move towards 30 and gold should hit new highs within a month. lets see if it happens or futures contracts hold it back.
COT - Commitments of Traders in Metals Futures Market Reports
By: Software North | May 20, 2022
Gold

Silver

Read Full Story »»»
 DiscoverGold
Gold Prices Show Signs of Bottoming
By: AG Thorson | May 20, 2022
• Gold plunged nearly $300 since March, and miners performed even worse. Over the past 2-years, gold has gone nowhere. Is the bull market dead?
Gold bugs will be happy to know the 5-year chart suggests a simple pause before new highs (see below).
Metals and miners could drop further over systemic market risk, but the technicals are starting to support a bottom.
Gold Price Forecast
Gold 5-Year daily chart
The cup-with-handle pattern looks complete. Prices fell deeper than anticipated, but I’m beginning to see signs of a bottom. I continue to expect a breakout above $2000 in the coming months; probably when the Fed pivots.

Gold daily chart
The close-up of the handle formation shows gold dipping briefly below the 200-day MA. Prices closed back above it Thursday, and I see the potential for a bottom if we see a strong finish above $1850.

Silver and Miners Analysis
Silver daily chart
Silver must get back above $22.50 to consider a cycle low.

GDX daily chart
Miners managed to close above last week’s gap ($31.70). Prices may have reached a cycle low. Prices remain vulnerable to sharp dips and general market risk.

GDXJ daily chart
Juniors bounced sharply, supporting a possible low. A close above the gap near $41.50 is the next step in confirming a bottom.

Word of Caution: Markets are likely to remain volatile through 2022. Whatever happens today could swiftly reverse tomorrow. Try not to read too much into one week’s price action.
Read Full Story »»»
 DiscoverGold
Gold Mid-Tiers’ Q1’22 Fundamentals
By: Adam Hamilton | May 20, 2022
The mid-tier and junior gold-miners’ stocks in their sector’s sweet spot for upside potential have been clubbed like baby seals since mid-April. Sucked into the parallel serious stock-market selloff, that’s left these smaller gold stocks deeply out of favor. Yet their fundamentals remain strong as revealed in the just-finished Q1’22 earnings season. That recent brutal mid-tier-and-junior-gold-stock plunge wasn’t righteous.
Gold-stock tiers are defined by their production rates. Small juniors mine less than 300k ounces of gold annually, medium mid-tiers have outputs running from 300k to 1,000k, large majors yield over 1,000k, and huge super-majors operate at vast scales exceeding 2,000k. The mid-tiers offer a unique mix of sizable diversified production, good output-growth potential, and smaller market capitalizations ideal for outsized gains.
Mid-tiers are much-less-risky than juniors, and amplify gold’s uplegs much more than majors. These mid-tiers are nicely tracked by the GDXJ VanEck Junior Gold Miners ETF. Birthed in November 2009, it now commands $3.8b of net assets making it the second-largest sector ETF after its big-brother GDX. While GDXJ is way-superior on multiple fronts, despite its name it is overwhelmingly comprised of mid-tier gold miners.
They are universally-hated now, after GDXJ was eviscerated in a merciless 30.0% plunge in less than a month into mid-May! Speculators and investors alike have forgotten that mid-tier gold stocks were having a good 2022 before that, rallying 21.7% year-to-date by mid-April. They were nowhere near overbought then, and shouldn’t have cratered. But they were sucked into a wider market maelstrom of serious selling.
During that same span the flagship US S&P 500 stock index dropped an ugly 10.5%. The resulting big fear spike, confirmed by its VIX gauge blasting 40.4% higher, infected everything else. The safe-haven exodus from stocks into cash catapulted the US Dollar Index a monster 4.5% higher! That unleashed big leveraged gold-futures selling, hammering gold 7.6% lower which the gold stocks amplified to serious losses.
But that heavy sector selling had nothing to do with fundamentals, it was collateral damage from soaring bearish psychology. Like a match being struck, after flaring brightly extreme sentiment never lasts long. The battered mid-tier and junior gold stocks are destined to recover fast as gold resumes powering higher. Its own fundamental outlook remains super-bullish on raging inflation unleashed by extreme money printing.
Right after 24 quarterly earnings seasons in a row now, I’ve painstakingly analyzed the latest operational and financial results reported by the top-25 GDXJ gold miners. This week they collectively accounted for 62.8% of this ETF’s weighting. With a whopping 100 component stocks, GDXJ’s capital is spread across most of the better mid-tier-and-junior-gold-mining universe! Its larger holdings show how mid-tiers are faring.
This table summarizes the operational and financial highlights from the GDXJ top 25 in Q1’22. These gold miners’ stock symbols aren’t all US listings, and are preceded by their rankings changes within GDXJ over this past year. The shuffling in their ETF weightings reflects shifting market caps, which reveal both outperformers and underperformers since Q1’21. Those symbols are followed by their current GDXJ weightings.
Next comes these gold miners’ Q1’22 production in ounces, along with their year-over-year changes from the comparable Q1’21. Output is the lifeblood of this industry, with investors generally prizing production growth above everything else. After are the costs of wresting that gold from the bowels of the earth in per-ounce terms, both cash costs and all-in sustaining costs. The latter help illuminate miners’ profitability.
That’s followed by a bunch of hard accounting data reported to securities regulators, quarterly revenues, earnings, operating cash flows, and resulting cash treasuries. Blank data fields mean companies hadn’t reported that particular data as of the middle of this week. The annual changes aren’t included if they would be misleading, like comparing negative numbers or data shifting from positive to negative or vice versa.
The elite mid-tier and junior gold miners filling GDXJ’s upper ranks reported good results last quarter. Many suffered weaker production, which was largely the result of the COVID-19-omicron wave forcing lots of mine employees to stay home early-on. But these smaller gold miners still managed to mostly hold the line on costs, which combined with better gold prices fueled very-profitable fundamentally-strong operations.
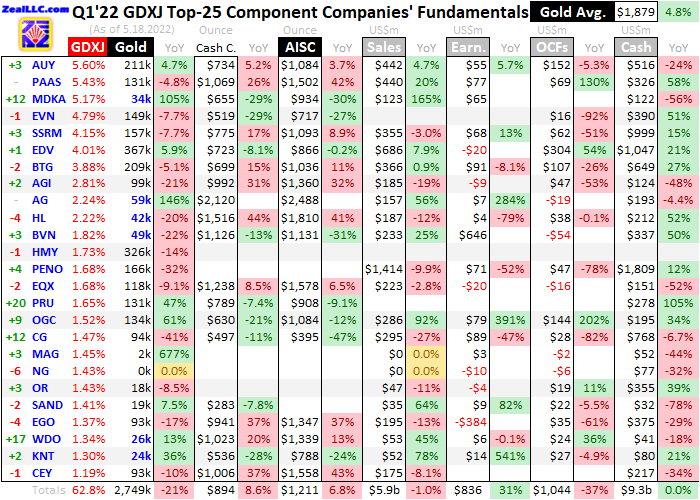
Like most exchange-traded funds, GDXJ is essentially market-capitalization-weighted. That’s the most-logical way to construct ETFs, reflecting relative capital amounts traders have deployed in component stocks. But shifting market caps continually alter ETF-component weightings and rankings, and there was a lot of churn in GDXJ’s top-25 holdings over this past year. Chief among that was an excellent pruning.
For years one of this “Junior Gold Miners” ETF’s top components had been South-African super-major Gold Fields. Last quarter it produced an enormous 580k ounces of gold! There was never justification to include a gigantic gold miner like that in GDXJ, and I railed against that for years in these quarterly-results analyses. GDXJ’s managers eventually saw the light, booting GFI in Q2’21 leaving it exclusively in GDX...
Read Full Story »»»
 DiscoverGold
Gold Miners: Will Decline Find Support At $30?
By: Chris Kimble | May 20, 2022

It’s been a rough past few weeks for the Gold Miners ETF (GDX).
A bearish reversal in April has sent shares spiraling into May, down nearly 25%.
Today’s “weekly” chart of the Gold Miners (GDX) from Marketsmith.com highlights this reversal, as well as important technical support.
As you can see, GDX has come down sharply of late. But what’s important to note here is that the Gold Miners are testing critical price support at (1). As you can see, GDX is trading near the $30 level that has been price support and resistance several times over the past 6 years.
Will the sharp selloff continue to head lower and break this key support? Or will support hold and perhaps send GDX back up toward resistance near $40 once more? Stay tuned!
Read Full Story »»»
 DiscoverGold
Those central bankster bots just dropped the bar to 1834. Like I said, it just drops in price with no trade at all, or a bunch of controlled hammer drills.
I can confidently say with 100% accuracy that gold does not follow fair trade practices to this very day.
Spot Gold getting told to stay put, for now, at 1842. Very little, if any volume, pushes it in that direction so far this AM. Funny cause just so happens a lot of OPEX today.
1842 gold sailed the ocean blue to American markets. What will they do with this new mark?
$GDX I still think there's downside risk into the week of May 30
By: CyclesFan | May 19, 2022
• $GDX will likely close above its 10 DMA which means that it may have made a daily cycle low on May 12 though it still has to close above the 20 DMA to confirm that. I still think there's downside risk into the week of May 30.

Read Full Story »»»
 DiscoverGold
Took 15 minutes to tap it back to1840. Tap tap tap Arooni.
Here is Why I’m Still Bullish on Gold Miners
By: Przemyslaw Radomski | May 19, 2022
• The medium-term outlook for the precious metals remains bearish, but does this mean we can’t profit on shorter-term moves? Quite the opposite!
Precious metals declined yesterday, and so did the general stock market. Is the rally already over?
When I wrote about this rally on May 12, which took place at the same time when I took profits from the short positions and entered the long ones, I mentioned that I planned to hold these long positions for a week or two. Since that was exactly a week ago, the question is: is the top already in?
In short, it probably isn’t. As always, it’s useful to check what happened in the past in similar situations to verify whether what we see is normal or some kind of an outlier that cannot be explained by something that has already happened.
Let’s start with a quote from yesterday’s analysis:
Of course, there will be some back-and-forth movement on an intraday basis, but it doesn’t change anything. Junior miners are likely to rally this week nonetheless. And perhaps not longer than that, as the next triangle-vertex-based reversal is just around the corner – on Friday/Monday.
The previous few days were the “forth” and yesterday was the “back” movement – so far, my comments remain up-to-date. However, comparing the market action with what I wrote previously isn’t what I meant by analogies to past situations. I meant this:

The areas marked with green rectangles are the starting moments of the previous short-term rallies. Some were bigger than others, and yet they all had one thing in common. They all included a corrective downswing after the initial post-bottom rally.
Consequently, what we saw yesterday couldn’t be more normal during a short-term rally. This means that yesterday’s decline is not bearish at all and the profits from our long positions are likely to increase in the following days.
Besides, the general stock market declined by over 4%, while the GDXJ (normally moving more than stocks) ETF – a proxy for junior mining stocks – declined by only about 2%.

If the general stock market continues to decline, junior miners could get a bearish push even if gold prices don’t decline.
However, let’s keep in mind the fact that miners tend to bottom before stocks do – in fact, we saw that in early 2020. This means that even if the S&P 500 moves to new yearly lows shortly and then bounces back up, the downside for miners could be limited, and the stocks’ rebound could trigger a profound immediate-term rally.
If stocks decline, then they have quite strong support at about 3815 – at their 38.2% Fibonacci retracement level.
Let’s keep in mind that junior miners have triangle-vertex-based reversal over the weekend, so they might form some kind of reversal on Friday or Monday.
Ideally, miners would be after a quick rally that is accompanied by huge volume on Friday. This would serve as a perfect confirmation that the top is in or at hand.
However, we can’t tell the market what it should do – we can only respond to what it does and position ourselves accordingly. Consequently, if stocks take miners lower, it could be the case that Friday or Monday will be the time when they bottom. This seems less likely to me than the previous (short-term bullish) scenario, but I’m prepared for it as well. In this case, we’ll simply… wait. Unless we see some major bearish indications, we will wait for the rally to end, perhaps sometime next week.
Again, a nearby top appears more likely than another bottom, in particular in light of what I wrote about the common post-bottom patterns in the GDXJ.
Having said that, let’s take a look at the markets from a fundamental point of view...
* * *
Read Full Story »»»
 DiscoverGold
They got the dollar to prop up. Everything else, the wheels have come.
1812 coming around again. Lol
GDX near major support with extreme oversold condition adds to the bullish setup
By: Tim Ord | May 18, 2022
• 18 MA of up down volume and Advance/Decline both hit near -50; lowest reading going back to 2010. 83% chance a worthwhile low is forming here on $GDX, GDX also near major support with extreme oversold condition adds to the bullish setup.

Read Full Story »»»
 DiscoverGold
Gold & Market Update: Stocks Aiming Lower as Gold Shows Signs of Bottoming
By: AG Thorson | May 18, 2022
Gold prices have plunged nearly $300 since peaking in March. The chart is building a bullish hup-with-handle pattern supporting a breakout above $2000 later this year.
Metals and miners could drop further over continued weakness in broader markets. Overall, I believe this dip will be viewed as an excellent long-term buying opportunity.
The next big rally in precious metals will come when the Fed pivots. That could happen soon if we see widespread fuel shortages and price controls, as I expect.
Our Gold Cycle Indicator is at 36 and within maximum cycle bottoming.
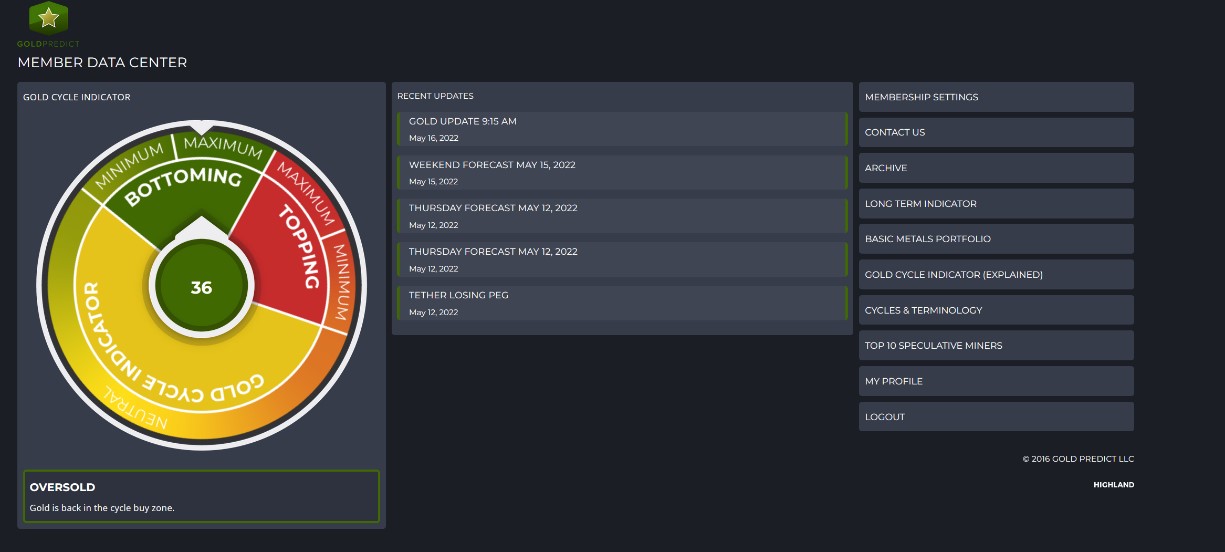
Gold Prices
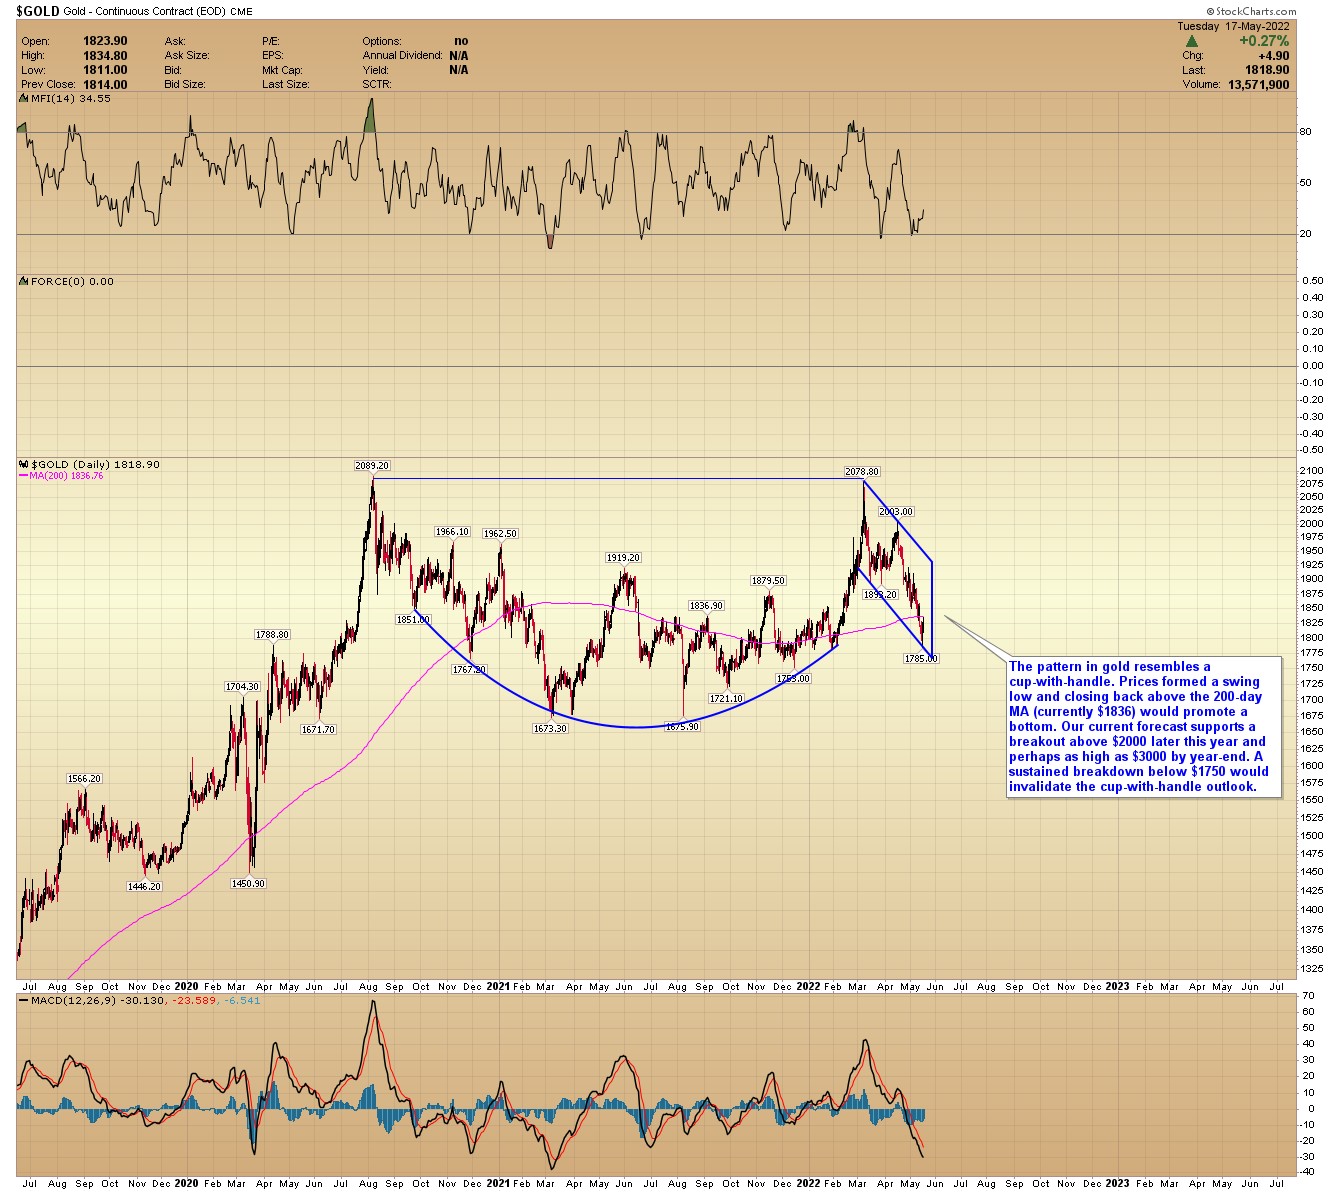
The pattern in gold resembles a cup-with-handle. Prices formed a swing low and closing back above the 200-day MA (currently $1836) would promote a bottom. Our current forecast supports a breakout above $2000 later this year and perhaps as high as $3000 by year-end. A sustained breakdown below $1750 would invalidate the cup-with-handle outlook.
GDX
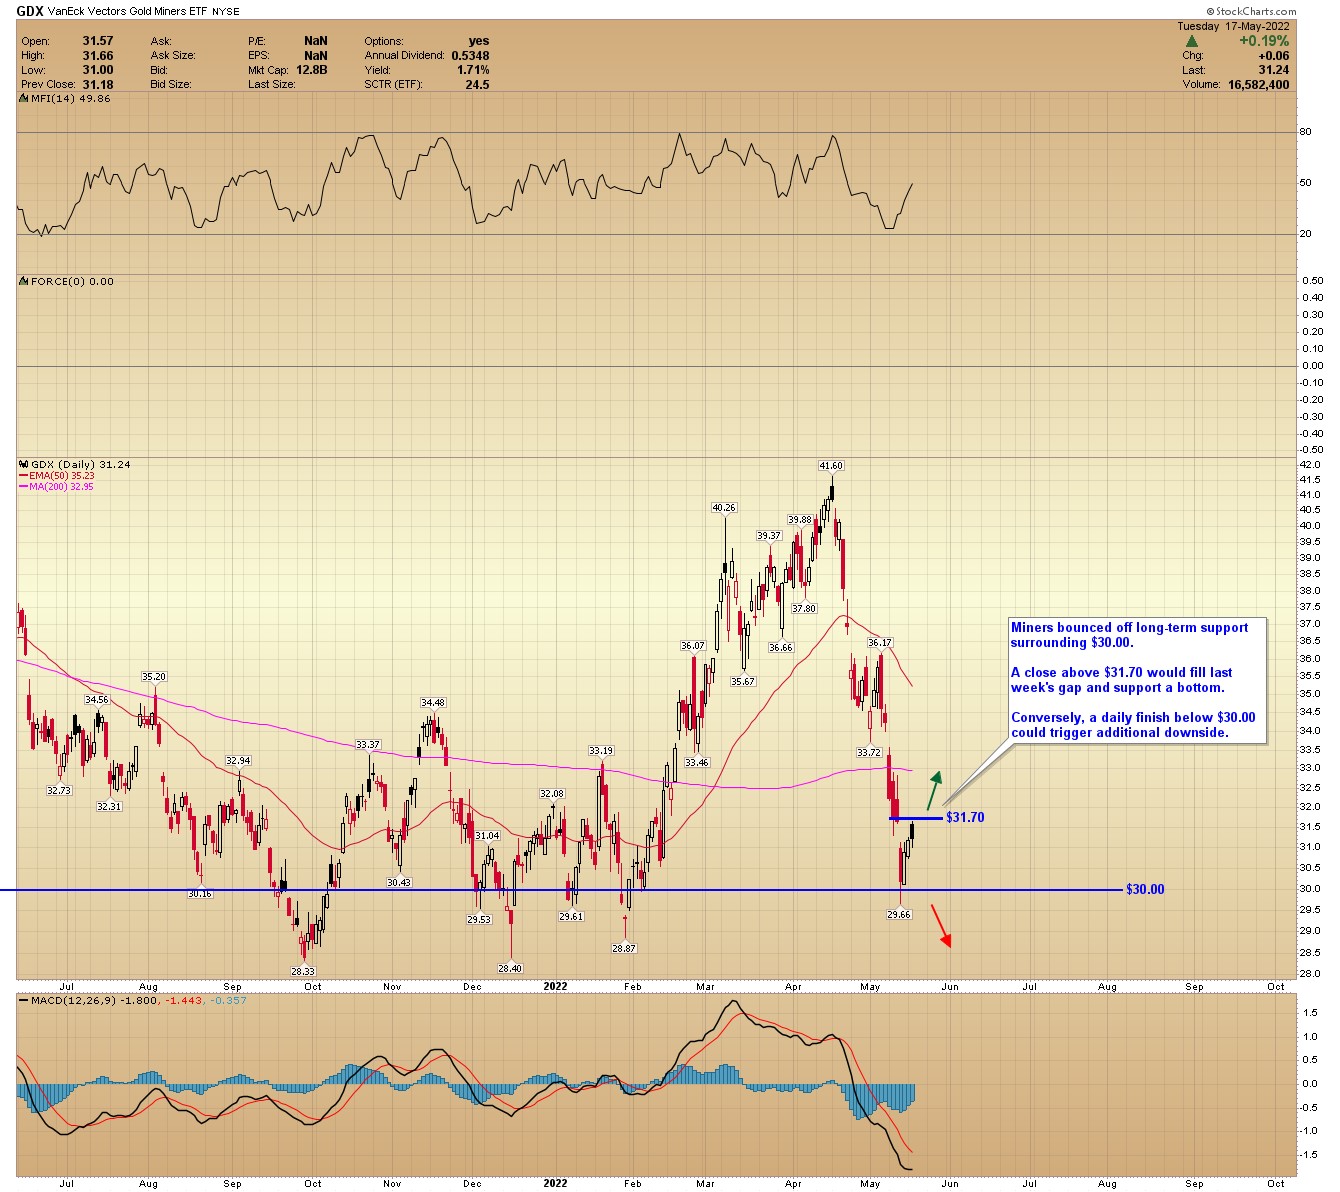
Miners bounced off long-term support surrounding $30.00. A close above $31.70 would fill last week's gap and support a bottom. Conversely, a daily finish below $30.00 could trigger additional downside.
GDXJ
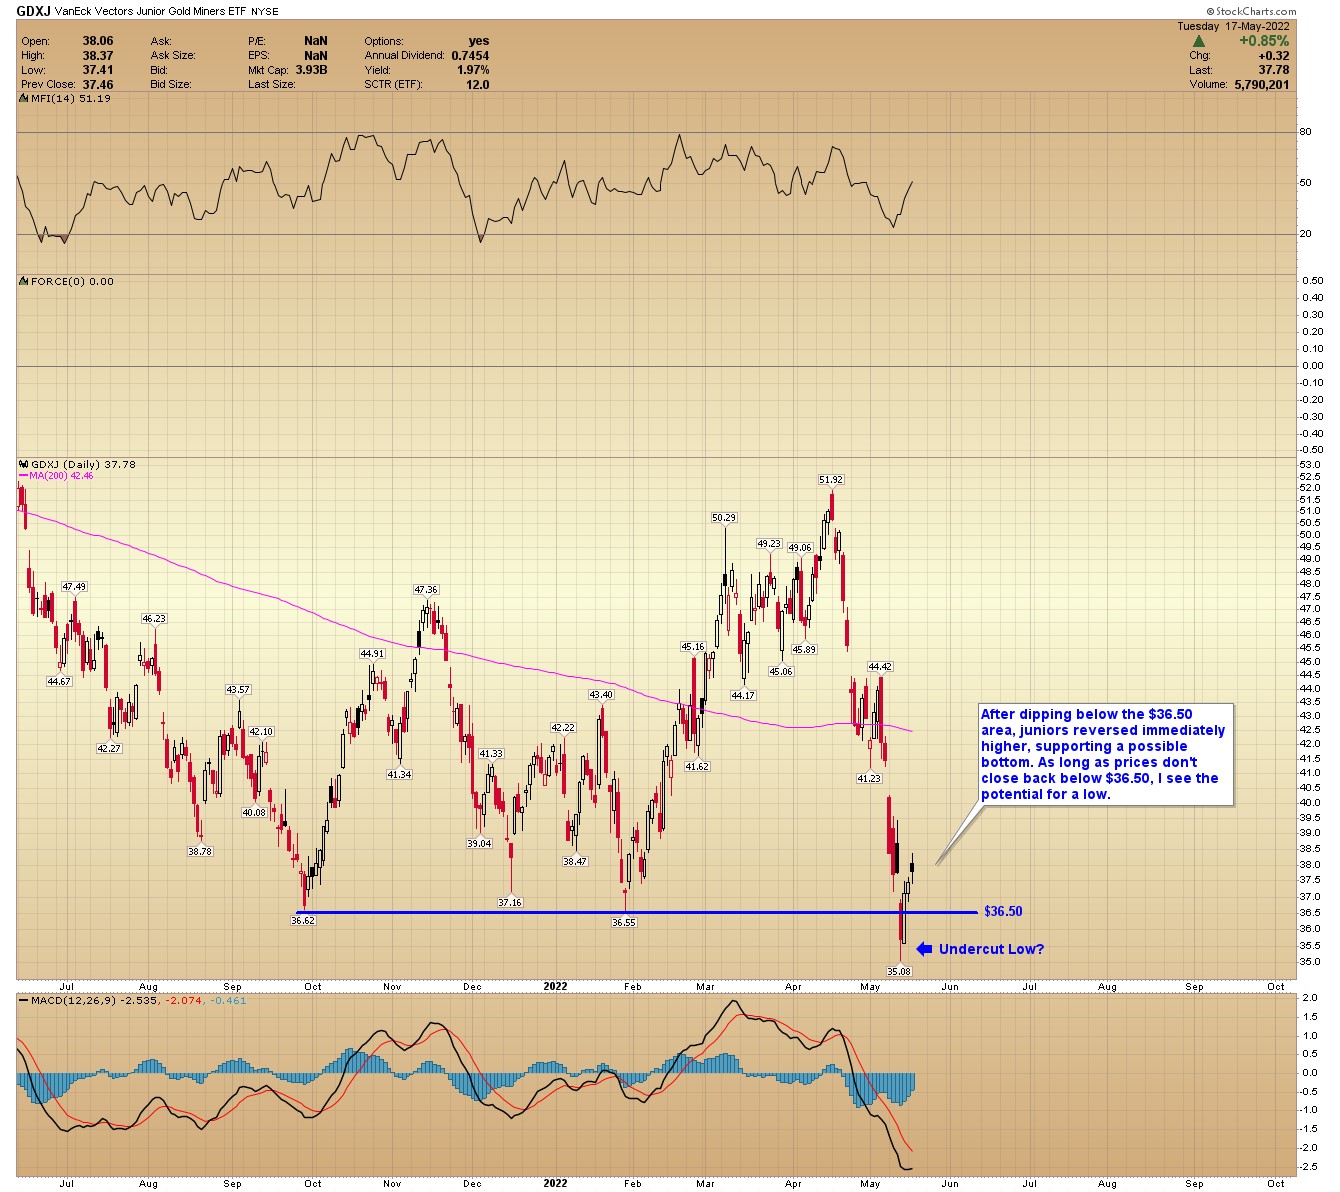
After dipping below the $36.50 area, junior miners reversed immediately higher, supporting a possible bottom. As long as prices don't close back below $36.50, I see the potential for a cycle low.
DOW
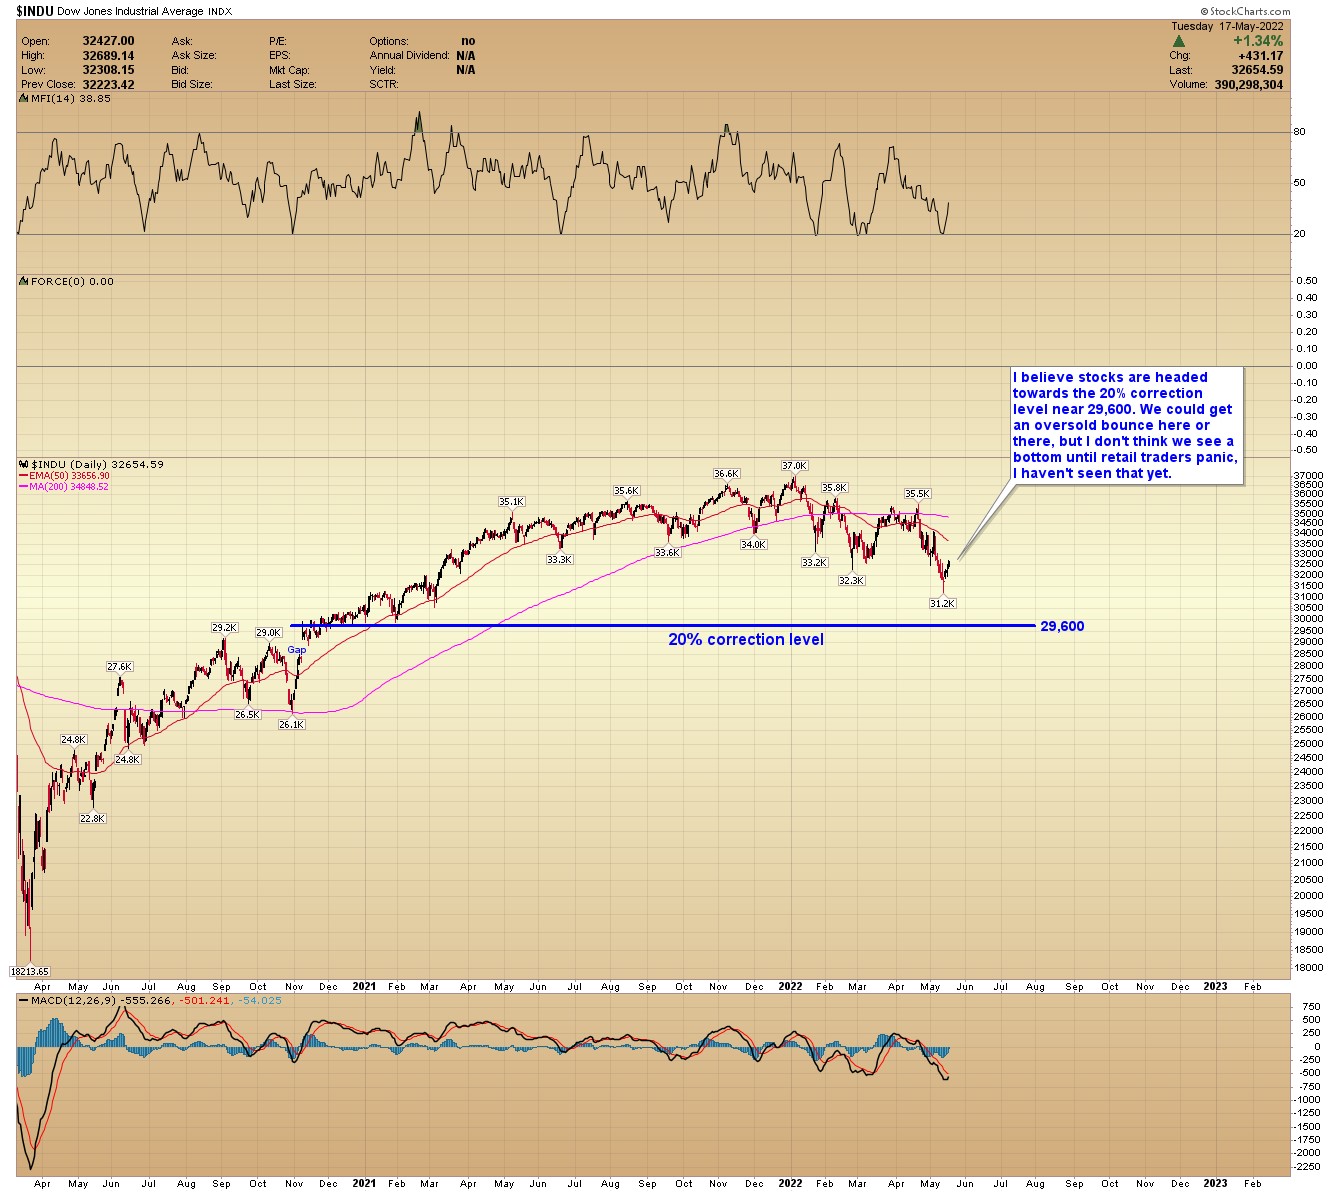
I believe stocks are headed towards the 20% correction level near 29,600. We could get an oversold bounce here or there, but I don't think we see a bottom until retail trader’s panic; I haven't seen that yet.
TSLA
I think we need to see panic and a breakdown in Tesla before markets bottom. As I understand it, Musk has $88-billion in margin debt against his Telsa shares. The Twitter deal may add another $13-billion. That is a lot of debt tied to an extremely volatile and overpriced stock.
If Tesla shares crash like I've been calling for, Musk could see significant financial stress. For his sake, I hope I'm wrong. A price decline below $550 could trigger panic.
Takeaways:
• The general stock market is bouncing, but I won't expect a bottom until retail traders capitulate...watch Tesla.
• A liquidity event is possible, resulting in a flash crash. I'm keeping an eye on cryptocurrencies; they could fail first.
• It's probably a good time to hold cash in anticipation of buying opportunities if prices drop further.
Read Full Story »»»
 DiscoverGold
With the blink of an eye it’s back from 1815 with heavy volume, to 1810. A few bot trades with toilet paper futures, voilà.
I’d say by end of June bots will fry their circuits
No matter how much buy volume there is, spot gold gets boxed in around 1812. Gonna be a vicious day.
It’s popping up now, with a lot of buying, but will be back to1812, watch.
Gold stuck in the teens. Dollar fell hard so most likely the hammering of gold was attempt to offset drop. Didn’t work for dollar but gold sure looks bruised.
Every nice clean takeoff attempt to get about 1820 gets taken out at the knees. How do I know, gold then sputters around for a bit after.
Gold Forecast: While The Dollar Rests, Is It Time For Gold To Rise And Shine?
By: P. Radomski | May 17, 2022
Practically everything that I wrote yesterday either happened in tune with that or it remains up-to-date, so today’s technical part will be rather brief.
In short, gold reversed yesterday’s decline after almost touching its previous 2022 lows, and at the same time, it practically erased the entire war-tension-based rally – just like it was supposed to.
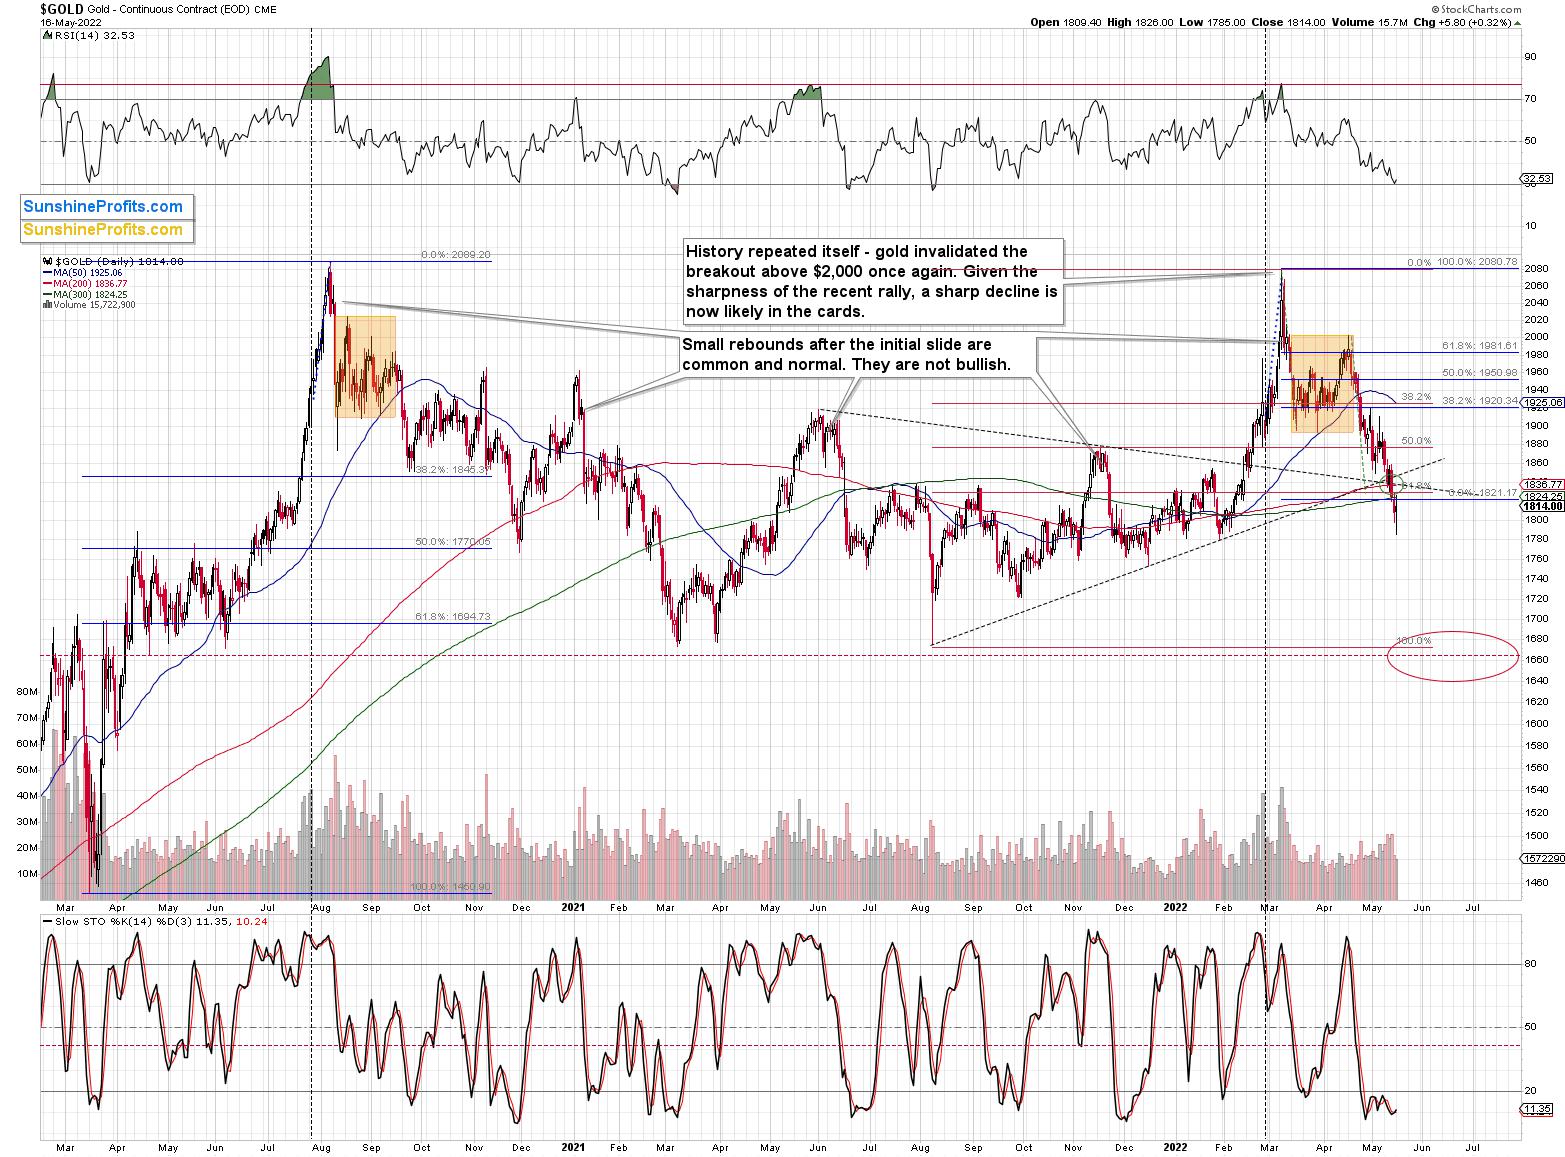
Gold ended the day only $5.80 higher, but the important thing is that it reversed at all. Gold’s RSI also bounced off the 30 level, which can be viewed as a buy signal on its own.
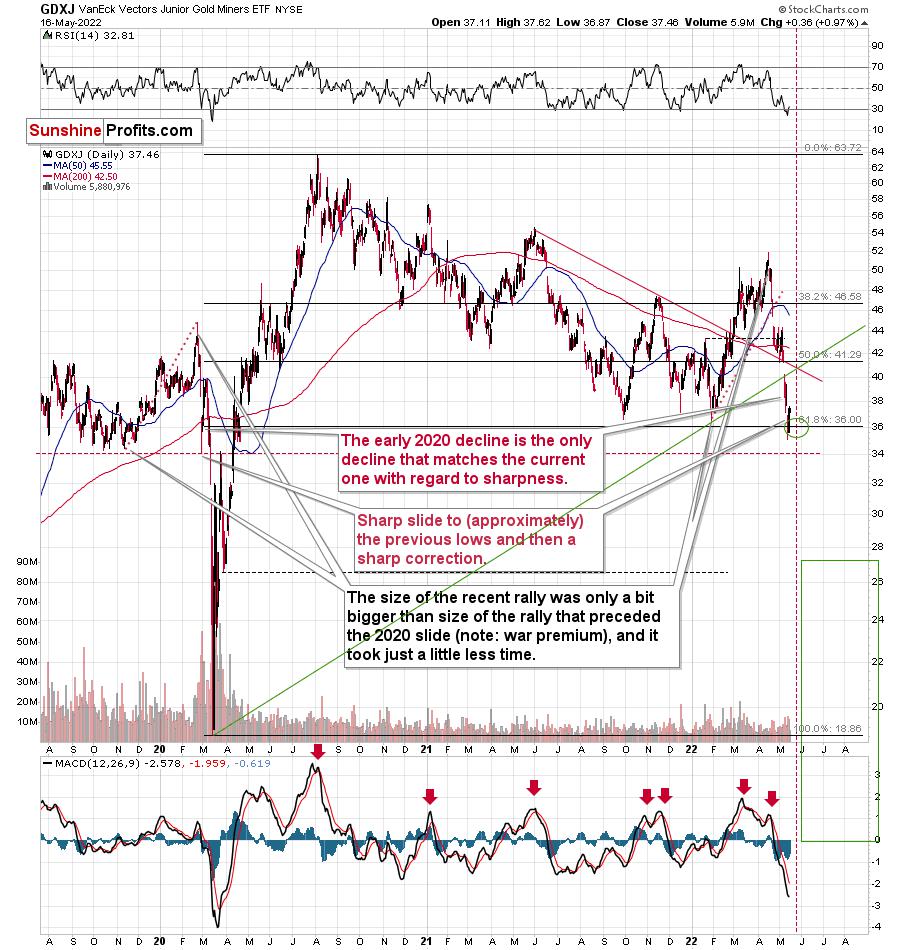
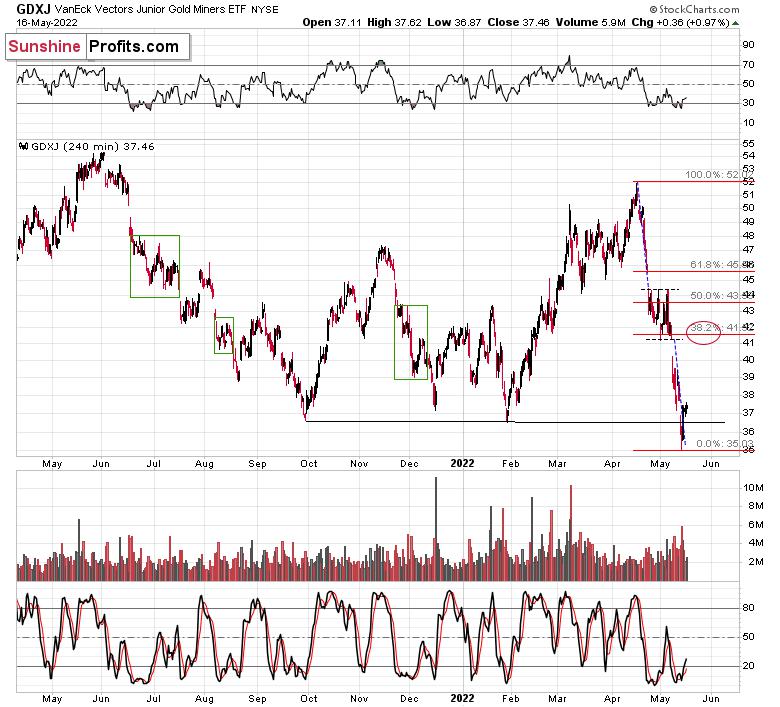
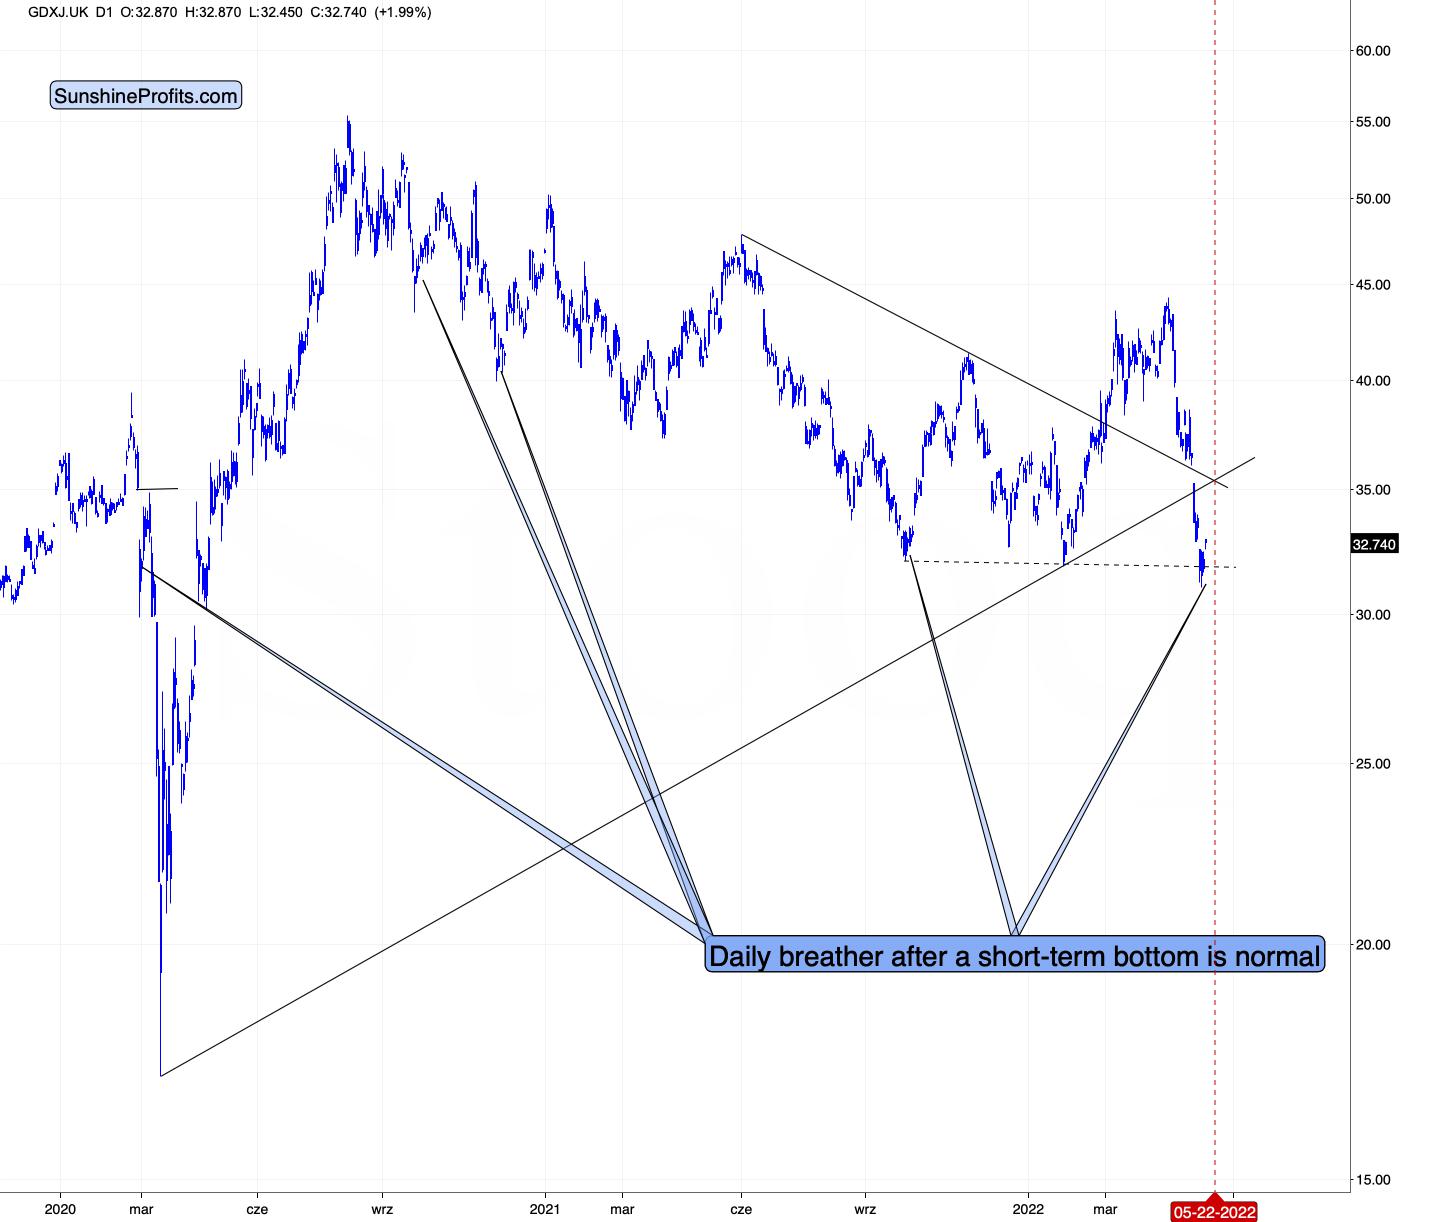
Junior miners were up by almost 1% yesterday, about 3 times more than gold. They continue to show strength, and our long positions (that became profitable almost immediately) are getting more profitable also in today’s early trading as the GDXJ is up in London trading.
In yesterday’s analysis, I wrote that the S&P 500 invalidated its head and shoulders pattern on an intraday basis, and even though it declined very modestly yesterday, it’s up in a clear manner in today’s pre-market trading.
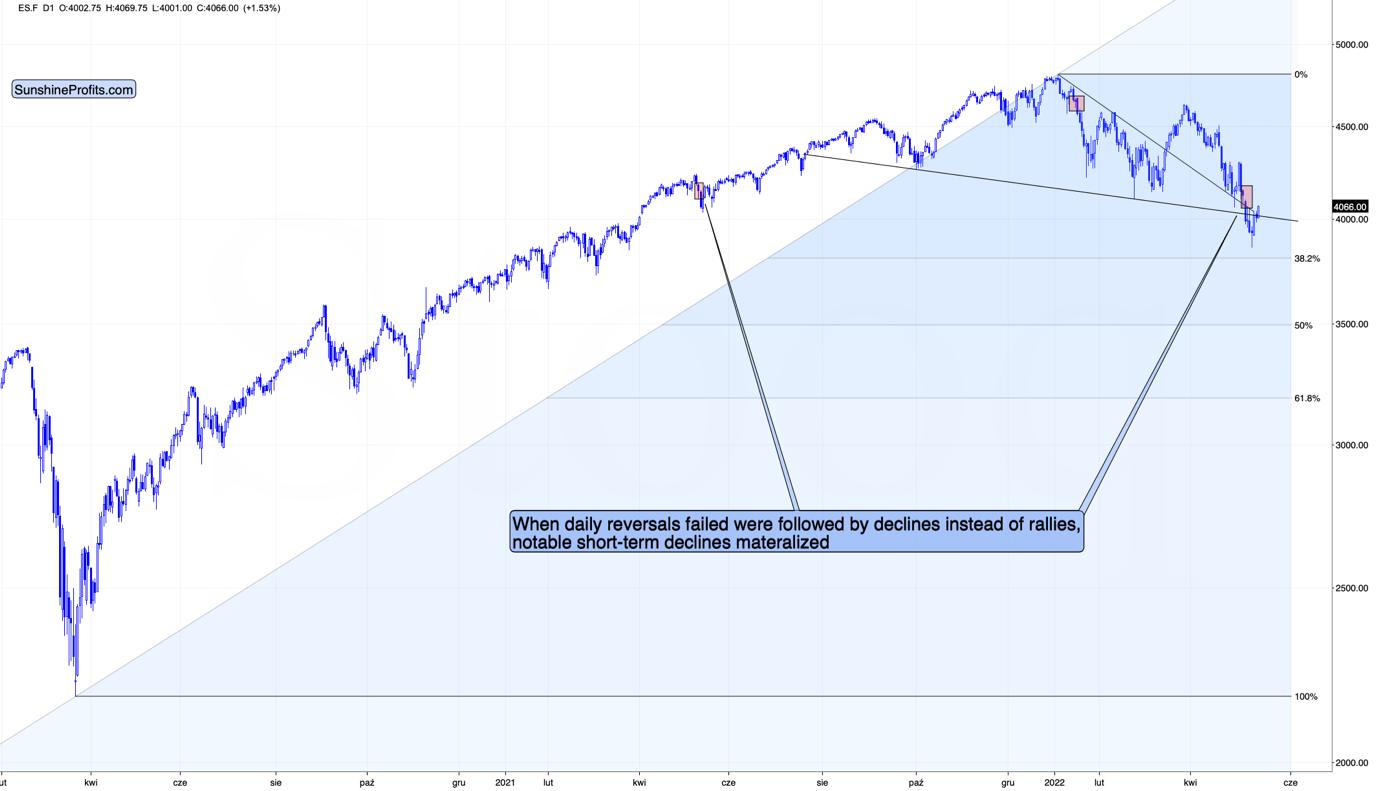
This means that the odds of a short-term rally in the following days have greatly increased. This makes the current long position in junior mining stocks even more justified.
Also, as far as the USD Index is concerned, I previously wrote the following:
The higher of the recent highs is at 103.96 right now, so if the analogy to 2014 is to remain intact, the USD Index could now top at close to 104.5 or even 105.
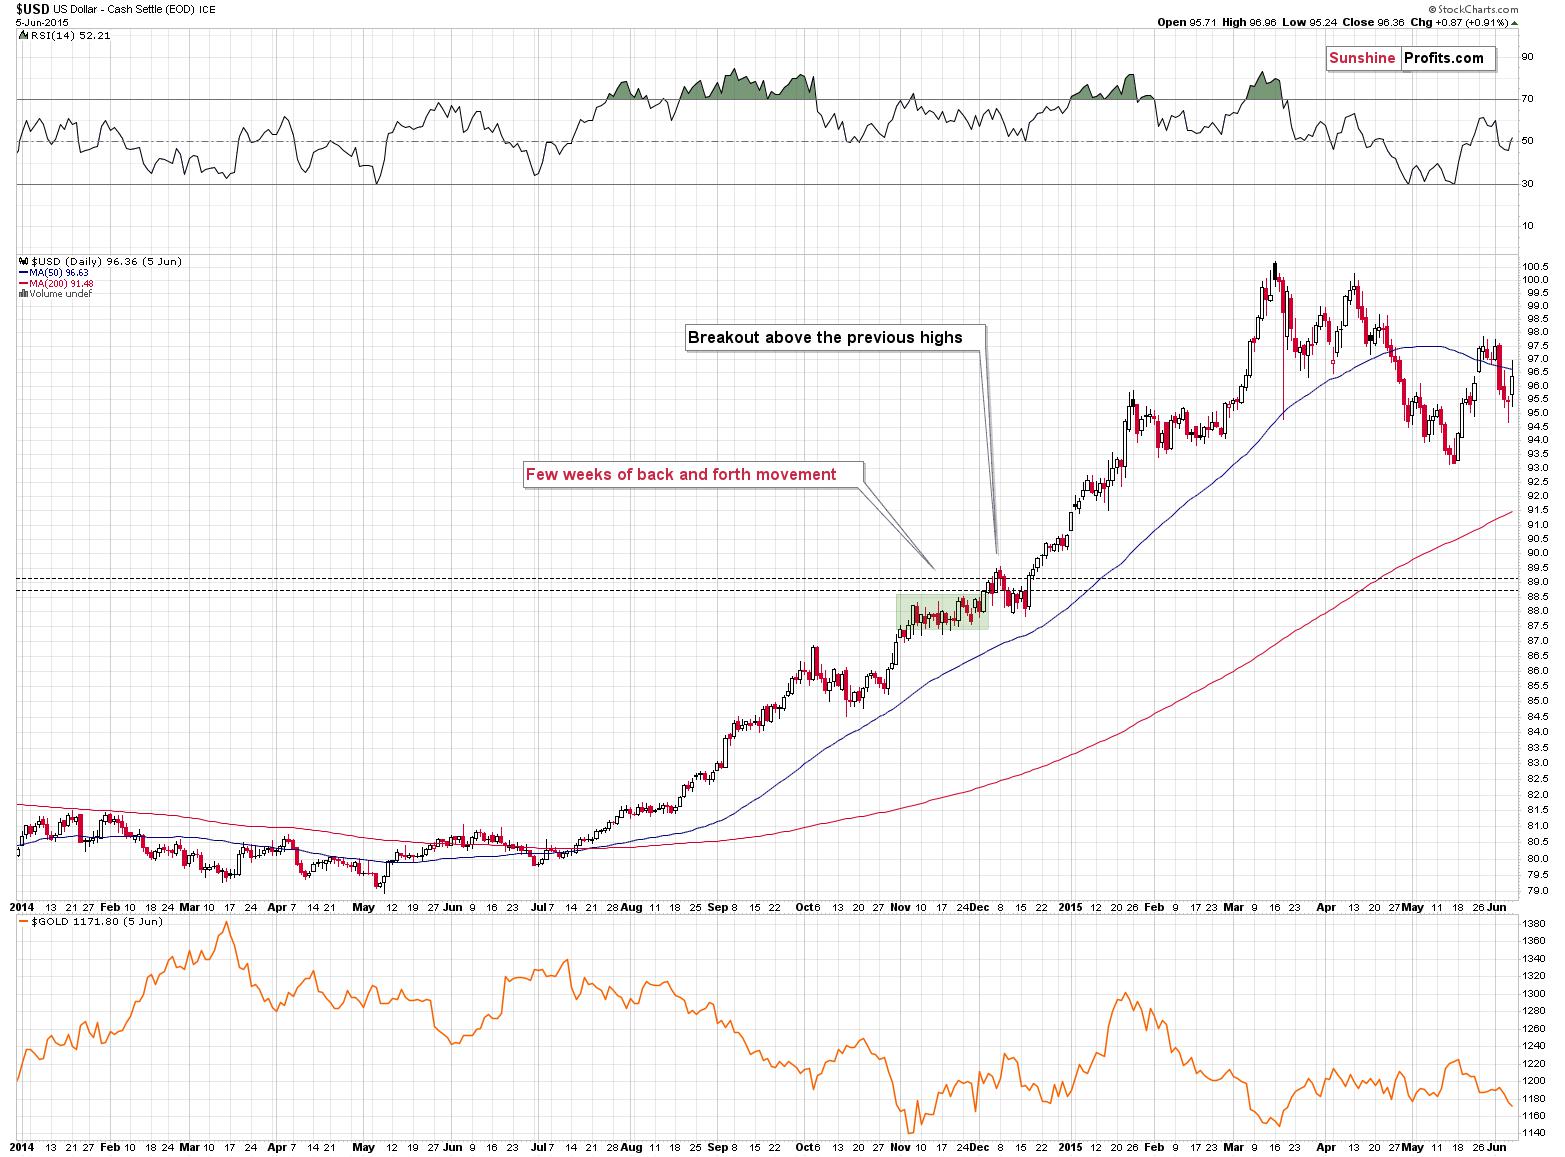
That’s exactly what happened recently. On Thursday, the USD Index moved to 104.96, and in Friday’s trading it rallied above 105 (to 105.065) and it invalidated the breakout above this level - which is in perfect tune with what I wrote above. Consequently, it seems that we could now see a move to about 103-103.5, after which USD’s rally could continue.
The opposite is likely to take place in the precious metals sector. Gold, silver, and mining stocks are likely to rally in the near term, and then – after topping at higher levels – their decline would continue.
The USD Index futures moved to about 103.7 in today’s pre-market trading (so far), so you might be wondering if the bottom is in or about to be, and therefore, will gold stop rallying.
Please note that it’s possible that the USD Index bottoms shortly in the 103-103.5 range but then continues to trade sideways for a few days, while gold continues to rally. In fact, that’s what happened in late 2014. Consequently, what we saw so far today doesn’t imply that gold’s, silver’s, or miners’ rallies are over.
Read Full Story »»»
 DiscoverGold
|
Followers
|
149
|
Posters
|
|
|
Posts (Today)
|
0
|
Posts (Total)
|
5695
|
|
Created
|
06/29/08
|
Type
|
Free
|
| Moderators DiscoverGold trunkmonk | |||

http://www.vaneck.com/index.cfm?cat=3192&tkr=GDX&LN=3-02
The Gold Miners ETF seeks to replicate as closely as possible, before fees and expenses, the price and yield performance of the NYSE Arca Gold Miners Index. The Index provides exposure to publicly traded companies worldwide involved primarily in the mining for gold, representing a diversified blend of small-, mid- and large-capitalization stocks. As such, the Fund is subject to the risks of investing in this sector.
| ||||||||||||||||||||||||||||||||||||||||||||||||||||||||||||||||||||||||||||||||||||||||||||||||||||||
| DAILY |
| WEEKLY |

| Volume | |
| Day Range: | |
| Bid Price | |
| Ask Price | |
| Last Trade Time: |
