 News
News  Market Data
  Discover
Support: 888-992-3836
Copyright © 2023 InvestorsHub Inc.


Register for free to join our community of investors and share your ideas. You will also get access to streaming quotes, interactive charts, trades, portfolio, live options flow and more tools.
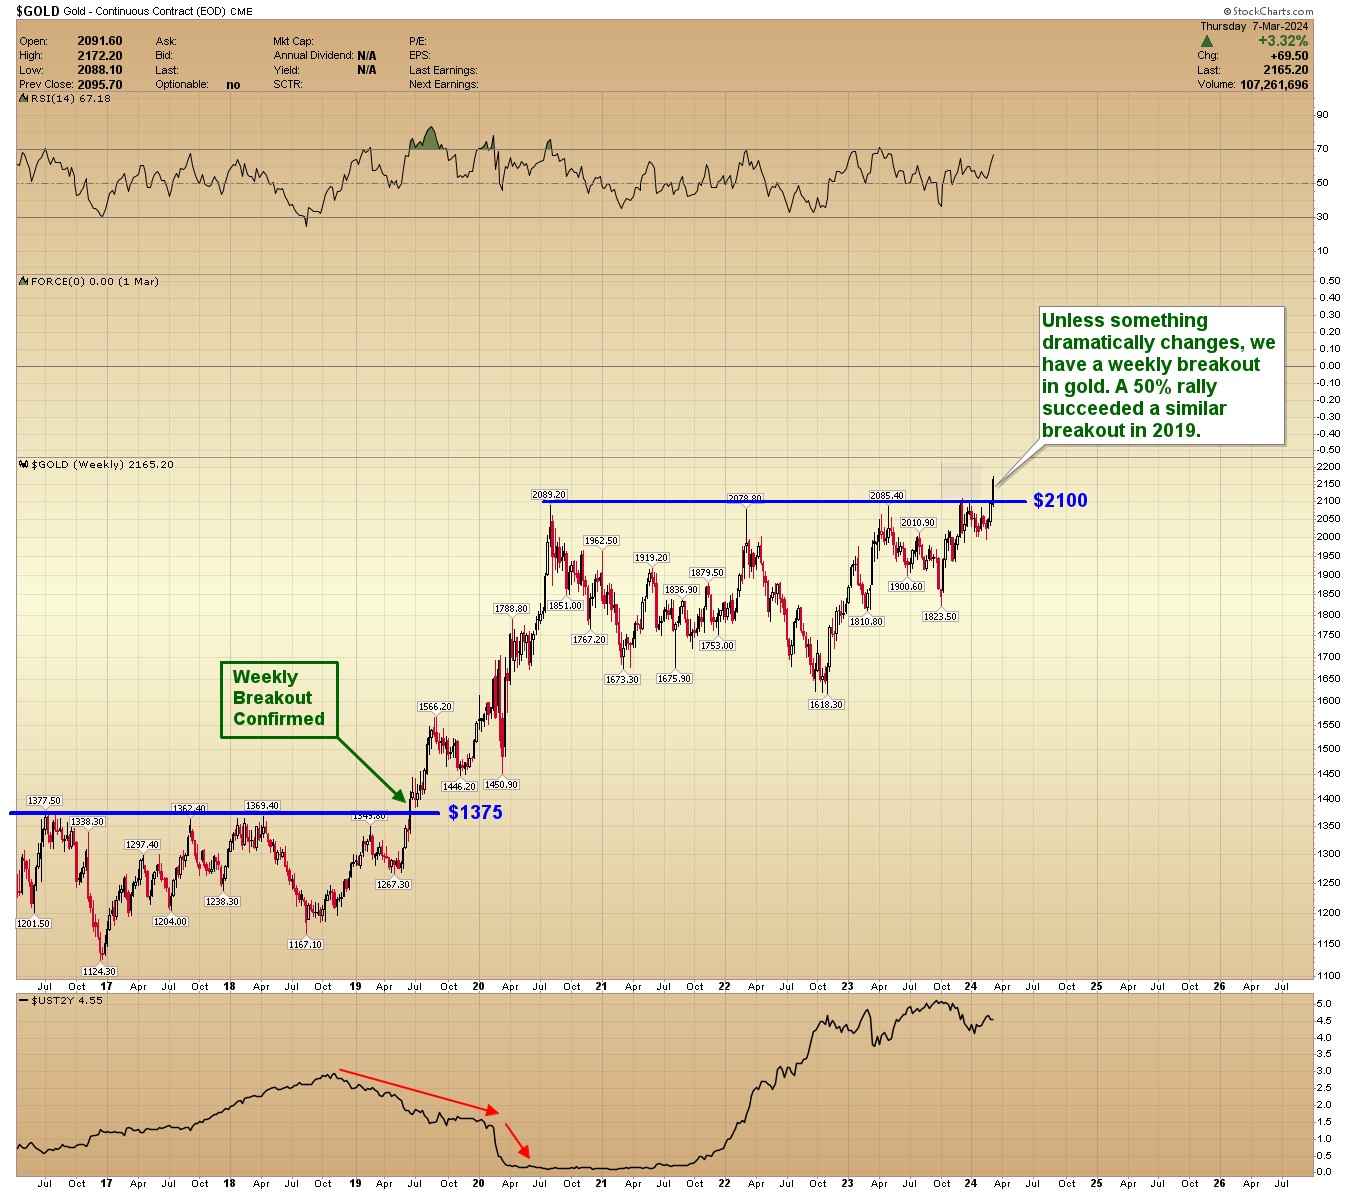
Precious Metals & Mining Update - GOLD WEEKLY - Unless something dramatically changes, we have a weekly breakout in gold.
A 50% rally succeeded a similar breakout in 2019.
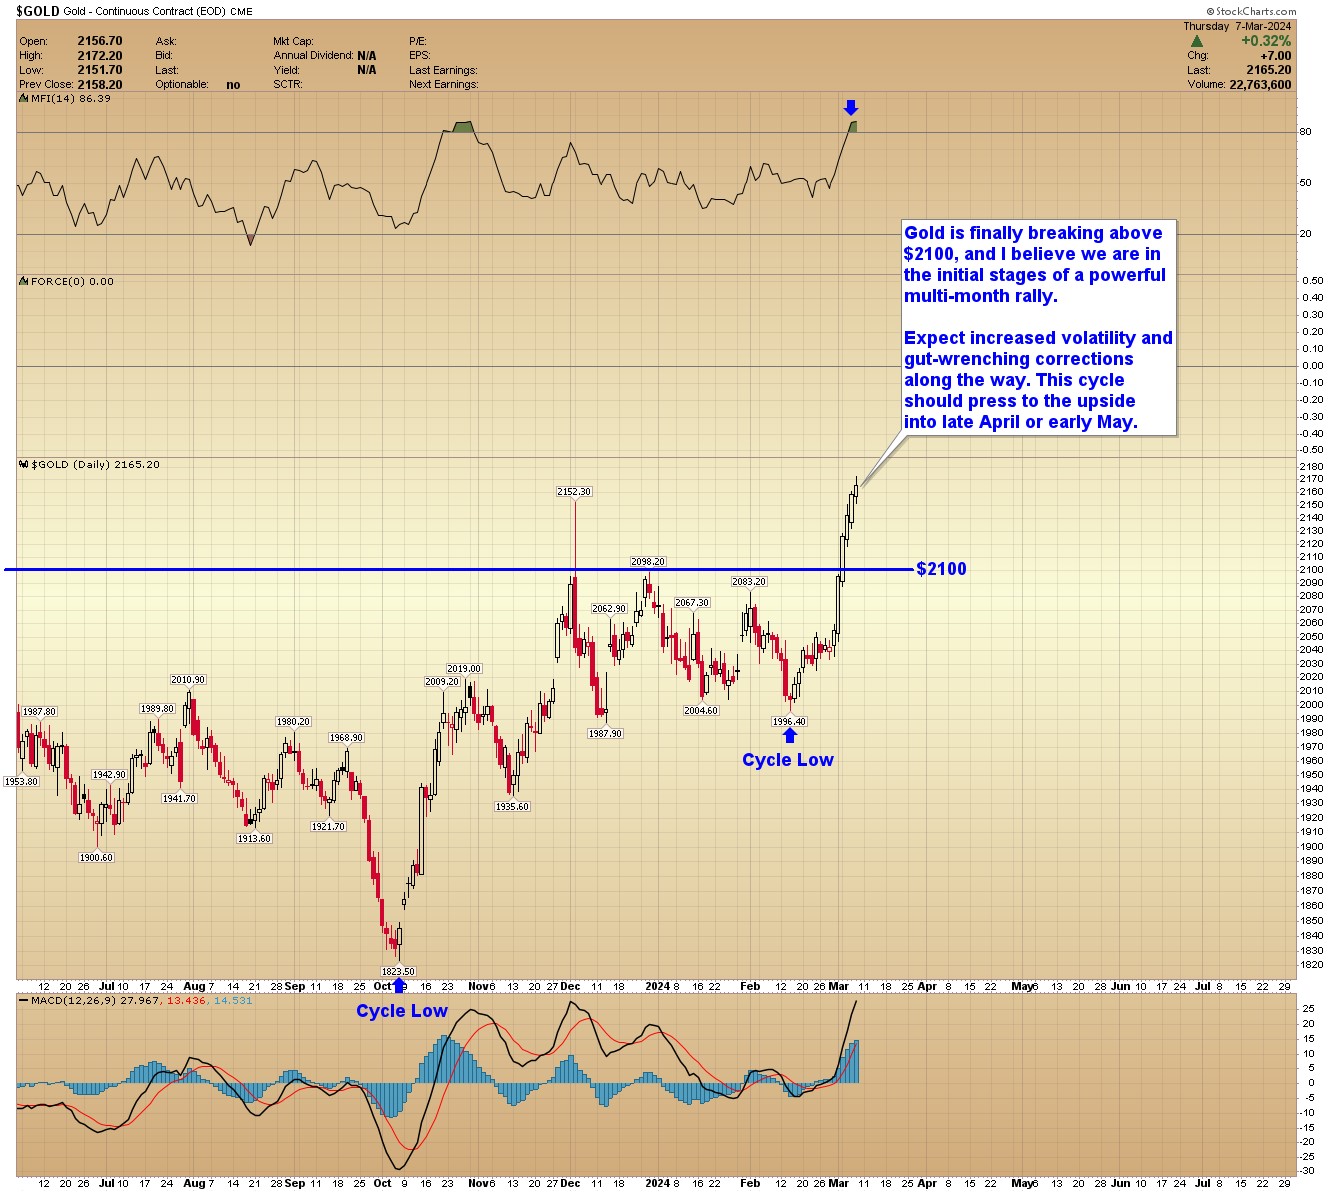
GOLD DAILY- Gold is finally breaking above $2100, and I believe we are in the initial stages of a powerful multi-month rally.
This cycle should press to the upside into late April or early May.
RESTART GREAT GOLD MINE - ABCOURT MINES | Red Cloud's Pre-PDAC 2024 -
Red Cloud TV


.jpg)


 )
) 


Gold Flies to Fresh All-Time Highs
By: Mark J Lundeen | March 10, 2024
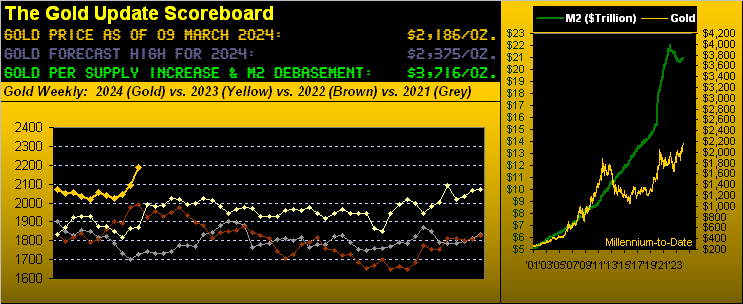
With The Gold Update now in its 16th calendar year and price having just made a series of marginal fresh All-Time Highs these past three trading days (2161 Wednesday, 2172 Thursday, 2203 Friday), on the surface we deem this as a somewhat exciting event, Gold having then settled out the past week yesterday at 2186.
However: from a more studied purview, ’tis admittedly adequate to couch it all as rather “ho-hum” given how vastly undervalued Gold remains vis-à-vis the above Scoreboard. Therein, the current market level of 2186 is -41% below the Dollar debasement valuation of 3716. Or for you WestPalmBeachers down there, Gold still has a very long way to go up — and moreover — that ’twill so do given price historically always catches up to prior high levels of valuation. This is starkly shown in the above right-hand panel, wherein clearly Gold whilst now nicely getting some up-curl remains well behind the money supply green line’s continuing to unfurl. And to be sure: this time ’round such catch-up process is seemingly taking forever.
Still, we take heart in Gold’s having thus far traveled this year some 38% of the route from last year’s settle (2072) toward this year’s forecast high (2375). And from the “Wishful Thinking Dept.”, extrapolating the current year-to-date pace would place Gold at our 2375 forecast high come 21 June, followed by 2764 for year-end. ‘Course, hardly are we holding our breath for it to all go that exquisitely perfect, but ’tis nonetheless a tasty technical tidbit.
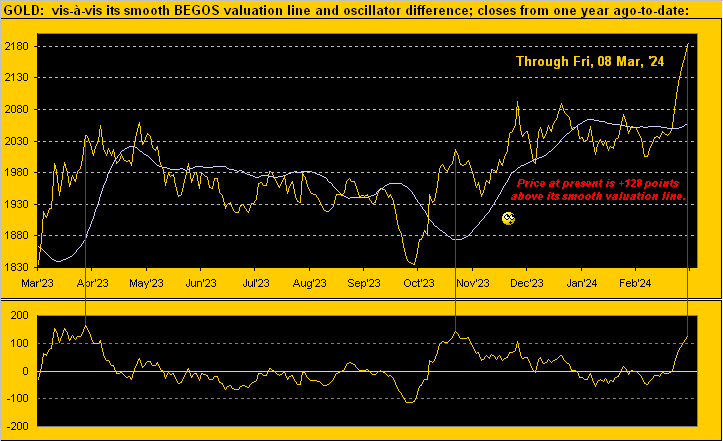
Further from the “Keeping One’s Feet on the Ground Dept.” whilst such an extensive BEGOS Market (Bond / Euro / Gold /Oil / S&P) movement (be it up or down) naturally pulls price away from our proprietary “smooth valuation line”, as this next graphic shows, reversion to said smooth line eventually recurs over time. And per the lower panel oscillator (price less valuation), at present, Gold (2186) is +128 points above that line (2058): obviously the prior two such extremes (red vertical lines) from a year ago-to-date in turn both lead to at least some material near-term price retrenchment. That cited, Gold’s recent peaks across the past three months in the 2090-2070 area appear supportive, (or more optimistically: gone are the days of the 1900s). Here’s the graphic:
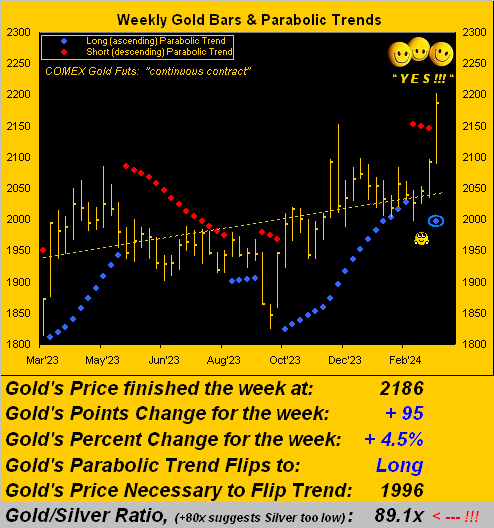
Next let’s turn to Gold’s weekly bars and parabolic trends from one year ago-to-date. This past week’s price upthrust comprehensively hoovered away the remnants of the ever so short-lived red-dotted parabolic Short trend, flipping it to Long in fine style per the new rightmost blue dot. Therein, we can’t help but notice the past two parabolic Short trends could not manage more than three weeks of red-dotted duration. Gold’s +5.5% low-to-high intra-week gain was the best in nearly a year, since that ending 17 March 2023, and the +4.5% net weekly gain the best since that ending this past 13 October. Think the buyers are in charge? “YES!!!” indeed:
Meanwhile in charging along with the stagflation theme nauseatingly herein detailed a week ago, the Economic Barometer’s set of 13 incoming metrics produced — as surmised — just five period-over-period improvements, notably with respect to job creation, albeit the rate of February’s Unemployment (despite the increase in Payrolls) jumped two pips from 3.7% to 3.9%. Still, there were some sore stinkers in the past week’s bunch: January’s Factory Orders sank at a -3.6% pace, the month’s Trade Deficit was the worst since that of last April, and credit cards rocketed into orbit as January’s Consumer Credit level leapt from $0.9B in December to $19.5B. “When ya don’t gots da dough, get out da plastic!” Afterall, there was almost no growth in February’s Hourly Earnings. And as for the Econ Baro itself, straight down continued as … well … straight down, even as Federal Reserve Chairman Jerome Powell in his Humphrey-Hawkins Testimony remained non-committal toward any near-term change in his Bank’s Funds Rate, (for which as you regular readers know the case can be made to actually increase it). “Oh, say it ain’t so!” Here’s the Baro:
“But the S&P 500 keeps sailing right along, eh mmb?“
So ‘twould appear, Squire, albeit the mighty Index did just (barely) record a down week (-0.3%), only its third such demise of not just the past the ten weeks year-to-date, but indeed since that ending 23 October … which for those of you scoring at home means the Casino 500 has spun 16 up weeks of the last 19. How rare are such streaks? On a mutually-exclusive basis, before this run, it had only occurred on two other occasions across the past 25 calendar years (during 2018 and 2011, prior to which was during 1989). And following the 2018 stint, the S&P then “corrected” as much as -18.3% within three months, whilst after the 2011 stint, the Index similarly dumped -16.9%. Also, this Casino 500 is now characterized as 35 consecutive trading days “textbook overbought”. So “Get Ready”–[The Temptations, ’66].
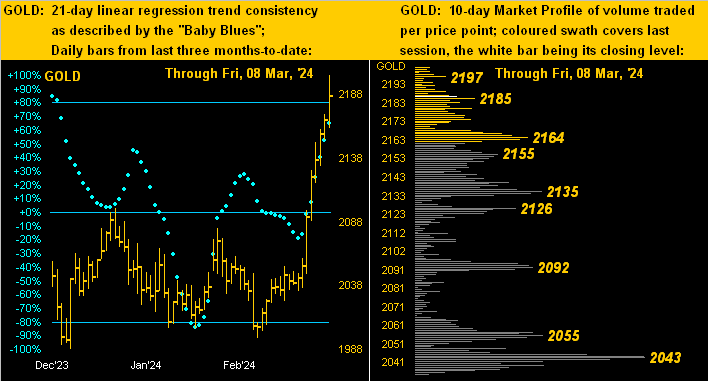
Tempting, too, is the track of Gold, certainly so since mid-February from the rightmost dominant low (1996) in the following left-hand panel of price’s daily bars from three months ago-to-date. In the right-hand panel we’ve Gold’s 10-day Market Profile with its bevy of volume-dominant support levels as labeled:
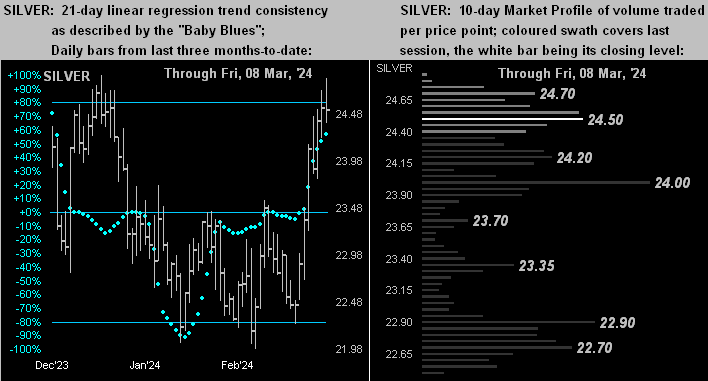
Silver’s setup is quite similar with her daily bars (below left) and Profile (below right). Again to expound upon that which we regulary harp, Silver — given the Gold/Silver ratio now at 89.1x — remains CHEAP! The ratio’s century-to-average is 68.1x: plug that into your HP 12C to see where Silver “ought” be(!)
To finish, with 15 metrics due next week for the Econ Baro including the Bureau of Labor Statistics’ reads on the pace of February inflation at both the retail and wholesale levels, we can’t resist going with this closing graphic as — after all — ’tis The Gold Update No. 747:
What fuels your financial jet? We trust ’tis Gold!
Read Full Story »»»
 DiscoverGold
Jack Chan: Gold Price Exclusive Update
By: Jack Chan | March 9, 2024
Our proprietary cycle indicator is now UP.
To public readers of our updates, our cycle indicator is one of the most effective timing tool for traders and investors. It is not perfect, because periodically the market can be more volatile and can result in short term whipsaws. But overall, the cycle indicator provides us with a clear direction how we should be speculating.
Investors
Accumulate positions during an up cycle and hold for the long term.
Traders
Enter the market at cycle bottoms and exit at cycle tops for short term profits.
GLD is on short term buy signal.

GDX is on short term buy signal.
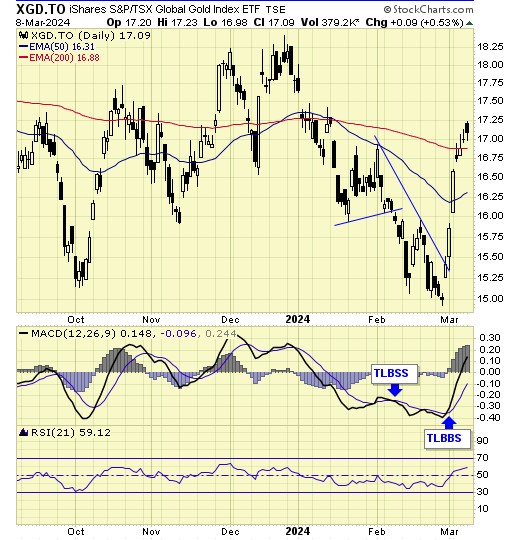
XGD.to is on short term buy signal.

GDXJ is on short term buy signal.
Analysis
Current data suggests overall higher gold prices.
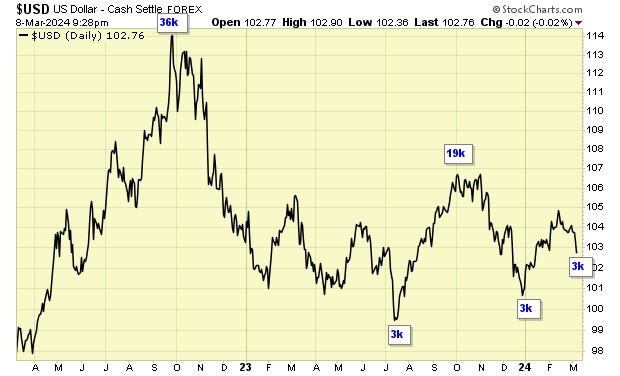
Current data supports an overall higher dollar.
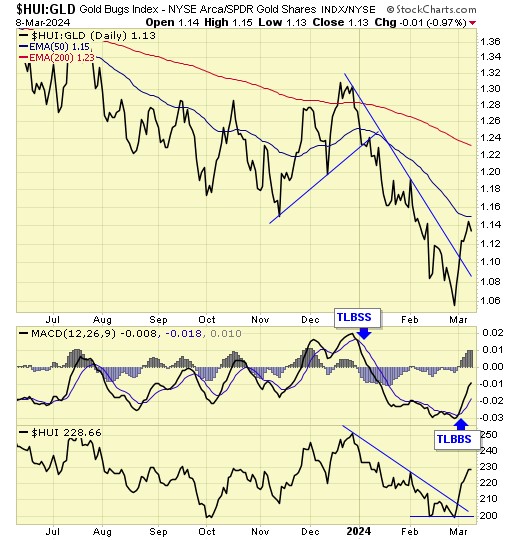
Our ratio is on a new buy signal.
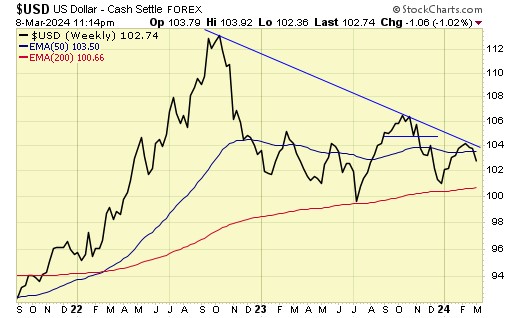
Trend is DOWN for USD.

Trend is DOWN for gold stocks.

Trend is UP for gold.

The underperfomance reached the lowest point in 2015, and we are now testing that low.
Summary
Gold sector cycle is up.
Trend is up for gold and down gold stocks, and down for USD.
$$$ We closed out 2023 with a nice profit. This marks the 5th straight profitable year for us.
Read Full Story »»»
DiscoverGold
$Gold is headed higher into the next 30 week cycle high in early July. I guess it could go as high as the 2.618 extension of the May-October decline at 2500 by July. Keep in mind there's going to be 1 more weekly cycle low between now and July so it's not going to be straight up.
By: CyclesFan | March 9, 2024
• $Gold is headed higher into the next 30 week cycle high in early July. I guess it could go as high as the 2.618 extension of the May-October decline at 2500 by July. Keep in mind there's going to be 1 more weekly cycle low between now and July so it's not going to be straight up.

Read Full Story »»»
DiscoverGold
Friday's Commitment of Traders (COT) Report from the CFTC had an interesting point about gold...
By: Tom McClellan | March 9, 2024
• Friday's Commitment of Traders (COT) Report from the CFTC had an interesting point about gold. The big money "commercial" traders responded to the rally in gold this week by posting the biggest jump in years in their collective net short position. This marks this week's pop as at least a short term price top.

Read Full Story »»»
DiscoverGold
NY Gold Futures »» Weekly Summary Analysis
By: Marty Armstrong | March 9, 2024
NY Gold Futures closed today at 21855 and is trading up about 5.48% for the year from last year's settlement of 20718. This price action here in March is reflecting that this has been still a bearish reactionary trend on the monthly level. As we stand right now, this market has made a new high exceeding the previous month's high reaching thus far 22030 intraday and is still trading above that high of 20832.
Up to now, we still have only a 2 month reaction decline from the high established during December 2023. We must exceed the 3 month mark in order to imply that a trend is developing.
ECONOMIC CONFIDENCE MODEL CORRELATION
Here in NY Gold Futures, we do find that this particular market has correlated with our Economic Confidence Model in the past. The Last turning point on the ECM cycle low to line up with this market was 2022 and 2015. The Last turning point on the ECM cycle high to line up with this market was 2020 and 2011 and 1996.
MARKET OVERVIEW
NEAR-TERM OUTLOOK
The NY Gold Futures has continued to make new historical highs over the course of the rally from 2015 moving into 2024. However, this last portion of the rally has taken place over 9 years from the last important low formed during 2015. Prominently, we have elected four Bullish Reversals to date.
This market remains in a positive position on the weekly to yearly levels of our indicating models. Pay attention to the Monthly level for any serious change in long-term trend ahead.
Looking at the indicating ranges on the Daily level in the NY Gold Futures, this market remains in a bullish position at this time with the underlying support beginning at 21505.
On the weekly level, the last important high was established the week of March 4th at 22030, which was up 3 weeks from the low made back during the week of February 12th. So far, this week is trading within last week's range of 22030 to 20881. Nevertheless, the market is still trading upward more toward resistance than support. A closing beneath last week's low would be a technical signal for a correction to retest support.
When we look deeply into the underlying tone of this immediate market, we see it is currently still in a weak posture. This market has made a new historical high this past week reaching 22030. Here the market is trading positive gravitating more toward resistance than support. We have technical support lying at 21186 which we are still currently trading above for now.
Right now, the market is above momentum on our weekly models hinting this is still bullish for now as well as trend, long-term trend, and cyclical strength. Looking at this from a wider perspective, this market has been trading up for the past 3 weeks overall.
INTERMEDIATE-TERM OUTLOOK
YEARLY MOMENTUM MODEL INDICATOR
Our Momentum Models are declining at this time with the previous high made 2020 while the last low formed on 2023. However, this market has rallied in price with the last cyclical high formed on 2023 and thus we have a divergence warning that this market is starting to run out of strength on the upside.
Looking at the longer-term monthly level, we did see that the market made a high in December 2023 at 21523. After a thirteen month rally from the previous low of 19879, it made last high in December. Since this last high, the market has corrected for thirteen months. However, this market has held important support last month. So far here in March, this market has held above last month's low of 19964 reaching 20470.
Critical support still underlies this market at 19070 and a break of that level on a monthly closing basis would warn that a sustainable decline ahead becomes possible. Nevertheless, the market is trading above last month's high showing some strength.
DiscoverGold
Gold $GLD - Extreme Bull. The targets are a combination of Swings, Patterns & Measured Moves, along with Fibonacci Extensions
By: Sahara | March 9, 2024
• $GOLD $GLD - Extreme Bull.
The targets are a combination of Swings, Patterns & Measured Moves, along with Fibonacci Extensions.
Want to see this pop of the 'Cup' hold. If so then I'll be monitoring those Channel-Lanes for resistance and spprts.

Read Full Story »»»
DiscoverGold
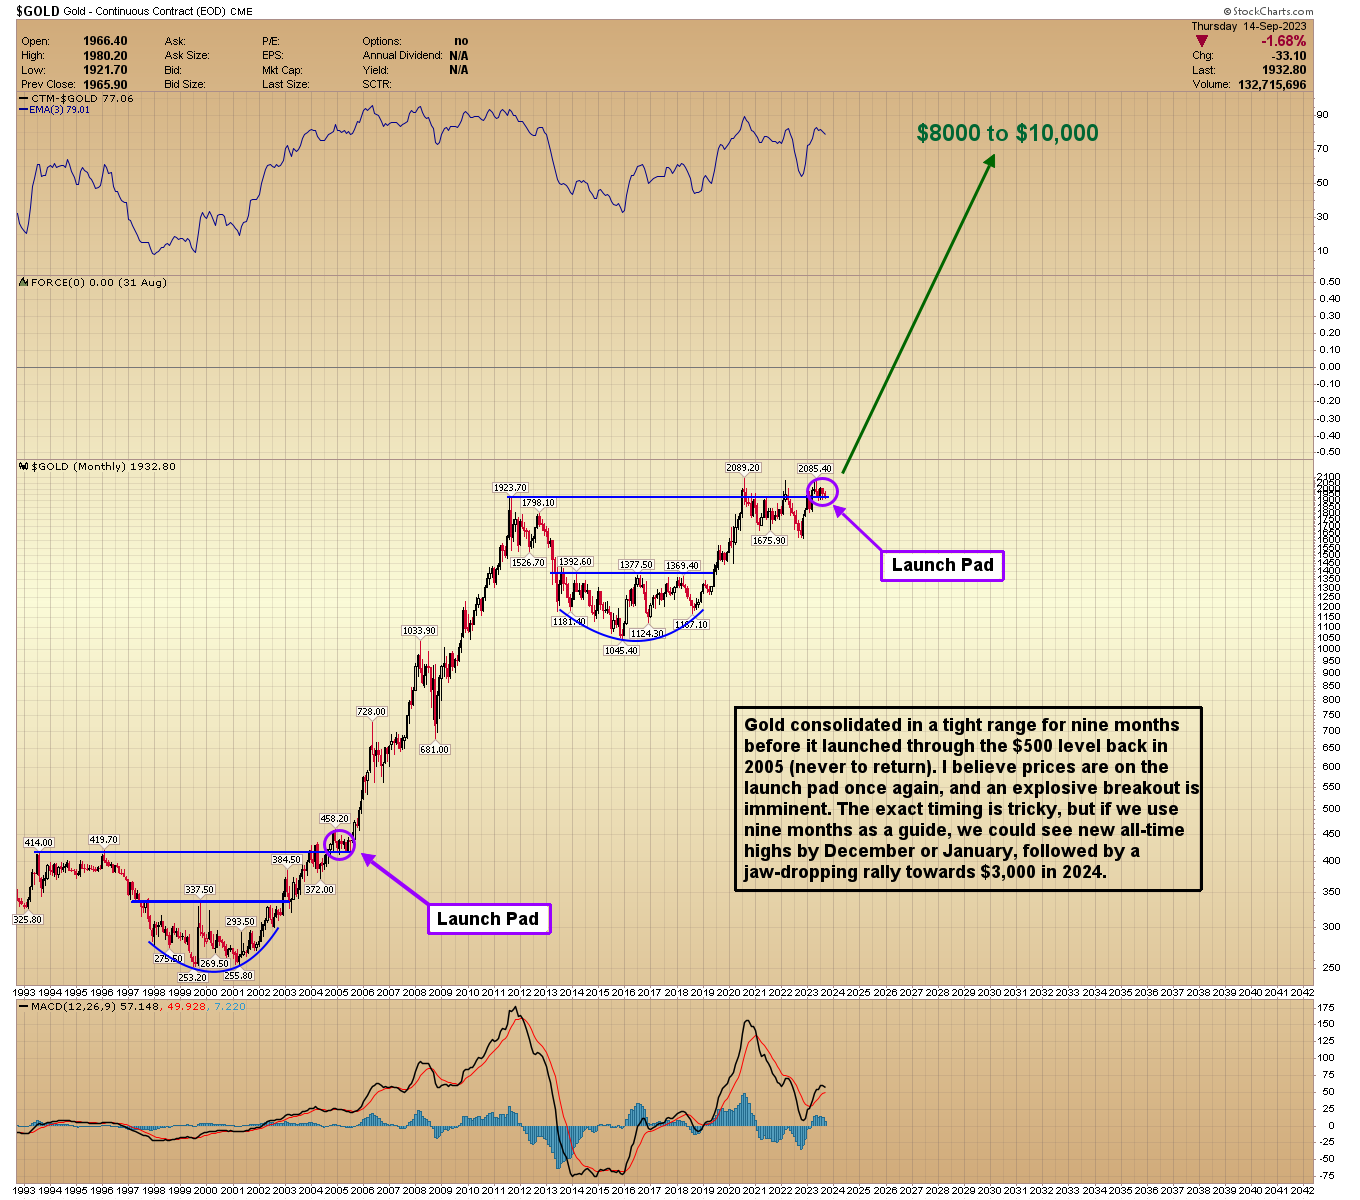
Look At Gold Go For Benchmarks
By: Marty Armstrong | March 9, 2024
The Benchmark Cycles in the Metals come together once every 2.67 years. They will often highlight at least a temporary turning point, and then we run cycles on those that will signal the major convergences, such as the 1980 event. This is NOT a 1980 major event, but it is a period of a temporary turning point. Most goldbugs will be screaming that this is the breakout for $10,000. Sorry, not yet. Gold is rallying nicely into the Benchmark. Remember that, again, these Benchmarks are NOT included in the Timing Arrays, which are totally determined by Socrates. These Timing Arrays also do not include the Economic Confidence Model. Socrates determines the timing all by itself - no human intervention. Therefore, it is of great importance to see the Timing Array line up with these human-discovered cycles.
The Benchmark Convergences here in 2024 are the weeks of:
Gold & Silver the Benchmarks
03/11/2024 Silver
03/18/2024 Gold
07/08/2024 Gold
07/15/2024 Silver
We can see that the first bank of overhead resistance in gold stands at 2250 level with the extreme resistance at the 2316 area. You can see we have a turning point this week coming and a Panic Cycle the week of the 18th. This lines up perfectly with the Benchmarks. Therefore, we should expect to see this create a temporary high. Now look at the red line, which is the prior resistance that kept the market flat. What we need to see is gold fall back after this but hold that support at the $2,000 level in general. The next convergence is July, which has been my concern about any escalation of war might begin.
When we turn to the Monthly Timing Array, it is easy to see that we should have expected high volatility here in March. But April is a turning point and a Directional Change. The volatility appears to rise again after July. The next time these Benchmarks will converge will be December 2026 and April 2027. This will be the next MAJOR turning point in the metals on a yearly level after 2024. We will have to watch the $1985 level from here on out. A monthly closing below this area would ring the alarm bell that they will be more devisious than anyone expects.
DiscoverGold
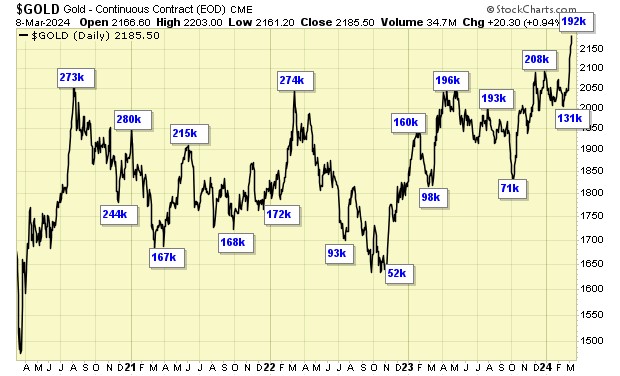
Gold CoT: Peek Into Future Through Futures, How Hedge Funds Are Positioned
By: Hedgopia | March 9, 2024
• Following futures positions of non-commercials are as of March 5, 2024.
Gold: Currently net long 191.3k, up 49.7k.
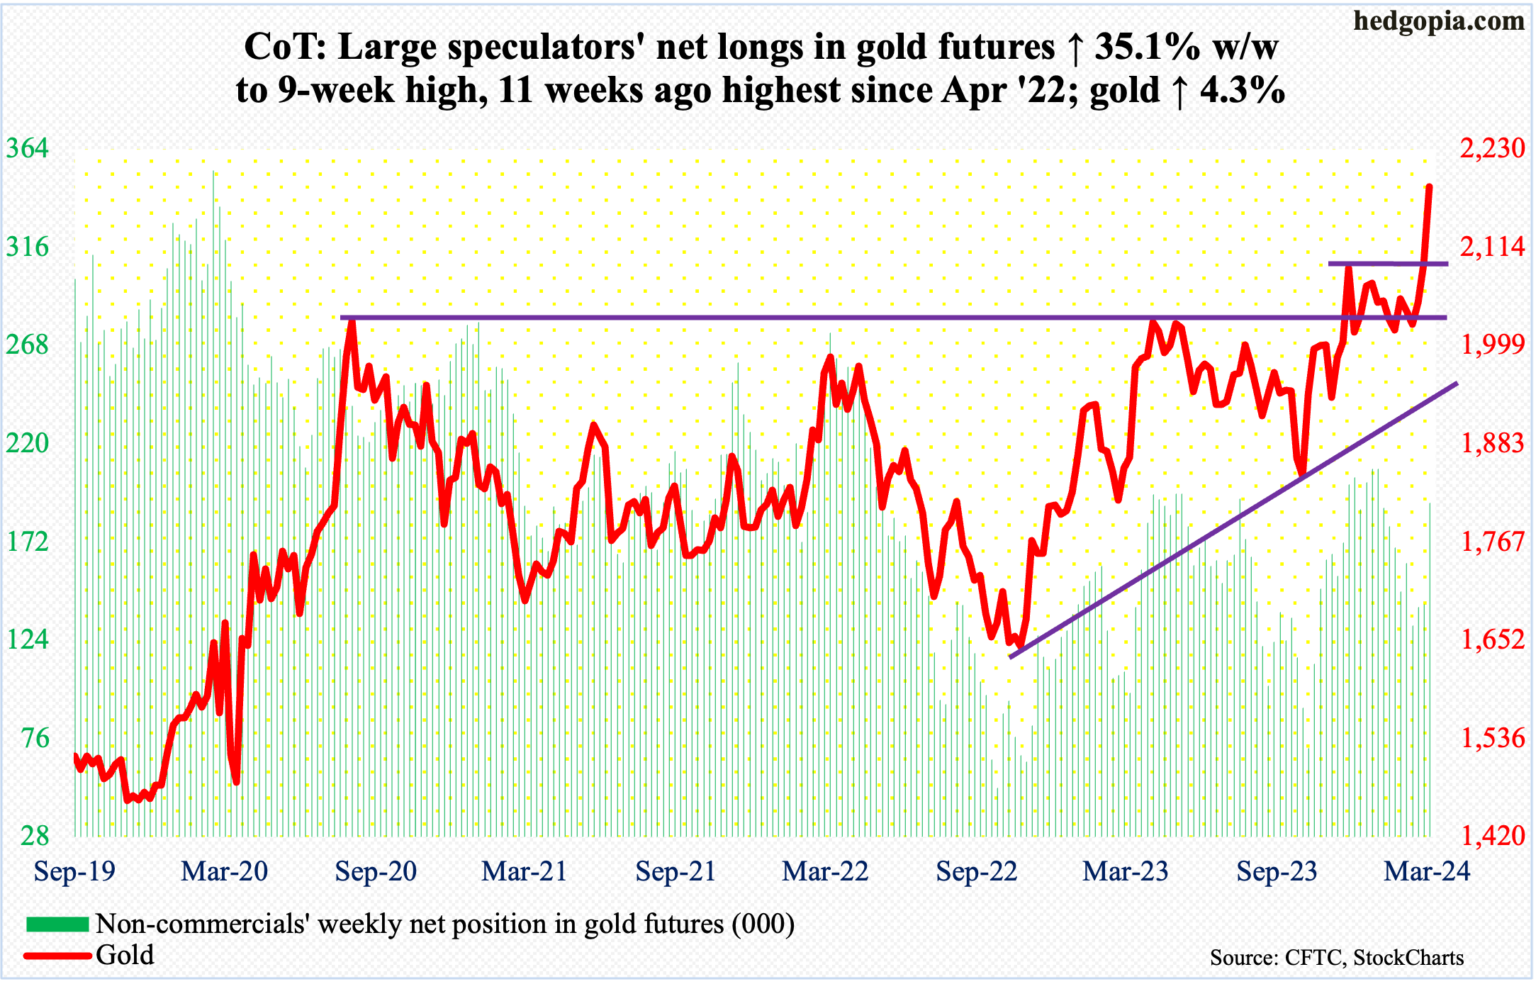
Gold bugs were able to build on last week’s action, when the metal closed at $2,096 – just above major resistance at $2,080s. This level has acted as a ceiling ever since August 2020 when gold reached $2,089 and retreated. After that, rally attempts stopped in March 2022 ($2,079), May last year ($2,085) and several times this year, not to mention last December when the metal hit a new high of $2,152.
This week, the December high was surpassed, with the yellow metal reaching $2,203 on Friday, closing at $2,186/ounce.
Gold has broken out of a long base. This is occurring at a time when equities, after massive rallies since last October’s lows, are showing signs of exhaustion.
The only thing is that gold has rallied for seven sessions in a row, with a somewhat parabolic look to it. A little backing and filling will be healthy.
Read Full Story »»»
DiscoverGold
Gold Record Highs, but Is a Pullback Coming?
By: Bruce Powers | March 8, 2024
• Gold marks eighth consecutive day of price increases, showing strong upward momentum but signaling a possible temporary top and pullback.
Today, Friday, marks the eighth consecutive day in a row that the price of gold has progressed higher. On each of those days there has been a daily close above the high of the prior day. That is one sign of strong upward momentum. The uptrend has been clear, and it continued today with gold reaching a high of 2,195 before backing off. However, trends retrace and given initial signs of resistance today, at least a temporary top may have been reached leading to a pullback.

Key Target Reached
The 2,195-price zone (1,189 – 2,194) was highlighted in prior articles recently as a primary initial target for gold. It was identified from the two impulse rallies starting from the early-October swing low (A). A 10.5% advance of the rally from the recent swing low from mid-February completed at 2,194. In addition, an initial target derived from measuring the symmetrical triangle marked on the chart was at 2,189. Finally, you can see almost an exact hit with the 1.414% Fibonacci extension of the retracement from the decline following the May 4, 2023, swing high.
Long-Term Bullish Strength Signaled
Strength of the long-term breakout will confirm this week as gold is on track to close well above the prior record high of 2,135 from December. The breakout is very bullish as it occurred from a multi-year basing period for gold. Moreover, there have been three prior new record high breakouts starting from 2022 where the new high week closed above the prior record high. That will be the case this week and highlights strong upward momentum.
Risk of Retracement Increases
Nevertheless, as alluded to above, gold has reached a target and is extended. A correction of some degree could begin soon. The next sign of weakness that could lead to a deeper retracement occurs on a drop below today’s low of 2,154. Subsequently, a test of support near the prior high of 2,135 would not be surprising. The 38.2% Fibonacci retracement level is at 2,115, which is very close to the 8-Day MA at 2,111. A more significant potential support level looks to be down around 2,088. Regardless, gold’s bullish breakout is not a secret and will likely continue to support improving demand in the previous metal.
Read Full Story »»»
DiscoverGold
REALMONEY GOLD & SILVER Indicators Show Gold is About to Run Up and Gold Stocks Will Go Even Higher: Michael Oliver
Natural Resource Stocks


 )
) 
Interesting multi factor study on GOLD. Good example of using 'observations' that resonate in a structured study
By: Nautilus Research | March 8, 2024
• #gold $gld Interesting multi factor study on GOLD. Good example of using 'observations' that resonate in a structured study.

Read Full Story »»»
DiscoverGold
Gold Price Forecast: Symmetry Points to Higher Prices
By: Bruce Powers | March 7, 2024
• Gold's rally shows symmetry with past moves, hinting at higher prices. Current 9.1% increase nears a 10.5% target, with 2,194 as a significant resistance zone potentially.
Enthusiasm for gold shows no signs of stopping just yet. On Thursday the precious metal reached a new trend high of 2,165. And it is on track to close relatively strong, in the top third of the day’s range and above yesterday’s high of 2,152. Certainly, it looks overbought with price extended. In the very short-term it may be. Nevertheless, there were two sharp rallies earlier in the trend, coming off the October 6 swing low, that provide evidence for further upside in the near-term.

Two Earlier Impulse Rallies
The two earlier rallies referenced each completed in 15 days with the first seeing an 11% advance and the second a 10.5% increase in price. This shows symmetry between the two swings in both price and time. Given symmetry earlier in the trend, we may yet see it again in the current advance. Today is the 16th day of the rally when starting from the February 14 swing low. So, there may only be a match in time if today’s high is a top. However, the price relationship points to higher prices.
Symmetry Occurs at 2,194 Target Zone
Gold would need to rally to 2,194 price range to reach a 10.5% advance from the February low. Each of the prior impulse moves had a short two-day pullback before moving higher. We could surely see similar behavior in the current impulse rally on the way to 2,194. That target is given greater significance because the measuring objective or target derived from the symmetrical triangle shown on the chart is close at 1,189. Two methods pointing to a similar price zone.
Up as Much as 9.1% to Date
The current rally has seen the price of gold rise by as much as 9.1%. Not too far away from the 10.5% performance target. Given the clear rise in demand and high momentum seen in this rally, if a short-term stall comes, it may be used quickly by traders to enter or add to positions thereby pushing prices still higher. The 2,194-target zone is a pivot where resistance may be seen, or another breakout and confirmation of strength occurs on a decisive rally above 2,194.
Read Full Story »»»
DiscoverGold
ARIS MINING REPORTS 2023 RESULTS WITH GUIDANCE ACHIEVED, NET EARNINGS OF $11.4M, ADJUSTED EARNINGS OF $52.2M ($0.38/SHARE),
ADJUSTED EBITDA OF $159M
March 06, 2024
Download(opens in new window)
VANCOUVER, BC, March 6, 2024 /PRNewswire/ -
Aris Mining Corporation (Aris Mining or the Company) (TSX: ARIS) (NYSE-A: ARMN) announces financial and operating results for the three and twelve months
ended December 31, 2023 (Q4 2023 and FY 2023, respectively). All amounts are in US dollars unless otherwise indicated.
https://www.aris-mining.com/news/news-details/2024/ARIS-MINING-REPORTS-2023-RESULTS-WITH-GUIDANCE-ACHIEVED-NET-EARNINGS-OF-11.4M-ADJUSTED-EARNINGS-OF-52.2M-0.38SHARE-ADJUSTED-EBITDA-OF-159M/default.aspx
https://investorshub.advfn.com/boards/read_msg.aspx?message_id=173916527
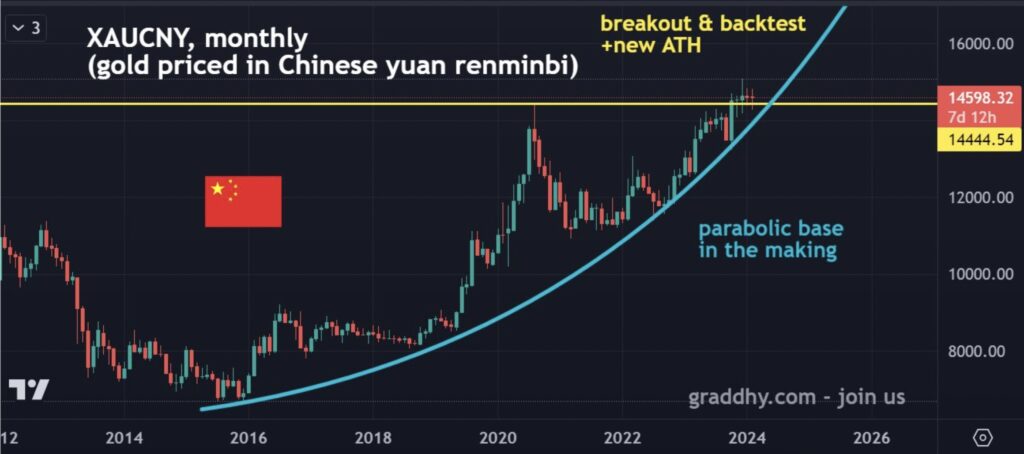
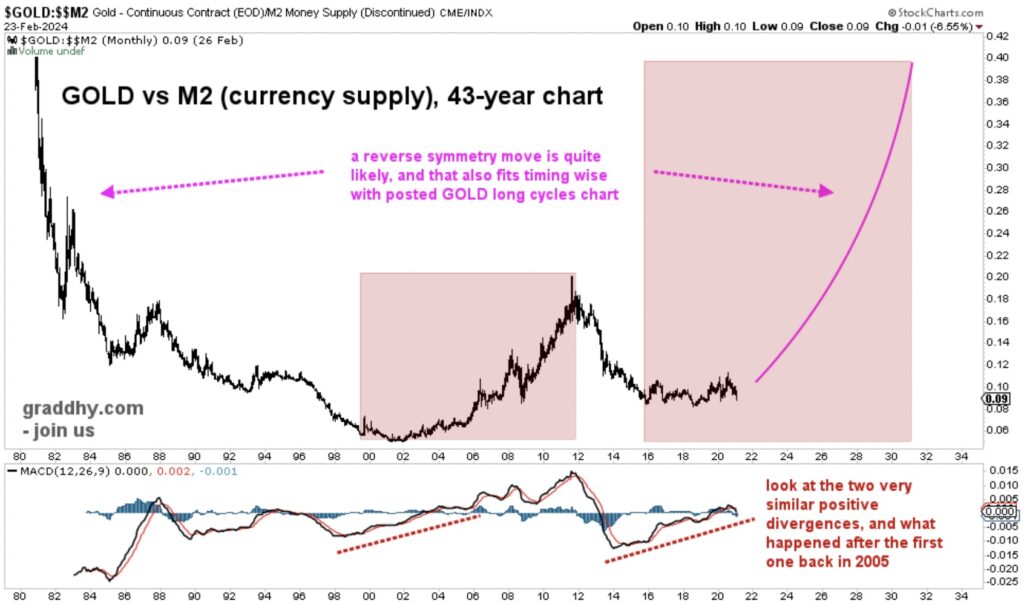
Gold vs M2 Money Supply:
Gold Massively Undervalued vs US Money Supply
$NEWS - Is Gold Setting Up for a Huge, Once in a Generation, Rally?
By Chris Vermeulen
Is there a generational opportunity coming to get into gold?
) Gold $GLD - Hghr Targets...
By: Sahara | March 7, 2024
• $GOLD $GLD - Hghr Targets...

Read Full Story »»»
DiscoverGold
Velocity of money used to be very significant, and was important to Debt/GDP ratio. it crashed but nothing became of it so people stopped looking at it. guess what, its everything it used to be, printing of money for past 10 years has skewed everything, including real money value. its gonna show bigtime soon.
.png)
Gold vs M2 Money Supply:
Gold Massively Undervalued vs US Money Supply
$NEWS - Is Gold Setting Up for a Huge, Once in a Generation, Rally?
By Chris Vermeulen
Is there a generational opportunity coming to get into gold?
) 12 years in the making. $GLD 🥇
— TrendSpider (@TrendSpider) March 3, 2024
Weekly newsletter out tomorrow, sign up for free.
📬 https://t.co/QzvevHvbNs pic.twitter.com/KmlPSJVegT
Gold New Record High, Eyes Further Upside
By: Bruce Powers | March 6, 2024
• Gold's breakout from multi-year basing phase is supported by monthly breakouts and symmetrical triangle breakout signals. Potential for further upside, aiming for 2,189.
Gold managed to continue its ascent on Wednesday as it reached a new record high of 2,152, pulling back slightly. Significantly, it is on track to close above the previous record high of 2,135 for the first time. However, this is not the first-time gold has closed above the prior record high. Each of the prior attempts since August 2020 were followed by notable corrections. This time seems different, but we need to see additional clues showing increasing demand. How the retracement occurs, once it happens, should be telling.

Support Levels if Pullback Begins
Each of several price zones noted on the way up is where to watch for potential support on the way down if a retracement comes before new trend highs. Near-term support is at today’s low of 2,124. A decline below that low is the sign of weakness that could lead to a deeper pullback. The prior record high at 2,135, followed by the prior swing high at 2,088 (B) are the first areas to watch for signs of support. Subsequently, there is the 8-Day MA at 2,076 followed by the 2,066, which was previously resistance over several days.
Breakout of Multi-Year Base
Gold is in the process of attempting to breakout of a multi-year basing period. It is supported by signs in the monthly chart, which show a consolidation phase for the past several months. On the weekly and daily charts, the consolidation pattern took the form of a symmetrical triangle. The breakout of the pattern has been clear and decisive. As of today, the price of gold has risen above the top of the pattern, further confirming strength. It also can be seen as improving the potential for gold to reach the minimum target projected from the pattern at 2,189. Whether it does so before or after a retracement remains to be seen.
Measured Moves Confirm Triangle Target
Previous measured moves provide further evidence for the 2,189-target zone being reached. Gold had two relatively sharp advances starting from the October 2023 swing low. A degree of symmetry shows between the two moves. The first advance was 11% and the second 10.5%. Gold will match a 10.5% rally in the current advance once it reaches 1,194, just five points from the triangle target.
Read Full Story »»»
DiscoverGold
Gold Surge to 2,142 and Beyond
By: Bruce Powers | March 5, 2024
• Gold's rapid ascent to a new record high of 2,142 reflects strong demand, with further bullish indications as it surpasses key targets and sets new closing price records
It did not take very long for gold to hit a new record high of 2,142 once demand kicked in. A four-week high was reached last Thursday before three sharp daily rallies occurred. Including today, they can be seen as three wide range green candles on the chart. Moreover, the first higher target discussed previously was reached at 2,131 today. Not only was the previous record high of 2,035 close to that target, but also a rising ABCD pattern extended by the 127.2% Fibonacci ratio completed there as well.

Watching for Daily Close Above 2,035
Gold continues to trade below both the 2,131 target and the prior record high at 2,135. Therefore, it could easily close below those price levels. However, if it can close above 2,131 it will be showing greater strength than closing lower. And a close above 2,135 of course is a more bullish indication than a close below 2,135.
Higher Target is 2,189
In the short-term, gold may be extended and due for a retracement or consolidation of a day or a few, if not longer. Once that phase is done, whichever form it takes, gold should be ready to proceed towards the first major higher target zone around 2,189 to 2,194. The current sharp advance in gold began following a breakout of a large symmetrical triangle pattern. An initial target can be calculated from the pattern, and it points to 2,189. The purple arrows mark the related measurements.
Measured Moves Confirm Target
Further, two previous measured moves are highlighted in blue on the chart. They show impulse rallies coming up off the October swing low. The first rally is 11% and the second 10.5%. If the lower 10.5% advance occurs in the current advance, gold would be hitting approximately 2,094. The measure starts from the most recent swing low at 1,984 (C).
Highest Daily Closing Price Historically
Yesterday’s closing price of 2,114 was the highest daily closing price ever for gold, and today will likely end with a new record closing price. Gold has been setting up for large move into new record highs ever since reaching a high of 1,921 in 2,011. A multi-year basing pattern followed in the shape of a cup with handle. If this week’s advance is sustained and the price of gold further strengthens, gold will be rising out of a new floor in price.
Read Full Story »»»
DiscoverGold
more like once in a lifetime ever rally. never has there been a worse generation of investors and a president/admin that has so messed up everything, and allowed everyone that greases his palm to do as they please. No president has ever tried to destroy this country, and lied so much about everything especially the economy while racking up debt faster and larger than anyone ever before. the next run in gold will be a Mars mission right after a Moon shot.
Is Gold Setting Up for a Huge, Once in a Generation, Rally?
By Chris Vermeulen
Is there a generational opportunity coming to get into gold?
) 12 years in the making. $GLD 🥇
— TrendSpider (@TrendSpider) March 3, 2024
Weekly newsletter out tomorrow, sign up for free.
📬 https://t.co/QzvevHvbNs pic.twitter.com/KmlPSJVegT
Nothing like pertinent charts being included to make the economic picture relative to PM's clear as a bell.
Evidence and Insights About Gold's Long-Term Uptrend
https://www.bullionstar.us/blogs/bullionstar/gold-uptrend/
NY Gold Futures »» Weekly Summary Analysis
By: Marty Armstrong | March 2, 2024
The NY Gold Futures has been in an uptrend for the past 2 days closing above the previous session's high quite significantly by 1.76%. The broader rally has unfolded over the past 12 days. Currently, the market is trading in a neutral position on our indicators but it is trading strongly higher up some 3.00% from the previous session low. Our projected target for closing resistance for the next session stands at 21289, we need to close above that target to imply a further advance. Failure to even exceed this intraday warns that the upward momentum is starting to decline. Our Stochastics are all still pointing upward while our internal momentum models have also remained in a bullish posture.
Up to now, we still have only a 2 month reaction decline from the high established during December 2023. We must exceed the 3 month mark in order to imply that a trend is developing.
ECONOMIC CONFIDENCE MODEL CORRELATION
Here in NY Gold Futures, we do find that this particular market has correlated with our Economic Confidence Model in the past. The Last turning point on the ECM cycle low to line up with this market was 2022 and 2015. The Last turning point on the ECM cycle high to line up with this market was 2020 and 2011 and 1996.
MARKET OVERVIEW
NEAR-TERM OUTLOOK
The historical perspective in the NY Gold Futures included a rally from 2015 moving into a major high for 2023, the market has pulled back for the current year. The last Yearly Reversal to be elected was a Bullish at the close of 2022 which signaled the rally would continue into 2023. However, the market has been unable to exceed that level intraday since then. This overall rally has been 1 years in the making.
This market remains in a positive position on the weekly to yearly levels of our indicating models. Pay attention to the Monthly level for any serious change in long-term trend ahead.
Solely focusing on only the indicating ranges on the Daily level in the NY Gold Futures, this market remains in a bullish position at this time with the underlying support beginning at 20532.
On the weekly level, the last important high was established the week of February 26th at 20971, which was up 2 weeks from the low made back during the week of February 12th. So far, this week is trading within last week's range of 20971 to 20334. Nevertheless, the market is still trading upward more toward resistance than support. A closing beneath last week's low would be a technical signal for a correction to retest support.
When we look deeply into the underlying tone of this immediate market, we see it is currently still in a weak posture. The broader perspective, this current rally into the week of February 26th reaching 20971 has exceeded the previous high of 20832 made back during the week of January 29th.
Right now, the market is above momentum on our weekly models hinting this is still bullish for now as well as trend. Looking at this from a wider perspective, this market has been trading up for the past 2 weeks overall.
INTERMEDIATE-TERM OUTLOOK
YEARLY MOMENTUM MODEL INDICATOR
Our Momentum Models are declining at this time with the previous high made 2020 while the last low formed on 2023. However, this market has rallied in price with the last cyclical high formed on 2023 and thus we have a divergence warning that this market is starting to run out of strength on the upside.
Looking at the longer-term monthly level, we did see that the market made a high in December 2023 at 21523. After a thirteen month rally from the previous low of 19879, it made last high in December. Since this last high, the market has corrected for thirteen months. However, this market has held important support last month. So far here in March, this market has held above last month's low of 19964 reaching 20470.
Critical support still underlies this market at 19070 and a break of that level on a monthly closing basis would warn that a sustainable decline ahead becomes possible. Nevertheless, the market is trading above last month's high showing some strength.
DiscoverGold
Gold CoT: Peek Into Future Through Futures, How Hedge Funds Are Positioned
By: Hedgopia | March 2, 2024
• Following futures positions of non-commercials are as of February 27, 2024.
Gold: Currently net long 141.6k, up 1.4k.
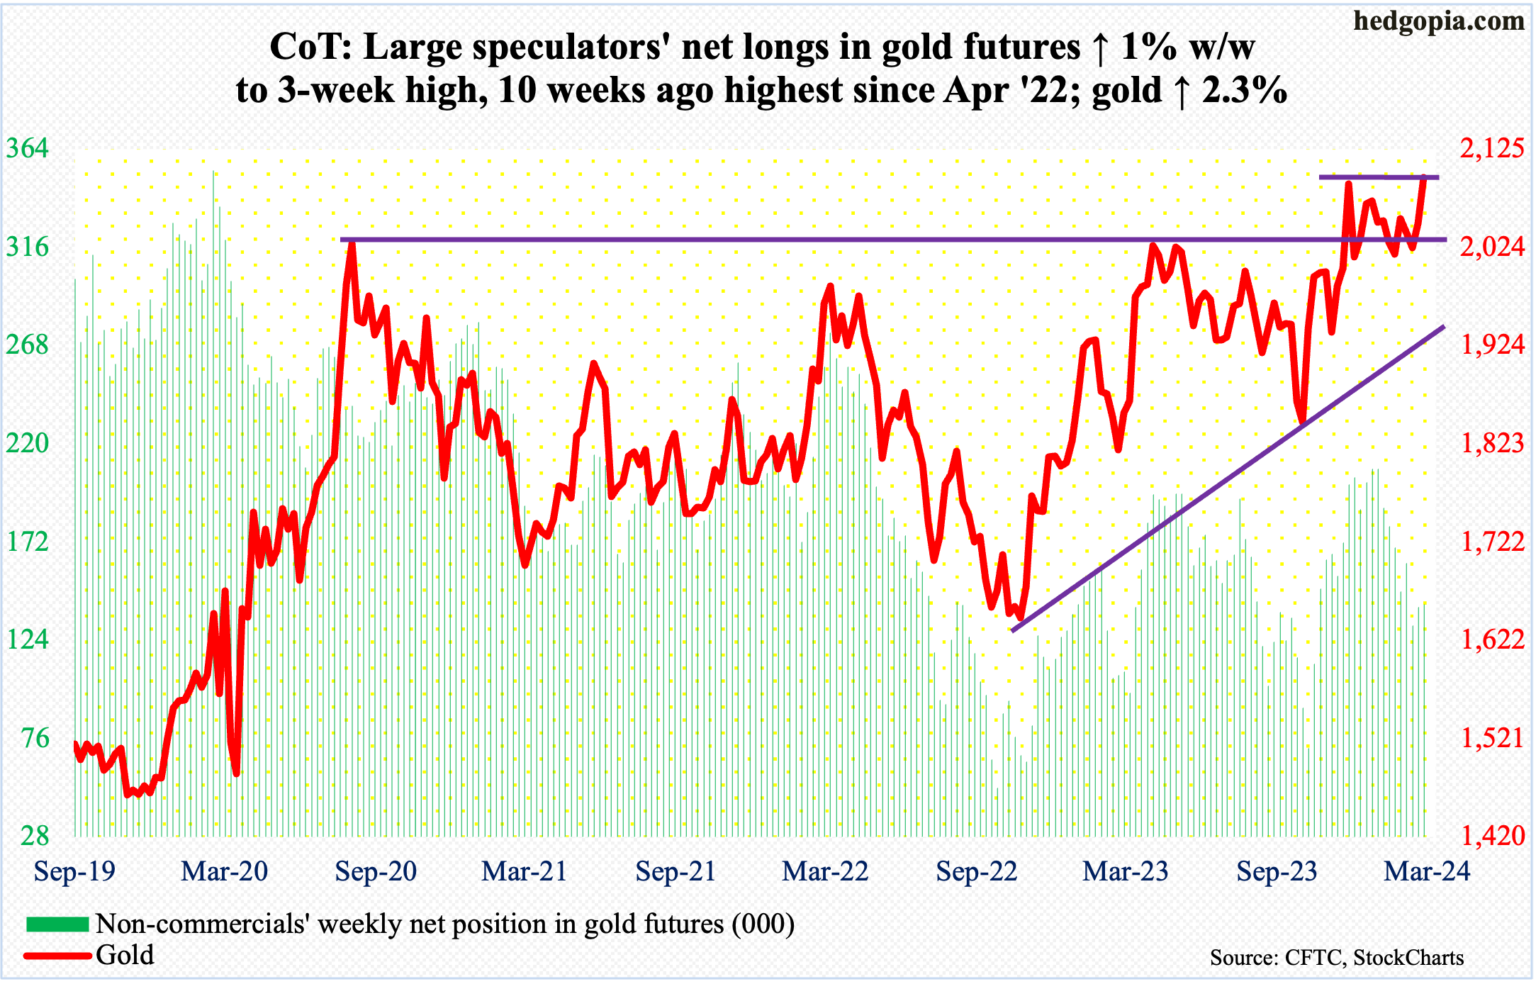
Gold bugs are back at it again. In fact, with a close of $2,096/ounce this week, it has managed to reclaim $2,080s, which has acted as a ceiling ever since August 2020 when it reached $2,089 and retreated. After that, rally attempts stopped at that price point in March 2022 ($2,079), May last year ($2,085) and several times this year, not to mention last December when the metal hit a new high of $2,152.
This is as good an opportunity as it gets to build on this week’s action. Needless to say, a breakout would be massive. Encouragingly for the bulls, the metal has been making higher lows since November 2022 when it bottomed at $1,618.
Read Full Story »»»
DiscoverGold
If gold does what i believe it WILL do. Miners will explode next year multiples of where they are now. Miners do best on the trailing half of a Major gold and silver bull run, which is happening this year. Silver first, Gold next, Miners last. Gold easily will be 7x to 10x from its lows in 2016. with reserves vanishing and no one noticing, the central banks are setting up for gold to cover all the debt they cannot pay off. it will be once in a lifetime for metals, but im afraid almost every other market but housing will drop up to 50%. some crypto will emulate gold for a bit, but its almost saturated now. the only reason it going up is someone, maybe even a Sovreign, is grabbing it since last year. the capitulation is close, but as things will turn out BTC and its close buddies will hold their own, there are way too many who will not sell, which will stabilize that market more than other. go figure, no real value but its eternally loved.
Stock Screener: Ep. 389: Leverage With Gold Miners Vs. Bankruptcy Risk
Albert S
Gold Price Forecast: Bullish Momentum Points to Potential Record Highs
By: Bruce Powers | March 1, 2024
• Gold's breakout from a consolidation pattern suggests bullish momentum, with targets near record highs around 2,135 and a potential surge towards 3,000.
Gold sees bullish follow through after yesterday’s breakout of a large symmetrical triangle consolidation pattern. So far, it is acting in a way that is very supportive of a bullish outlook. The precious metal took off and reached a high of 2,088 today before encountering resistance. That high completes the next target for gold, which was at 2,088 from the December 28 swing high (B). Gold is on track to close strong, in the top 25% of the day’s trading range.

Strong Bullish Momentum Indicated
This week’s bullish breakout may be the beginning of a run that sees gold reach new record highs. The last record high was set in December at 2,135. It is off to a good start with this week’s price action. Clearly, upward momentum has improved as represented by today’s wide range green candle and likely strong close. Gold broke out of a bullish hammer candlestick bottom two weeks ago on the weekly chart, providing a solid beginning to this rally.
Next Higher Target is $3,000
The next higher price target above today’s high is up around 2,100. At that point a rising ABCD pattern completes. Symmetry between the two swings in the pattern, the AB leg, and the CD leg, will match at that point. Nevertheless, that is the first target from the pattern. Given the likelihood of still higher prices there is a good chance that the target will be exceeded. The 127.2% ABCD pattern target will then be at 2,138, awfully close to the prior record high.
New High Target Zone: 2,189 to 2,192
Since yesterday’s breakout, however, an eventual target derived from the symmetrical triangle becomes more likely. That target is around 2,189 and marked on the chart. What is interesting is what happens when we look at the two sharp rallies that occurred before the three-month consolidation pattern. Each of the rallies saw an advance of over 10%.
The first was 11% and the second 10.5%. If the current rally matches a 10.5% advance, which would make sense given the previous rallies, gold would be hitting approximately 2,192. That is a very close match to the triangle target. When two methods identify a similar target, that target zone takes on greater potential significance.
Read Full Story »»»
DiscoverGold
Gold: Upside Breakout Reaches Four-Week Highs
By: Bruce Powers | February 29, 2024
• Gold's bullish momentum strengthened as it broke out from a symmetrical triangle pattern, signaling potential for a price surge.
Gold triggered a weekly bullish continuation signal today as it rallied above last week’s high of 2,041. Thursday’s high of 2,051 was a four-week high and an upside breakout further strengthened the bullish case for gold. A daily close above the four-week high of 2,045 is now possible. In addition, a weekly bullish signal gold is on track to end the day at its highest daily closing price in 19 days, and decisively close above the 50-Day MA. It is also on track to close above the downtrend line for the second day in a row as well as close above the uptrend line for the first time. These are all new bullish indications for gold that support the thesis for higher prices.

Weekly Bullish Signs
In addition to the weekly bullish signal, gold triggered a breakout from a large symmetrical triangle consolidation pattern today. It is an approximately three-month consolidation pattern. Today was the first bullish trigger. Further confirmation of strength is now needed. A secondary entry to the triangle breakout occurs on a rally above the 2,058-swing high from February 1. Once the second entry trigger occurs, the chance for a bullish continuation improves.
Symmetrical Triangle Target
We can derive a target from the triangle pattern by measuring the height of the pattern at its maximum distance and then adding that price change to the breakout level. When doing this a potential target of 2,189 is revealed. This target is approximate as the measures are not perfect, but they should be close. This week’s previous high of 2,041 is being used for the breakout level.
Next Potential Resistance Targets
Nevertheless, there are several price levels for earlier targets, prior to a breakout to new record highs. The first is the 2,058 swing high noted above, which followed by the next higher swing high from December at 2,088 (B). Short-term weakness should see support at or above the 50-Day MA, which is currently at 2,033. It happens to be marking a similar price level as the downtrend line. Also, today’s low of 2,028 is critical in the short-term. Given the potential significance of today’s bullish price action, short-term weakness will be watched carefully by traders to either enter or add to positions.
Read Full Story »»»
DiscoverGold
Gold Price Forecast: Bulls Await Breakout Above 2,041
By: Bruce Powers | February 28, 2024
• Recent price action indicates gold's potential to break out of a symmetrical triangle pattern, supported by a bullish reversal on the weekly chart.
Gold continues to trade in a consolidation range at a key potential pivot zone with a high of 2,041. For around six days it has been trading in a range pushing up against resistance marked by several indicators. A combination of the 8-Day, 20-Day and 50-Day moving averages are within the range along with a downtrend and uptrend line. Twice recently daily support was seen at the 20-Day line (purple). That’s a change from previous price action where trading occurred both above and below the line over four days last week.

Bull Triggered on Move Above 2,041
Nonetheless, a decisive breakout above last week’s high of 2,041 is needed to trigger greater enthusiasm from the bulls. If that happens before a drop below 2,016 occurs, gold should be ready to continue to trend higher to eventually test prior record highs. The 2,016 level is being used to mark the low of consolidation.
Looming Large Symmetrical Triangle Breakout
Over the past several months gold has formed a large symmetrical triangle consolidation pattern with a breakout triggered by a rally above 2,041. That should give it a chance to see a clear increase in upward momentum once a bullish breakout is triggered. The pattern has formed above nearby support represented by the 200-Day MA (blue), which is evidence for an eventual upside resolution. Since gold rallied back above the 200-Day line on October 18 it has successfully tested the 200-Day line three times as support and each time it was rejected to the upside. It should provide a strong base for gold to launch from.

Weekly Breakout Support Higher Prices
Recent weekly price action is also supportive of an upside resolution to the triangle. Two weeks ago, an upside breakout of a hammer candlestick pattern triggered a bullish reversal. It was confirmed by last week’s close above the prior week’s high, and a close in the top third of the week’s range. This means that the long-term time frame represented by the weekly chart has only recently triggered a bullish signal. Therefore, it should be the beginning of a new portion of the larger rising trend.
Read Full Story »»»
DiscoverGold
The current cycle of gold right now is extremely similar to where it was in Feb 1979.
ARIS MINING TO ANNOUNCE FULL-YEAR 2023 RESULTS ON MARCH 6, 2024
NEWS PROVIDED BY
Aris Mining Corporation
22 Feb, 2024, 07:50 ET
SHARE THIS ARTICLE
https://www.prnewswire.com/news-releases/aris-mining-to-announce-full-year-2023-results-on-march-6-2024-302068224.html
VANCOUVER, BC, Feb. 22, 2024 /PRNewswire/ -
Aris Mining Corporation (Aris Mining or the Company) (TSX: ARIS) (NYSE–A: ARMN) will announce its full-year 2023 operations and financial results after market close on March 6, 2024.
Management will host a conference call on Thursday, March 7, 2024, at 11:00 am ET/8:00 am PT to discuss the results. The call will be webcast and can be accessed at Aris Mining's website at
https://www.aris-mining.com, or at https://services.choruscall.ca/links/arismining2023q4.html
To join the conference via telephone dial:
Toll-free North America: 1-866-668-0730
International: +1 604-638-5357
Participants may also choose to pre-register to join the conference call automatically, at LINK. Upon registering, participants will receive a calendar invitation with dial-in details and a unique PIN, which will allow them to bypass the operator queue and connect directly to the conference.
The call will be available for playback for one week by dialing:
Toll-free in the US and Canada: +1 800.319.6413
International: +1 604.638.9010
Replay access code: 0729
A replay of the event will be archived at Aris Mining Corporation - Investors - Events & Presentations (aris-mining.com).
About Aris Mining
Aris Mining is a gold producer in the Americas, currently operating two mines with expansions underway in Colombia. The Segovia Operations and Marmato Upper Mine, known for their high-grade deposits, produced 226,000 ounces of gold in 2023. With ongoing expansion projects, Segovia and Marmato are targeting to produce 500,000 ounces of gold in 2026. Aris Mining also operates the Proyecto Soto Norte joint venture, where environmental licensing is advancing to develop a new underground gold, silver and copper mine. In Guyana, Aris Mining is advancing the Toroparu Project, a gold/copper project. Aris Mining intends to pursue acquisitions and other growth opportunities to unlock value through scale and diversification.
Aris Mining promotes the formalization of artisanal and small-scale mining as this process enables all miners to operate in a legal, safe and responsible manner that protects them and the environment.
Additional information on Aris Mining can be found at www.aris-mining.com, www.sedarplus.ca, and on www.sec.gov.
Forward-Looking Information
This news release contains "forward-looking information" or forward-looking statements" within the meaning of Canadian and U.S. securities legislation. All statements included herein, other than statements of historical fact, including, without limitation, statements relating to the timing of the release of the Company's annual financial results and the Company's target production in 2026, and its plans and strategies are forward-looking. When used herein, forward looking terminology such as "expect", "plan", "anticipate", "estimate", "may", "will", "should", "intend", "believe", and similar expressions, are intended to identify forward-looking statements. Forward-looking statements are based on estimates and assumptions made by the Company in light of its experience and its perception of historical trends, current conditions and expected future developments, as well as other factors that the Company believes are appropriate in the circumstances. Many factors could cause the Company's actual results, performance or achievements to differ materially from those expressed or implied by the forward-looking statements, including those described in the "Risk Factors" section of the Company's most recent AIF and in the Management's Discussion and Analysis for the three and nine months ended September 30, 2023, which are available on the Company's profile on SEDAR+ at www.sedarplus.ca and in its filings with the U.S. Securities and Exchange Commission at www.sec.gov. These factors should be considered carefully, and readers should not place undue reliance on the Company's forward-looking statements. The Company has no intention and undertakes no obligation to update or revise any forward-looking statements, whether as a result of new information, future events or otherwise.
SOURCE Aris Mining Corporation
Also from this source
ARIS MINING ANNOUNCES APPOINTMENT OF TWO INDEPENDENT DIRECTORS
VANCOUVER, BC, Feb. 14, 2024 /PRNewswire/ - Aris Mining Corporation (Aris Mining or the Company) (TSX: ARIS) (NYSE-A: ARMN) announces the appointment ...
ARIS MINING ACHIEVES 2023 PRODUCTION GUIDANCE AND PROVIDES 2024 OUTLOOK
VANCOUVER, BC, Jan. 16, 2024 /PRNewswire/ - Aris Mining Corporation (Aris Mining or the Company) (TSX: ARIS) (NYSE-A: ARMN) reports 2023 gold...
More Releases From This Source
Gold Price Forecast: Eyes Further Upside Potential
By: Bruce Powers | February 23, 2024
• Gold is set to end the week on a strong note, reaching a new short-term high after a rebound from a test of support.
Gold is set to end the week in a strong position and at a new short-term trend high. This follows a drop earlier in the session and test of support at the 8-Day MA. Price was subsequently rejected to the upside as buyers took back control and drove the price of gold up through the consolidation range from the past couple of days to a new 11-day high. Resistance stopped the ascent at 2,041, at the time of this writing.
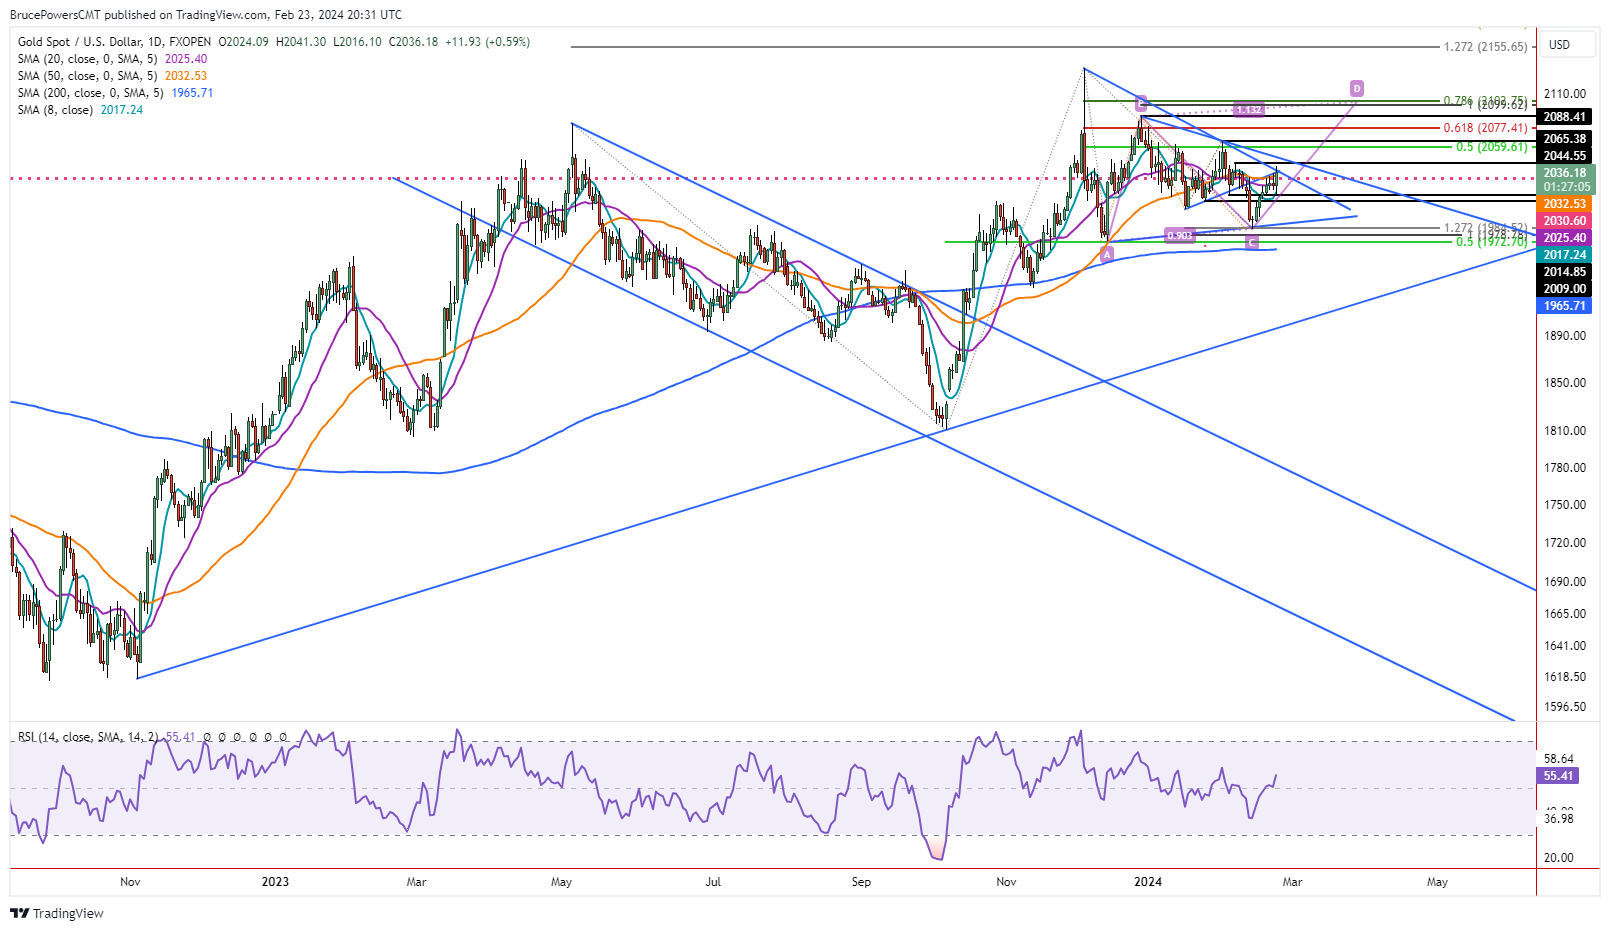
Early Session Weakness Reverses to 2-Week High
A reversal of an initial selloff to a three-day low in one day is generally bullish and it can be expected to lead to a continuation of the advance. Today’s rally, and likely weekly close above 2,031, will confirm this week’s breakout of last week’s bullish hammer candlestick pattern. Moreover, gold is on track to close strong for the week, in the upper quarter of the week’s trading range. This will leave it with a wide range green candlestick pattern for the week, which signals improving demand.
Weekly Bullish Breakout Confirms
The bullish breakout just began so further upside is more clearly on the horizon now, than it was only yesterday. Friday’s high and therefore the weekly high, at the time of this writing, was 2,041. That is right at the downtrend line. That line marks dynamic resistance of the downtrend that begins from the December 4 record high of 2,135. A second internal trend line has been added to the chart to provide additional context. A breakout of a trendline is not necessarily giving a signal as much as providing additional evidence that shows demand improving.
Large Symmetrical Triangle Pattern Breakout Should be Next
In addition to a successful breakout above the 50-Day MA today, gold is also back above a key price level from the August 2020 swing high at 2,031 (dotted red horizontal). That line has been roughly near the center of a consolidation range for the past several months. It takes the form of a symmetrical triangle, and if you add the preceding rally to the pattern, starting from the October low, you get a large bullish pennant. Therefore, a decisive breakout above this week’s high will be the first indication of a breakout of the triangle. A more reliable indication of strength will be provided on a rally above the 2,065-swing high. Nevertheless, the next level that needs to be broken is the minor swing high at 2,045.
Read Full Story »»»
DiscoverGold
Gold: Key Resistance at 50-Day MA
By: Bruce Powers | February 22, 2024
• Gold's rally to a two-week high faces resistance at the 50-Day MA, suggesting a possible pullback before further attempts are made to trend higher.
A two-week high in gold triggered on Thursday for the second day in a row, before resistance kicked in. Gold hit a high of 2,035 today, exceeding the 50-Day MA just slightly, before sellers took control and drove prices back down to below yesterday’s low, thereby generating an outside day. Once again, the 50-Day line is recognized by the market. This is telling us to keep an eye on it going forward.
50-Day Moving Average Shows Strong Resistance
The 50-Day MA has been successfully tested as resistance for each of the past three days when there was a higher daily high. In addition, last week’s high also recognized the 50-Day line as a resistance area. Each attempt to go higher has failed at the 50-Day line. The tests reflect improving demand but not enough yet to put price well over the line. Given today’s failure and relatively weak close, plus the uncertainty reflected in the outside day candle, increases the chance for a pullback before another attempt to trend higher occurs.

2,015 Marks the Next Support Area
Near-term support is possibly at the three-day low of 2,015, which was a minor swing low from early-February and was recognized as resistance most recently on February 16. Slightly below there is the 8-Day MA at 2,012. It is quickly followed by the 50% retracement at 2,008, along with a minor swing low from January 25 at 2,009.
Daily Close Above 50-Day Moving Average Will Confirm Strength
An advance above today’s high of 2,035, also the weekly high, will provide a bullish signal. However, a daily close above that price level will be needed to confirm a breakout above the 50-Day MA. Once that happens gold will have a better chance of continuing to strengthen and test potential resistance levels. Note that yesterday an upside breakout of a hammer candlestick pattern triggered on the weekly chart.
Each of the past two swing highs will then become a target at 2,065 and 2,088 once a breakout is confirmed. However, as noted on the chart, a primary initial upside target has been identified at 3,000. That is where an ascending ABCD pattern completes. It will mark the point where the CD leg of the pattern matches the price appreciation seen in the AB leg and therefore shows symmetry between the two swings. Once there is symmetry, the chance for a pullback increases.
Read Full Story »»»
DiscoverGold
Gold: Analyzing Resistance, Support, and Price Targets
By: Bruce Powers | February 21, 2024
• Gold's rally above last week’s high faces resistance, but a breakout could signal higher prices and a shift to a larger uptrend.
Gold managed a brief rally above Tuesday’s 2,031 high to trigger a bullish trend continuation before encountering resistance at 2,032. It was the third time in two weeks that the 50-Day MA (orange) was successfully tested as resistance. First, that tells us that the 50-Day line represents resistance that could lead to another drop to test recent lows. Also, it shows the market making another attempt to breakout above the line. The second test was yesterday. Not only was there a new daily high today but there is also a higher daily low, showing that the five-day trend remains well in place.
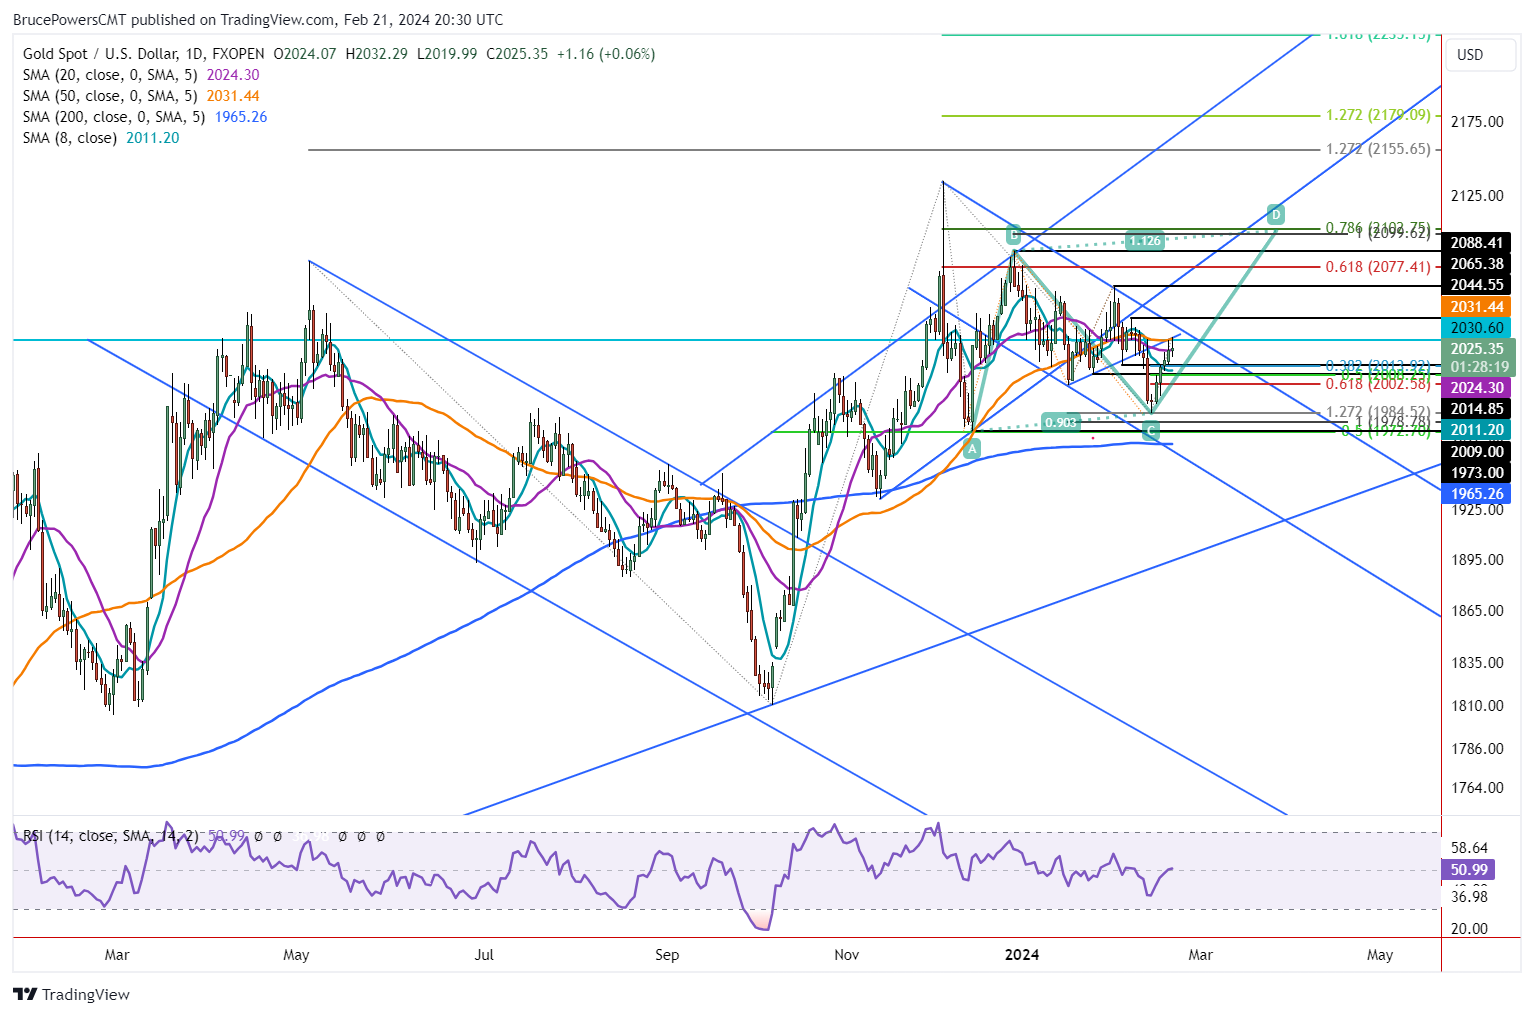
Weekly Bullish Breakout Triggers Above 2.03
Wednesday’s advance also triggered a weekly bullish breakout of last week’s hammer candlestick pattern, which was triggered on a move above 2,031. A daily close above 2,031 will confirm the weekly breakout and put higher prices on the agenda. The first interim target would then be around 2,045. If reached, gold will have risen above the downtrend line, marking a key development reflecting improving demand. Nonetheless, a daily close above the 55-Day MA, now at 2,031, will provide the next sign of strengthening.
Gold is Trying to Break Above 50-Day Moving Average at 2,031
Since today is the fifth consecutive day up for gold, and it continues to test resistance at the 50-Day line, it may lead to a turn down before breaking higher, if it is to do so. In that case, weakness is first indicated on a drop below today’s low of 2,020. There are then two potential support levels to keep an eye on, driven by prior seeing lows. They come in at 2,015 and 2009.
The 38.2% Fibonacci retracement is at 2,014, close enough to confirm the 2,015-price area. Also, the 50% retracement at 2,008 confirms the 2,009-price area as being potentially significant support. A drop below the daily low of 1,995 may lead to a further test of the recent swing low at 1,984, and possibly lower prices. Key lower support is represented by the 200-Day MA, which is currently at 1,965.
Upon Further Signs of Strength, Gold Targets 3,000
Gold has been channeling lower since the late-December swing high at point B. A daily close above the downtrend line marking dynamic resistance of the decline will give the first confirmation that the downtrend has switched to a developing uptrend. At that point, the completion of a rising ABCD pattern at 3,000 (even number) becomes a prime initial target.
Read Full Story »»»
DiscoverGold
Gold Price Forecast: Resistance at 2,031, Potential Pullback Ahead
By: Bruce Powers | February 20, 2024
• Gold's rally to 2,031 meets resistance, signaling a possible pullback as it faces key technical levels and recent highs.
Gold continues to advance off the February 14 swing low with a new countertrend rally high of 2,031. That high reached the next previously noted target zone of 2,031. It completes a successful test of resistance at the combined 38.2% Fibonacci retracement and the 50-Day MA (orange) price zone. Also, it is notable that today’s high tested resistance of the prior internal trendline as well. Once the high was hit the sellers took over again, dropping the price of gold back towards the 50% area of the day’s high to low trading range. In other words, once the 2,031 target was hit, resistance kicked in.
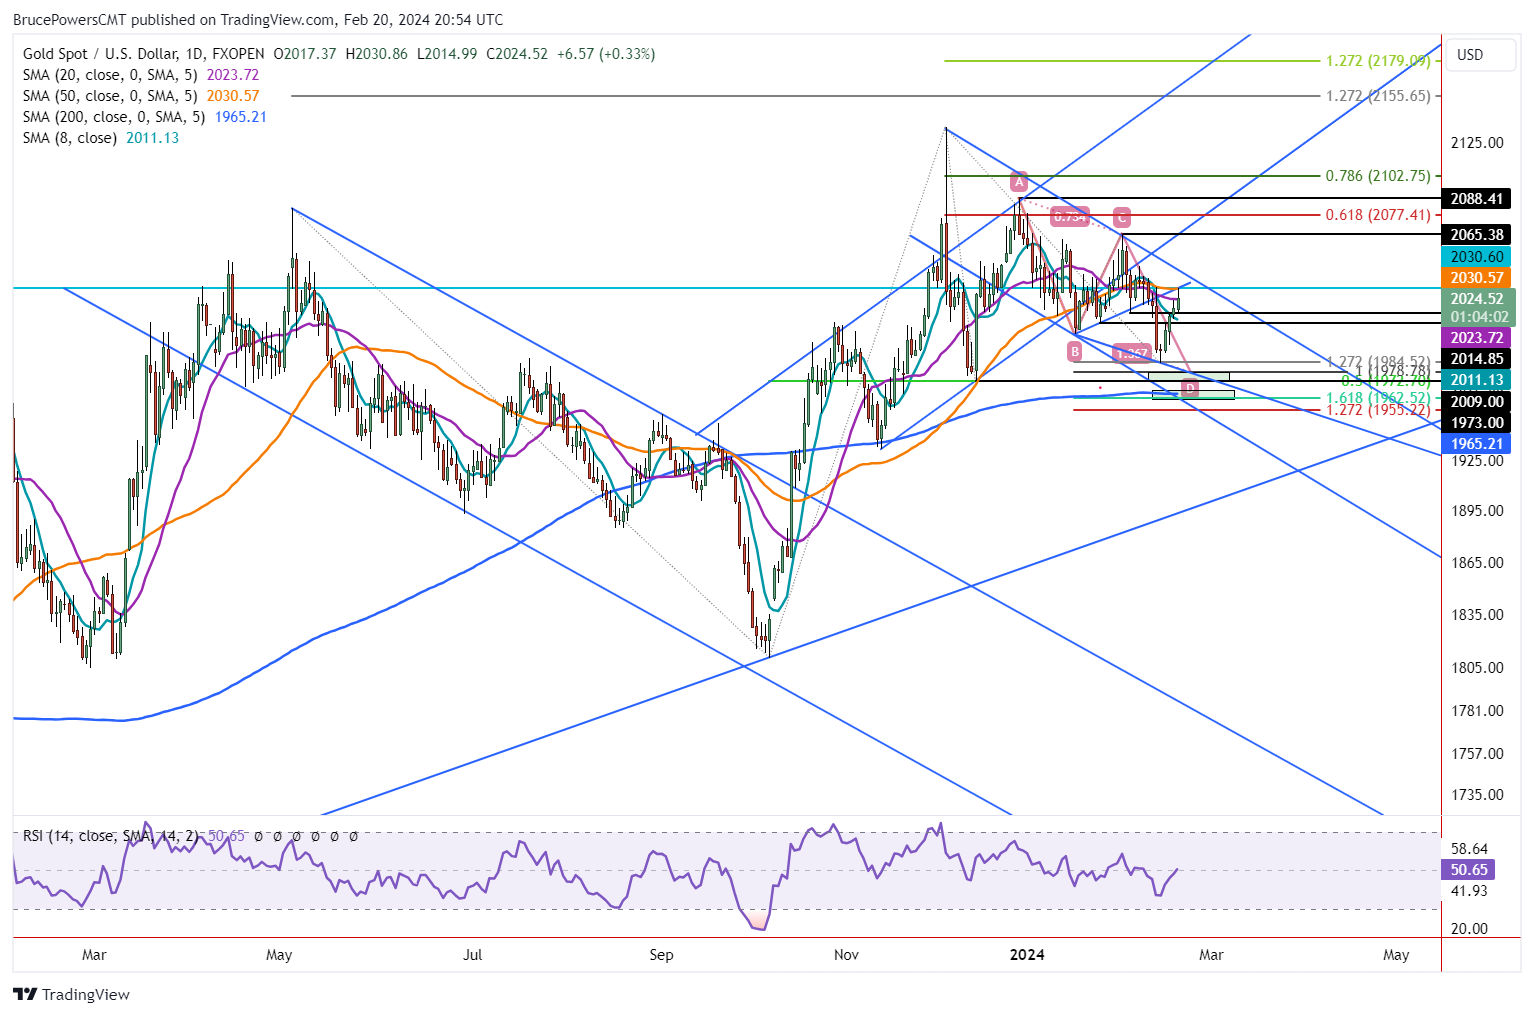
50-Day Moving Average Marks Key Resistance
Today’s test of resistance at the 50-Day MA is the second time in two weeks that the line has triggered resistance and a selloff. Last week’s high also encountered resistance at the 50-Day line. Given today’s bearish reaction following the 2,031 high, it wouldn’t be surprising to see at least a minor pullback or consolidation as gold further digests recent gains.
Weekly Bull Hammer Setup
Gold completed a weekly bullish hammer candlestick pattern last week. On the upside, a breakout will trigger on a rally above last week’s high of 2,031. Of course, that would put gold in a stronger position as it will be at a two-week high and above both the 20-Day and 50-Day MAs. Subsequently, once a daily close occurs above 2,031 gold will be cleared to contend with higher price targets. The first being around the prior swing high at 2,065 (C). That price target is followed by the 2,088-price zone derived from December 28 swing high (A).
Daily Close Above 2,065 Opens Door to New Highs
A daily close above the 2,065-swing high will further confirm a bullish reversal of the recent lows and strength in the developing uptrend. It is part of the price structure of the downtrend and once exceeded to the upside the downtrend structure is busted. At that point the chance that gold will test and possibly exceed the record high of 2,135 from December improves significantly. Until then, gold could continue to struggle.
On the downside, a drop below the three-day low of 1,995 will put the recent 1,985 swing low at risk of being tested again and possibly exceeded to the downside. If that happens, the next lower area to watch for support is from around 1,979 to 1,973.
Read Full Story »»»
DiscoverGold
long term, commercials are ALWAYS right, why, cause they have done the rigging through Sovern's and Central Banks when needed.
Gold CoT: Peek Into Future Through Futures, How Hedge Funds Are Positioned
By: Hedgopia | February 17, 2024
• Following futures positions of non-commercials are as of February 13, 2024.
Gold: Currently net long 131.2k, down 30.6k.

Non-commercials cut net longs in gold futures to a 17-week low. They started cutting after raising their holdings to 207,718 contracts in the week to December 27th. Earlier on December 4th, gold posted a new intraday high of $2,152 but reversed to close the session at $2,042. This was yet another failure to bust out of $2,080s.
In August 2020, the metal posted a new all-time high of $2,089 and retreated. The reversal occurred again in March 2022 when it printed $2,079 and in May last year when $2,085 was tagged, followed by rejection in late December and early January.
Repeated failed attempts at $2,080s have led non-commercials to lose patience. This week, they cut their holdings to 131,168 contracts.
Amidst this, the daily is trying to stabilize between the 200-day ($1,980) and the 50-day ($2,038). Gold closed this week at $2,024/ounce. A rally looks imminent.
Read Full Story »»»
DiscoverGold
NY Gold Futures »» Weekly Summary Analysis
By: Marty Armstrong | February 17, 2024
The NY Gold Futures has been in an uptrend for the past 2 days closing above the previous session's high. Currently, the market is trading above one of our three internal momentum indicators warning there is at least some underlying support forming. Nevertheless, on our indicating ranges, the market still remains a partial bearish position yet there is showing underlying support but it is trading strongly higher up some 1.26% from the previous session low. Our projected target for closing resistance for the next session stands at 20426, we need to close above that target to imply a further advance. Failure to even exceed this intraday warns that the upward momentum is starting to decline. Nevertheless, this session closed below our ideal projection for closing resistance warning that the market which stood at 20440 is forming a high. A break of this session's low of 20066 will warn that we have a potential temporary high in place.
Up to now, we still have only a 1 month reaction decline from the high established during December 2023. We must exceed the 3 month mark in order to imply that a trend is developing.
ECONOMIC CONFIDENCE MODEL CORRELATION
Here in NY Gold Futures, we do find that this particular market has correlated with our Economic Confidence Model in the past. The Last turning point on the ECM cycle low to line up with this market was 2022 and 2015. The Last turning point on the ECM cycle high to line up with this market was 2020 and 2011 and 1996.
MARKET OVERVIEW
NEAR-TERM OUTLOOK
The historical perspective in the NY Gold Futures included a rally from 2015 moving into a major high for 2023, the market has pulled back for the current year. The last Yearly Reversal to be elected was a Bullish at the close of 2022 which signaled the rally would continue into 2023. However, the market has been unable to exceed that level intraday since then. This overall rally has been 1 years in the making.
This market remains in a positive position on the weekly to yearly levels of our indicating models. Pay attention to the Monthly level for any serious change in long-term trend ahead.
Focusing on our perspective using the indicating ranges on the Daily level in the NY Gold Futures, this market remains moderately bearish position at this time with the overhead resistance beginning at 20343 and support forming below at 20173. The market is trading closer to the support level at this time.
On the weekly level, the last important high was established the week of December 4th at 21523, which was up 9 weeks from the low made back during the week of October 2nd. Afterwards, the market bounced for 17 weeks reaching a high during the week of January 29th at 20377. Since that high, we have been generally trading down for the past 2 weeks, which has been a sharp move of 4.166% in a reactionary type decline. Nonetheless, the market still has not penetrated that previous low of 18235 as it has fallen back reaching only 4523 which still remains -75.1% above the former low.
When we look deeply into the underlying tone of this immediate market, we see it is currently still in a weak posture.
Looking at this from a broader perspective, this last rally into the week of January 29th reaching 20832 failed to exceed the previous high of 20982 made back during the week of December 25th in 2023. That rally amounted to only five weeks. Right now, the market is neutral on our weekly Momentum Models warning we have overhead resistance forming and support in the general vacinity of 20040. Additional support is to be found at 20173. Looking at this from a wider perspective, this market has been trading up for the past 2 weeks overall.
INTERMEDIATE-TERM OUTLOOK
YEARLY MOMENTUM MODEL INDICATOR
Our Momentum Models are declining at this time with the previous high made 2020 while the last low formed on 2023. However, this market has rallied in price with the last cyclical high formed on 2023 and thus we have a divergence warning that this market is starting to run out of strength on the upside.
Critical support still underlies this market at 19070 and a break of that level on a monthly closing basis would warn that a sustainable decline ahead becomes possible. Nevertheless, the market is trading below last month's low warning of weakness at this time.
DiscoverGold
Gold Price Forecast: Bullish Reversal Sparks Rally
By: Bruce Powers | February 15, 2024
• Thursday’s rally marks the start of a bullish reversal, with higher target areas expected if gold can stay above 1,990.
A bullish reversal off Wednesday’s bottom hammer candlestick pattern triggered on Thursday, leading to a sharp advance to test resistance around the 2,009 interim swing low. Gold hit a high of 2,008 today before finding intraday resistance and pulling back. Since this is just the first day of the reversal a continuation to higher prices seems likely. Whether that happens tomorrow or following an interim rest day, an inside day possibly, remains to be seen. Nonetheless, a drop below today’s low of 1,990 makes a bullish resolution to today’s breakout much less likely.

Volatility Increases
Since Tuesday’s sharp selloff triggered a spike in volatility, it looks like today’s bullish price action may be in reaction to that downward spike. The volatility spike is reflected in the relatively large ranged red candlestick that occurred on that day. Following Wednesday’s dip to a new trend low of 1,984, Thursday’s bullish breakout shows buyers again taking control. A daily close within the top third, and especially the top quarter, of the day’s price range will indicate strength that could easily spill into the coming days.
Only First Day of Reversal
Today’s rally is only the first day of a daily bullish reversal. Therefore, higher target areas have a good chance of getting hit eventually as long as gold stays above 1,990. Tuesday’s high of 2,031 is seen as a key upside pivot and it also near resistance represented by the 50-Day MA. A minor swing high occurred at 2,015 and there could resistance seen there. It is confirmed by the 38.2% Fibonacci retracement, which completes at the same price. Further up is the combination of the 50% retracement and 20-Day MA around 2,024.
Playing with 2020 Record High in Gold
Interestingly, the light blue horizontal line on the chart at 2,031 comes from the August 2020 trend high. That was a significant pivot level as it was followed by a 21% correction and retained the record high price for gold for 18 months. Therefore, a breakout above and subsequent daily close above the 50-Day line, now at 2,031, provides a bullish signal that should lead to a breakout above the upper downtrend line and therefore a completion of the current correction.
Read Full Story »»»
DiscoverGold
AGNICO EAGLE REPORTS FOURTH QUARTER AND FULL YEAR 2023 RESULTS - RECORD QUARTERLY AND ANNUAL GOLD PRODUCTION AND
FREE CASH FLOW; RECORD MINERAL RESERVES INCREASED 10.5%; UPDATED THREE-YEAR GUIDANCE
February 15, 2024
(All amounts expressed in U.S. dollars unless otherwise noted)
Stock Symbol: AEM (NYSE and TSX)
https://ih.advfn.com/stock-market/TSX/AEM/stock-news/93293879/agnico-eagle-reports-fourth-quarter-and-full-year
https://investorshub.advfn.com/boards/read_msg.aspx?message_id=173780918
Gold & the Coming False Move
By: Marty Armstrong | February 15, 2024
January was to be the end of the rally, and December was a Double Directional Change, which produced the intraday high. Volatility will rise into March, and we should see a retest of support in the typical false move that usually results in people turning bearish. We have closed back below the Major Breakout Channel from the key low, which stands at the 2092 level. The Uptrend Line resides at the 1916 level. The main support lies at the 1860-1826 level. So, pay close attention to the Bearish Reversals at this time. We could consolidate short-term.
DiscoverGold
Gold Price Forecast: Potential for Rebound or Continued Fall?
By: Bruce Powers | February 14, 2024
• Falling ABCD pattern suggests gold could drop to 1,979; 200-Day MA at 1,965 could provide strong support.
Gold falls to a new retracement low of 1,984 on Wednesday and it is on track to complete the day with a bullish hammer candlestick pattern. Today’s low completed a 127.2% Fibonacci extension of the retracement of the advance off point B. Therefore, today may lead to a bounce to test prior support levels as resistance. A decisive rally above today’s high of 1,996 signals buyers getting more aggressive, and it should lead to a bounce.

Following Strength, 2,002 Becomes First Target
The previous swing low of 2,002 at B would be the first target, followed by a minor swing low at 2,009. Moreover, a test of the top channel line or moving averages could also occur. Tuesday’s high of 2,031 is the price level to watch on the upside as the 50-Day MA currently matches it.
Declining ABCD Pattern Targets 2,002
Nevertheless, a falling ABCD pattern targets a lower price area of 1,979. The chance that it is eventually hit increased on yesterday’s bearish trend continuation signal as price fell below the prior trend low at 2,002. And it then accelerated its decline, indicating that the market recognizes the significance of the 2,002-support area. Also, the drop put natural gas well below the 50-Day MA for the first time since last September/October. Once the 50-Day line is broken it opens the door to the 200-Day MA.
200-Day Moving Average Remains at Risk of Being Tested
The 200-Day MA is down at 1,965. It has only been tested successfully once as support since gold moved back above it last October. It has a good chance of being support again, if gold falls that far. At least it can be considered as a possible minimum lower price target for now. Also, of note is the 1,973-swing low and monthly low at 1,973. That price area is also identified by the 50% retracement of the uptrend starting from the October 6 swing low.
Monthly Bear Trigger May Persist
On the monthly time frame (not shown), gold triggered a bearish breakdown of an inside month (January) this month. A drop below January’s low of 1,973 triggers a monthly bearish continuation of that decline. By itself, it would indicate that the chance of reaching the December low of 1,932 had increased.
Read Full Story »»»
DiscoverGold
NY Gold Futures »» Weekly Summary Analysis
By: Marty Armstrong | February 10, 2024
The NY Gold Futures closing today at 20387 is immediately trading down about 1.59% for the year from last year's settlement of 20718. Factually, this market is currently trading below last month's close and it had been weak for the past 2 months and if the market continues to remain beneath the previous month's close of 20674, then it will be in a weak position just yet. This price action here in February is reflecting that this is within the scope of a bearish reactionary move on the monthly level thus far.
Up to now, we still have only a 1 month reaction decline from the high established during December 2023. We must exceed the 3 month mark in order to imply that a trend is developing.
ECONOMIC CONFIDENCE MODEL CORRELATION
Here in NY Gold Futures, we do find that this particular market has correlated with our Economic Confidence Model in the past. The Last turning point on the ECM cycle low to line up with this market was 2022 and 2015. The Last turning point on the ECM cycle high to line up with this market was 2020 and 2011 and 1996.
MARKET OVERVIEW
NEAR-TERM OUTLOOK
The historical perspective in the NY Gold Futures included a rally from 2015 moving into a major high for 2023, the market has pulled back for the current year. The last Yearly Reversal to be elected was a Bullish at the close of 2022 which signaled the rally would continue into 2023. However, the market has been unable to exceed that level intraday since then. This overall rally has been 1 years in the making.
This market remains in a positive position on the weekly to yearly levels of our indicating models. Pay attention to the Monthly level for any serious change in long-term trend ahead.
From a perspective using the indicating ranges on the Daily level in the NY Gold Futures, this market remains moderately bearish position at this time with the overhead resistance beginning at 20388 and support forming below at 20208. The market is trading closer to the resistance level at this time. An opening above this level in the next session will imply that a bounce is unfolding.
On the weekly level, the last important high was established the week of December 4th at 21523, which was up 9 weeks from the low made back during the week of October 2nd. Afterwards, the market bounced for 17 weeks reaching a high during the week of January 29th at 20377. Since that high, we have been generally trading down for the past week, which has been a reasonable move of 2.515% in a reactionary type decline. Nonetheless, the market still has not penetrated that previous low of 18235 as it has fallen back reaching only 4523 which still remains -75.1% above the former low.
When we look deeply into the underlying tone of this immediate market, we see it is currently still in a weak posture.
Looking at this from a broader perspective, this last rally into the week of January 29th reaching 20832 failed to exceed the previous high of 20982 made back during the week of December 25th in 2023. That rally amounted to only five weeks. Right now, the market is neutral on our weekly Momentum Models warning we have overhead resistance forming and support in the general vacinity of 20046. Additional support is to be found at 20308.
INTERMEDIATE-TERM OUTLOOK
YEARLY MOMENTUM MODEL INDICATOR
Our Momentum Models are declining at this time with the previous high made 2020 while the last low formed on 2023. However, this market has rallied in price with the last cyclical high formed on 2023 and thus we have a divergence warning that this market is starting to run out of strength on the upside.
Critical support still underlies this market at 19070 and a break of that level on a monthly closing basis would warn that a sustainable decline ahead becomes possible. Immediately, the market is trading within last month's trading range in a neutral position.
DiscoverGold
Gold CoT: Peek Into Future Through Futures, How Hedge Funds Are Positioned
By: Hedgopia | February 10, 2024
• Following futures positions of non-commercials are as of February 6, 2024.
Gold: Currently net long 161.7k, up 13.9k.

On Thursday last week, gold rallied as high as $2,083 but only to close out the week at $2,054/ounce. The metal has failed at this level several times in the past.
In August 2020, the metal posted a new all-time high of $2,089 and retreated. The reversal occurred again in March 2022 when it printed $2,079 and in May last year when $2,085 was tagged, followed by rejection in late December and early January this year. Then on December 4th last year, gold rose as high as $2,152 but reversed to close the session at $2,042.
After last week’s rejection, gold retreated this week, down 0.7 percent to $2,039. It can continue lower near term, with horizontal support just north of $2,000.
Read Full Story »»»
DiscoverGold
Gold Market Update - OUTLOOK AS DOLLAR RALLIES WITH US FACING DOWN THE BRICS...
By: Clive Maund | February 6, 2024
I haven’t written much about gold in the recent past – since the failed breakout attempt early in December - simply because I haven’t known what to make of it, and that indecisiveness has been reflected in the market itself where we have seen gold stuck in a fairly narrow trading range, but now things are starting to become a lot clearer both fundamentally and technically, and as we will proceed to see, it’s not a pretty picture.
On gold’s latest 6-month chart we can see the trading range that has built out since early December and it is now becoming clear that the pattern that has formed is a Head-and-Shoulders top that also has the characteristics of a Double or Triple Top or a Symmetrical Triangle and right now it is on the point of backing off from the Right Shoulder peak of the pattern. We can be a lot more sure that this is what it is from the volume pattern that from early December has been very bearish, with heavy downside volume, which is why the Accumulation line has been in severe decline. This pattern portends a breach of the support and a drop and at the time of writing, Monday morning (charts made yesterday), gold is down quite hard.

If gold is set to drop then what about PM stocks? The answer is that they will drop more. Now, I know about the valid argument that the gold stocks to gold ratio is already at a low level that is traditionally bullish and leads to a reversal to the upside and new bullmarket, but that won’t prevent a possible flushout first. On the latest 6-month chart for GDX is shown what I believe will happen to PM stocks if gold breaks down soon as it looks set to. Such a drop would really lead to many diehard PM stock holders throwing in the towel in disgust, and the correct way for existing holders of PM stocks to handle this right now (with the exception of a few special situations) is either to hedge or to step aside and buy back once the dust has settled after another drop.

Alright, if the PM sector is set to drop hard soon, then what will be the cause of it? – the answer is a rally in the dollar. So now let’s take a look at the latest dollar index chart and we will sharpen this by then taking a look at a dollar proxy where we have the benefit of being able to see the volume pattern.
On the 6-month dollar index chart we can see that, while our suspected Head-and-Shoulders top has been building out in gold, the inverse pattern, a Head-and-Shoulders bottom, has been building out on the dollar, which is hardly surprising. The dollar rallied well in January, up from the low of the Head of the H&S bottom, and after a big up day last Friday is now on the point of breaking out of this potential base pattern. Breakout will be signaled by it breaking clear above the resistance marking the upper boundary of the pattern. Momentum has been improving rapidly and moving averages are steadily swinging into much better alignment.

It is helpful to also look at a dollar index proxy, in this case the Invesco DB Dollar Index Bullish Fund, where we can find additional clues regarding what is going on, especially in the volume pattern. This is very illuminating for on this chart we see that UUP already had a volume breakout last Wednesday and a price breakout from its parallel H&S bottom pattern on Friday, again on strong volume, So “the writing is on the wall” with respect to the immediate outlook for both the dollar and the Precious Metals. This chart looks strong with a bullish volume pattern and the Accumulation line uptrending since late November, momentum rapidly improving and now positive and moving averages swinging into decidedly bullish alignment.

This brings us to the next big question – you can see how we are “reverse engineering” this – which is “Why would the dollar rally now?” The answer to this is that threats to the global hegemony of the petrodollar are being addressed and beaten back. It is no coincidence that the military action being undertaken in the Mid-East, specifically with respect to Iran, is taking place just weeks after Iran (and Saudi Arabia) joined the BRICS, which organization represents a clear and growing threat to the global dollar system. This is a threat that will simply not be tolerated and so the enforcement arm of the US Federal Reserve, i.e. the US Military, is over there to “teach the BRICS a lesson” and anyone else who dares to challenge dollar hegemony.
So what we are seeing is a gigantic global power play. The US Federal Reserve and the Neocons see themselves as the rulers of the planet and they have been making some very big moves on the chessboard in the recent past and over the past several years. They didn’t like the fact that Europe and Russia and other points east were getting friendly with each other and growing in economic strength through cooperation so they “put a spanner in the works” by blowing up the Nordstream pipeline. Although this was obviously the handiwork of the US – Biden said they would stop it - you didn’t hear a peep about it from European politicians who are all bought off and corrupted with Europe being a mere collection of vassal states. European leaders couldn’t care less that their citizens would suffer from energy shortages and high prices as a result. They also goaded Russia into invading eastern Ukraine and then tried with their controlled media to turn it into an international pariah with the resulting war in the Ukraine providing an opportunity to launder vast amounts of money and also to clear out the population of Ukraine in readiness for it to become a “backup Israel”. The disruption to shipping in the Red Sea also helps the US in relative terms since it is far more damaging to the European and Asian economies than it is to the US.
The interesting thing is that the US power play in the Mid-East is actually a bluff, because countries like Russia and even Iran have unstoppable hypersonic missiles that could quickly send US battle carrier groups to the bottom and likewise quickly take out the 50 or so US military bases in the region, so why don’t they use them and stop the hegemon in its tracks? There are two possible explanations. One is that they understand that the leaders of the New World Order are satanic lunatics who would not think twice about using nukes and would actually enjoy it, and we know that this is so because of them trying to shut down farming and force the population to eat insects and the other explanation is that these leaders, of Russia and various Mid-East countries, are in on the plan and are role playing, like the European leaders. Actually, watching the interplay between the Federal Reserve and US Neocons versus European leaders is like watching a chess grand master sat across the chess board from a chimpanzee. European leaders cannot be that stupid, so we must assume they are all bought off and corrupted – they certainly do not serve the interests of the peoples of Europe which is being intentionally mongrelized by means of invading hordes from Africa and the Mid-East.
The point is that through its aggressive brinksmanship that it has so far gotten away with, US elites have been and are tilting the balance of power back in favor of the US at the expense of the rest of the world which, if they succeed, will mean that they can carry on the enviable business of printing paper to swap for goods and services from foreign dupes. This is why the dollar index is rallying and this is why gold and silver may be set for another drop. Most importantly, this tilt in the balance of power will shore up the debt markets and the stockmarket, enabling the Fed to engage in continued money creation with ongoing war in the Mid-East (and the Ukraine) providing a perfect excuse, and some of this newly minted money can of course be used to buy off European politicians as usual and also provide food and lodging for the millions of new immigrants across the US.
The longer-term outlook for gold and silver could not be better with continued money creation and resulting inflation meaning that their prices must rise to compensate. Banks are known to be buying gold at record rates and short positions in gold and silver are being closed out, creating a potentially explosively bullish setup for the Precious Metals, so the expected short to medium-term drop in the metals resulting from temporary dollar strength will provide a final opportunity to buy at good prices. Tactics now are therefore to hedge or step aside here and be ready to move back in once this last drop has run its course and we will of course be looking out for this.
Read Full Story »»»
DiscoverGold
Gold Price Forecast: Downward Pressure Persists
By: Bruce Powers | February 9, 2024
• Gold’s downward pressure persists as it tests crucial support levels, with potential for further decline below recent lows.
Downward pressure on gold remains as it once again tests support at the lower boundary line of a small symmetrical triangle. Today’s low was at 2,020.28, only slightly higher than Thursday’s 2,2020.15 low. That puts gold in a precarious position, sitting right on a support zone. Following the 2,002-swing low in mid-January gold eventually attempted to move higher.
Last Thursday it reached a 20-Day high. However, that advance quickly got shot down the next day as supply increased. It is on track to close Friday back below the 50-Day MA (orange). The 50-Day line has helped define dynamic support since gold rallied above the line in mid-October.

Bearish Signal on Drop Below 2,015
A bearish signal will be triggered on a drop below this week’s low of 2,015. That would show a breakdown from recent consolidation and put gold in a position to test lower prices, below the recent 2,002 swing low. The 78.6% Fibonacci retracement remains at 1,998. Nevertheless, a more significant price zone is down around 1,979 and 1,973. An initial target for a declining ABCD pattern ends at 1,979 and the 1,973-price area is marked by the 50% retracement of the larger uptrend and a prior swing low from December.
Breakdown Could Test the 200-Day MA at 1,966
Potential support around the 200-Day MA is not much lower than the December swing low, at 1,966. Therefore, it seems likely it would be tested again as support if it is approached. Since gold rallied back above the 200-Day line in October, it has only had one successful test of the 200-Day line as support in November. A subsequent test of the 50-Day MA as support in December showed momentum increasing for the developing uptrend. Subsequent tests of the 50-Day line have been happening the past several weeks and the results leave the trend suspect.
Bullish Signal Above 2,045
If gold continues to hold above recent support and moves higher, the first bullish signal occurs on a rally above this week’s high of 2,045. Given the uncertainty lately, a daily close above that price level will be needed to confirm strength unless there is a clear sharp rally that takes gold well above 2,045. Further up it encounters potential resistance around the 2,088-swing high from late-December.
Read Full Story »»»
DiscoverGold
Gold Price Forecast: Bulls Eye Breakout Amidst Low Volatility
By: Bruce Powers | February 8, 2024
• Gold tests support, eyes bullish breakout above 2,040 amidst low volatility, signaling potential for upward trend reversal and higher targets.
Once again gold decided to test support at the lower end a small symmetrical triangle pattern, bordered in purple. Today, was the fourth touch of the line. Price was rejected to the upside as buyers stepped up and took control again. This resulted in a possible bullish hammer candlestick pattern forming for today. Therefore, a bullish breakout triggers above today’s high of 2,040. Gold may then encounter minor resistance at 2,045 but should bust through if it is going to have a chance to rise further in the immediate future.

Diminishing Volatility May be Coming to an End
The symmetrical triangle helps illustrate that gold has been stuck within consolidation for over two weeks. It coincides with the convergence of the 20-Day and 50-Day MAs. A bullish breakout of the triangle has failed so far, while multiple tests of support at the lower boundary line of the pattern further highlights the uncertainty.
Nevertheless, recent price action shows diminishing volatility. What follows is typically an increase in volatility or a trend, of some degree. The monthly chart further illustrates the low volatility environment. Trading in gold for February remains within the range of January, and January was contained within the range of December.
A Breakdown Triggers Below 2,015
Key near-term support is at this week’s low of 2,015. If gold falls below that level and stays there, the risk of lower prices increases. However, if that occurs, the nearby 2,009 and 2,002 minor swing lows should be breached rather quickly. The 78.6% Fibonacci retracement s at 1,998. It is followed by a swing low at 1,973.
Initial Upside Target of 2,117
On the upside, once the 2,045-price level is cleared gold heads toward the recent swing high at 2,065. A daily close above 2,065 further confirms a bullish reversal of the recent correction. The prior swing high at 2,088 is then the next higher target followed by 2,117. A rising ABCD pattern targets the 2,117-price area as an initial target. An extended target for that pattern is at 2,249 and it is joined by a 127.2% extension of the decline from the May 2023 peak.
Read Full Story »»»
DiscoverGold
Gold Price Forecast: Technical Signals and Price Targets
By: Bruce Powers | February 6, 2024
• Gold’s technical signals point towards potential bullish momentum, with a clear sign of strength expected above key resistance levels.
Gold trades inside day on Tuesday following a test of lower support on Monday. On Monday gold fell to a low of 2,015 thereby testing support at the lower boundary line of a small pennant consolidation pattern (purple). Support was seen off that low leading to a bounce and a likely higher close for Tuesday. Where gold closes will leave a clue. At the time of this writing gold is set to close above resistance represented by the top of the pennant, and the 20-Day (purple) and 50-Day (orange) MAs.

The high of the resistance range is set by the 50-Day line at 2,034. Therefore, a close above that level will provide a clear sign of strength that should lead to higher prices. Monday’s bearish behavior that tested support levels should be negated at that point.
Bullish Reversal Setting Up
Once Tuesday’s session ends gold will get a bullish signal on a rally above today’s high, 2,039 currently. That should complete a two-day throwback to the lower pennant support area. Further strength is then indicated with a rally above last week’s high of 2,065. The next primary target will then be the completion of a rising ABCD pattern at 2,117 (D). An interim target where resistance of some degree might be seen is around the prior swing high of 2,088 (B). Moreover, a monthly bullish signal triggers on a decisive rally above January’s high of 2,079.
Once Price Firms, New Highs in Sight
A bullish reversal off yesterday’s low has a good chance of leading to new record highs in the precious metals. Several false breakouts to new record highs triggered since August 2020 but each time the price of gold hit resistance leading to a correction of some months. For the current advance, it is starting a higher swing low than in previous attempts. Further, the price structure of the progression of the uptrend is pointing to higher prices.
50-Day Moving Average is Key Trend Indicator Going Forward
Going forward, a key trend indicator is the 50-Day MA. It has held up as support during several tests since November, including recently. However, the recent test is not complete until gold rises away from the 50-Day line. It has not yet done that and therefore the risk of further tests of support remains.
Read Full Story »»»
DiscoverGold
Abcourt Mines (ABMBF) (TSXV:ABI) - Can Abcourt Unlock High-Grade Gold Potential?
Abcourt Mines (TSXV:ABI) - Self-Funded High-Grade Gold Mill Expands -

NY Gold Futures »» Weekly Summary Analysis
By: Marty Armstrong | February 3, 2024
The NY Gold Futures closing today at 20537 is immediately trading down about 0.87% for the year from last year's settlement of 20718. Factually, this market is currently trading below last month's close and it had been weak for the past 2 months and if the market continues to remain beneath the previous month's close of 20674, then it will be in a weak position just yet. This price action here in February is reflecting that this is within the scope of a bearish reactionary move on the monthly level thus far.
Up to now, we still have only a 1 month reaction decline from the high established during December 2023. We must exceed the 3 month mark in order to imply that a trend is developing.
ECONOMIC CONFIDENCE MODEL CORRELATION
Here in NY Gold Futures, we do find that this particular market has correlated with our Economic Confidence Model in the past. The Last turning point on the ECM cycle low to line up with this market was 2022 and 2015. The Last turning point on the ECM cycle high to line up with this market was 2020 and 2011 and 1996.
MARKET OVERVIEW
NEAR-TERM OUTLOOK
The historical perspective in the NY Gold Futures included a rally from 2015 moving into a major high for 2023, the market has pulled back for the current year. The last Yearly Reversal to be elected was a Bullish at the close of 2022 which signaled the rally would continue into 2023. However, the market has been unable to exceed that level intraday since then. This overall rally has been 1 years in the making.
This market remains in a positive position on the weekly to yearly levels of our indicating models. Pay attention to the Monthly level for any serious change in long-term trend ahead.
From a perspective using the indicating ranges on the Daily level in the NY Gold Futures, this market remains neutral with resistance standing at 20628 and support forming below at 20471. The market is trading closer to the support level at this time.
On the weekly level, the last important high was established the week of December 4th at 21523, which was up 9 weeks from the low made back during the week of October 2nd. We have been generally trading up for the past week from the low of the week of January 22nd, which has been a move of 3.952%. When we look deeply into the underlying tone of this immediate market, we see it is currently still in a weak posture.
INTERMEDIATE-TERM OUTLOOK
YEARLY MOMENTUM MODEL INDICATOR
Our Momentum Models are declining at this time with the previous high made 2020 while the last low formed on 2023. However, this market has rallied in price with the last cyclical high formed on 2023 and thus we have a divergence warning that this market is starting to run out of strength on the upside.
Critical support still underlies this market at 19070 and a break of that level on a monthly closing basis would warn that a sustainable decline ahead becomes possible. Immediately, the market is trading within last month's trading range in a neutral position.
DiscoverGold
|
Followers
|
404
|
Posters
|
|
|
Posts (Today)
|
2
|
Posts (Total)
|
43500
|
|
Created
|
01/21/05
|
Type
|
Free
|
| Moderators NYBob DiscoverGold | |||
GOLDBUGS - I-hub's #1 precious metals board was created for those with an affinity for the yellow stuff.
Gold has a long history as a hedge against inflation, and in these challenging times it seems prudent to have a certain portion of your portfolio in gold and other precious metals.
For the novice or experienced trader investing in mining stocks or NYMEX, bullion or coins, exploration stocks or producers, you'll find others with similar interests.
Whether a technical or fundamental trader, long or short term, your questions and input are welcomed and appreciated.
"The GOLDBUGS board" is the place where Goldbugs live.
Articles, technical analysis, charts, and data of interest to goldbugs are all welcome here. Information concerning currencies and commodities are also welcome as these markets influence the PM's.
Rules of the Road:
1) No insults or bashing of another member.
2) Members will maintain an attitude of humility.
3) Members who find they are able to help another member will do so.
If you find the board useful please let us know by clicking the "Add To Favorites" link.


| Volume | |
| Day Range: | |
| Bid Price | |
| Ask Price | |
| Last Trade Time: |


