


| Followers | 686 |
| Posts | 142330 |
| Boards Moderated | 35 |
| Alias Born | 03/10/2004 |
Wednesday, February 21, 2024 4:59:42 PM
By: Bruce Powers | February 21, 2024
• Gold's rally above last week’s high faces resistance, but a breakout could signal higher prices and a shift to a larger uptrend.
Gold managed a brief rally above Tuesday’s 2,031 high to trigger a bullish trend continuation before encountering resistance at 2,032. It was the third time in two weeks that the 50-Day MA (orange) was successfully tested as resistance. First, that tells us that the 50-Day line represents resistance that could lead to another drop to test recent lows. Also, it shows the market making another attempt to breakout above the line. The second test was yesterday. Not only was there a new daily high today but there is also a higher daily low, showing that the five-day trend remains well in place.
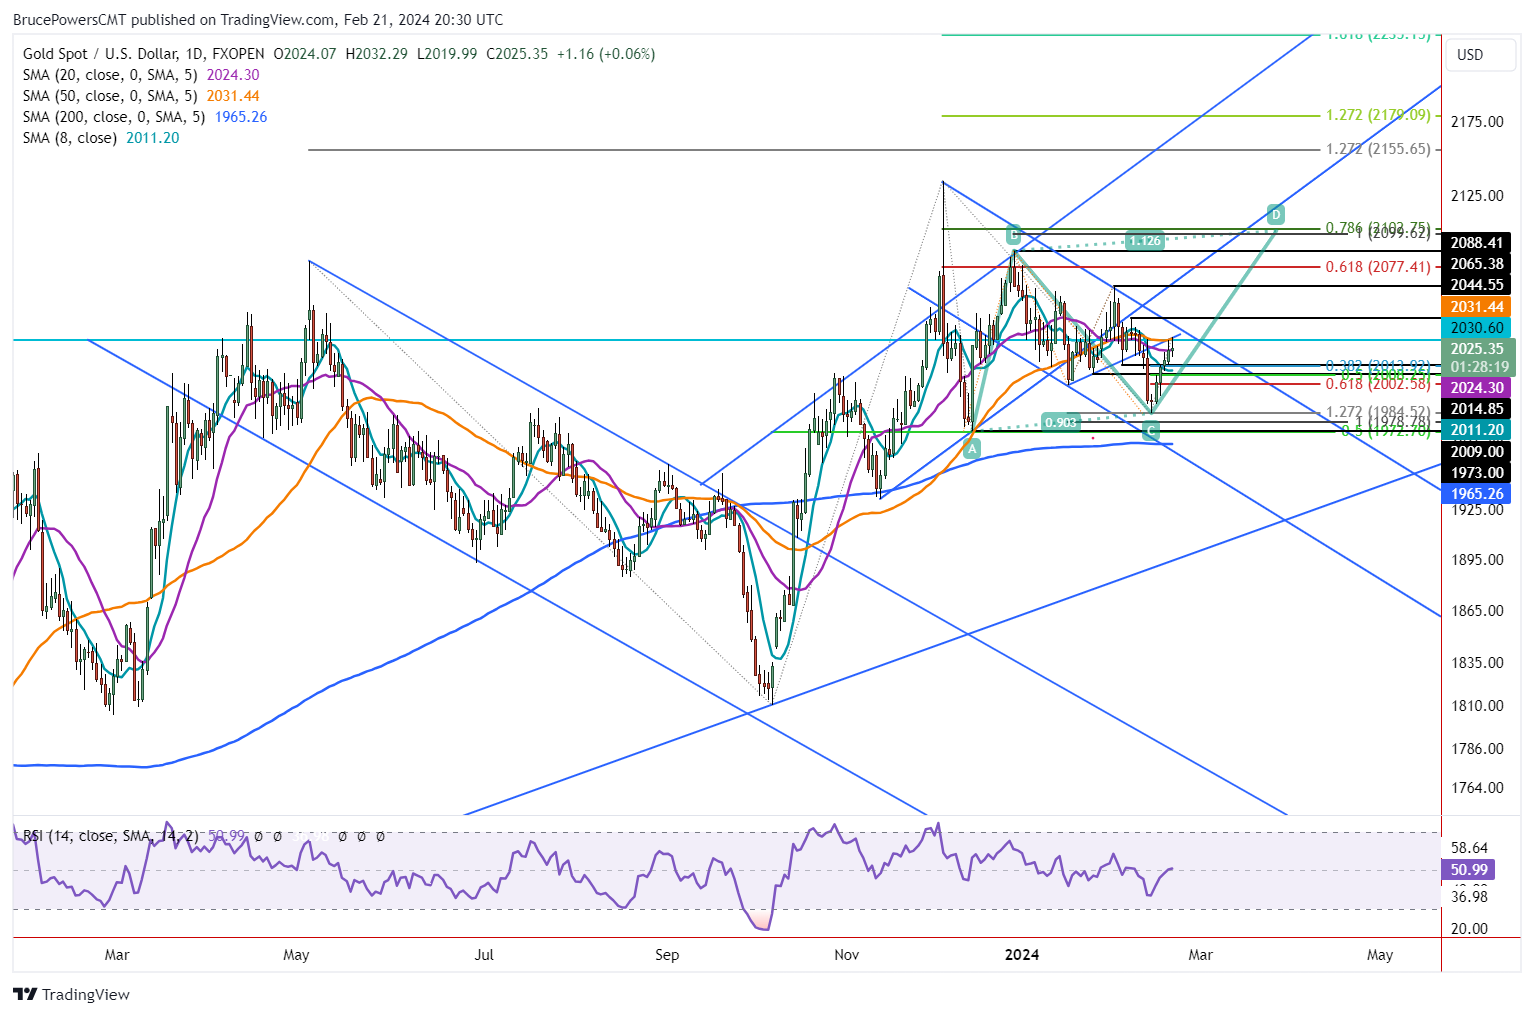
Weekly Bullish Breakout Triggers Above 2.03
Wednesday’s advance also triggered a weekly bullish breakout of last week’s hammer candlestick pattern, which was triggered on a move above 2,031. A daily close above 2,031 will confirm the weekly breakout and put higher prices on the agenda. The first interim target would then be around 2,045. If reached, gold will have risen above the downtrend line, marking a key development reflecting improving demand. Nonetheless, a daily close above the 55-Day MA, now at 2,031, will provide the next sign of strengthening.
Gold is Trying to Break Above 50-Day Moving Average at 2,031
Since today is the fifth consecutive day up for gold, and it continues to test resistance at the 50-Day line, it may lead to a turn down before breaking higher, if it is to do so. In that case, weakness is first indicated on a drop below today’s low of 2,020. There are then two potential support levels to keep an eye on, driven by prior seeing lows. They come in at 2,015 and 2009.
The 38.2% Fibonacci retracement is at 2,014, close enough to confirm the 2,015-price area. Also, the 50% retracement at 2,008 confirms the 2,009-price area as being potentially significant support. A drop below the daily low of 1,995 may lead to a further test of the recent swing low at 1,984, and possibly lower prices. Key lower support is represented by the 200-Day MA, which is currently at 1,965.
Upon Further Signs of Strength, Gold Targets 3,000
Gold has been channeling lower since the late-December swing high at point B. A daily close above the downtrend line marking dynamic resistance of the decline will give the first confirmation that the downtrend has switched to a developing uptrend. At that point, the completion of a rising ABCD pattern at 3,000 (even number) becomes a prime initial target.
Read Full Story »»»
 DiscoverGold
Information posted to this board is not meant to suggest any specific action, but to point out the technical signs that can help our readers make their own specific decisions. Caveat emptor!
• DiscoverGold
Recent GOLD News
- Barrick and Zijin Contribute $1 Million to Support Papua New Guinea Landslide Victims • GlobeNewswire Inc. • 06/07/2024 11:18:39 AM
- Form SD - Specialized disclosure report • Edgar (US Regulatory) • 05/29/2024 08:01:04 PM
- Barrick’s Sustainability Strategy Delivers Real Value to Stakeholders • GlobeNewswire Inc. • 05/15/2024 11:00:00 AM
- Barrick Announces Extensive Exploration Partnership with Geophysx Jamaica • GlobeNewswire Inc. • 05/01/2024 10:15:00 AM
- Barrick to Ramp Up Production As It Remains On Track to Achieve 2024 Targets • GlobeNewswire Inc. • 05/01/2024 10:00:00 AM
- Barrick Declares Q1 Dividend • GlobeNewswire Inc. • 05/01/2024 09:59:00 AM
- Barrick Announces Election of Directors • GlobeNewswire Inc. • 04/30/2024 08:15:55 PM
- Barrick On Track to Achieve 2024 Targets • GlobeNewswire Inc. • 04/16/2024 11:00:00 AM
- Notice of Release of Barrick’s First Quarter 2024 Results • GlobeNewswire Inc. • 04/09/2024 11:00:00 AM
- Strategy-Driven Barrick Builds on Value Foundation • GlobeNewswire Inc. • 03/28/2024 09:20:38 PM
- Barrick Hunts New Gold and Copper Prospects in DRC From Kibali Base • GlobeNewswire Inc. • 03/20/2024 02:00:00 PM
- Barrick Opens Academy at Closed Buzwagi Mine • GlobeNewswire Inc. • 03/18/2024 08:00:00 AM
- Barrick to Grow Production and Value on Global Asset Foundation • GlobeNewswire Inc. • 03/15/2024 11:53:01 AM
- Loulo-Gounkoto Delivers Another Value-Creating Performance • GlobeNewswire Inc. • 03/10/2024 10:00:00 AM
- Passing of the Right Honorable Brian Mulroney • GlobeNewswire Inc. • 03/02/2024 01:17:35 AM
- Kibali and DRC Partner to Promote Local Content • GlobeNewswire Inc. • 03/01/2024 02:22:43 PM
- Tanzanian Parliamentary Committee Lauds Barrick’s Work at North Mara • GlobeNewswire Inc. • 02/23/2024 12:00:00 PM
- Form 6-K - Report of foreign issuer [Rules 13a-16 and 15d-16] • Edgar (US Regulatory) • 02/14/2024 10:28:08 PM
- Form 6-K - Report of foreign issuer [Rules 13a-16 and 15d-16] • Edgar (US Regulatory) • 02/14/2024 08:05:25 PM
- Clear Strategies and Strong Partnerships Set Barrick Up to Outperform, Says Bristow • GlobeNewswire Inc. • 02/14/2024 11:00:00 AM
- Barrick Announces New Share Buyback Program • GlobeNewswire Inc. • 02/14/2024 10:59:00 AM
- Barrick Declares Q4 Dividend • GlobeNewswire Inc. • 02/14/2024 10:58:00 AM
- NGM Strongly Positioned for Growth • GlobeNewswire Inc. • 02/10/2024 01:00:16 AM
- Form SC 13G - Statement of acquisition of beneficial ownership by individuals • Edgar (US Regulatory) • 02/08/2024 03:03:08 PM
- Form 6-K - Report of foreign issuer [Rules 13a-16 and 15d-16] • Edgar (US Regulatory) • 02/08/2024 12:46:55 PM
Mass Megawatts Announces $220,500 Debt Cancellation Agreement to Improve Financing and Sales of a New Product to be Announced on July 11 • MMMW • Jun 28, 2024 7:30 AM
VAYK Exited Caribbean Investments for $320,000 Profit • VAYK • Jun 27, 2024 9:00 AM
North Bay Resources Announces Successful Flotation Cell Test at Bishop Gold Mill, Inyo County, California • NBRI • Jun 27, 2024 9:00 AM
Branded Legacy, Inc. and Hemp Emu Announce Strategic Partnership to Enhance CBD Product Manufacturing • BLEG • Jun 27, 2024 8:30 AM
POET Wins "Best Optical AI Solution" in 2024 AI Breakthrough Awards Program • POET • Jun 26, 2024 10:09 AM
HealthLynked Promotes Bill Crupi to Chief Operating Officer • HLYK • Jun 26, 2024 8:00 AM

