 News
News  Market Data
  Discover
Support: 888-992-3836
Copyright © 2023 InvestorsHub Inc.


Register for free to join our community of investors and share your ideas. You will also get access to streaming quotes, interactive charts, trades, portfolio, live options flow and more tools.
What is causing this spike?
Gold Surges to New Highs, Targets 2,462 Next
By: Bruce Powers | May 17, 2024
• Gold rallies to new high of 2,419, targeting 2,462 as strong bullish momentum pushes towards record weekly closing price.
Gold continued its rally today with a new swing high of 2,419. Momentum was strong indicated by the wide range day and full green candle. A top trend channel line and the 78.6% Fibonacci retracement were exceeded during today’s advance. Gold is set to close strong, near the top of this week’s trading range. Nevertheless, baring an extreme move before the close, it should end at its highest ever weekly closing price. That bodes well for future prices and alludes to a continuation higher and a possible breakout to new record highs.

Gold Targets 2,462 if 2,431 is Exceeded
The recent record high in gold was 2,431. If exceeded to the upside gold looks to be heading towards 2,462. That price area is the confluence of two Fibonacci levels. One is an extended retracement of the September 2011 decline, and the other is the 127.2% extended retracement from the recent pullback off the 2,431-record high. Since they line up and represent both a long-term price projection and a short-term level, it should be watched closely for signs of resistance. Regardless, demand could remain strong and push prices right through that zone. Whatever the reaction around that price level, it is a potential pivot to be watched.
Further Up is 2,480
That price target is followed by a slightly higher target at 2,480, which is the completion of a measured move. Gold rallied by 870 points from the August 2018 swing low of 1,160. The current advance, when measured from September 2022 trend swing low at 1,615, will be up by 870 when the price of gold is at 2,485. That is a target. After that there are a variety of possible interim targets if the bull trend in gold continues to advance, and it looks like it will.
Strong Follow Through from March Breakout
As discussed previously, gold successfully broke out of a multi-year basing period in March of this year. The subsequent follow-through has been bullish as momentum has stayed strong and retracements or consolidation periods have been minor. For example, the recent retracement found support and reversed higher with less than a 38.2% Fibonacci retracement being completed. This reflects demand from buyers. It has stayed strong.
Read Full Story »»»
 DiscoverGold
Gold Continues to Look Strong
By: Christopher Lewis | May 17, 2024
• The gold market rallied again in the early hours of Friday, as it looks like we are doing everything we can to breakout above the crucial level above.
Gold Markets Technical Analysis
You can see that the gold market rallied early during the trading session on Friday, as it looks like we are going to threaten the $2,400 level again. This is an area that has had significant resistance previously. So, if we can break above there, that would obviously be a huge victory at that point in time.
Gold, almost certainly, will try to look at the $2,500 level. On the other hand, if we see the market pullback from here, we could see plenty of support areas, especially all the way down to the $2,300 level. The 50 day EMA comes into that picture, and I think that solidifies at $2,300 level as support in general. At this point, the question isn’t so much as to whether or not gold is strong or whether or not it’s in a bullish market.
It’s just a question now as to when will we breakout to the upside with the geopolitical concerns around the world, it does make a certain amount of sense that gold and tends to rise. And then of course, you have the interest rate situation which is all over the place. Yes, rates are high, but at the same time, Wall Street continues to have this fantasy that the Federal Reserve is going to come and cut rates aggressively.
Perhaps more importantly, both of those central banks are out there buying masses of gold, so that obviously puts a little bit of a bid under the market as well. In general, this market continues to see a lot of noise, but I do think that it’s positive overall.
Read Full Story »»»
DiscoverGold
Gold Price Forecast: Will the Rally Continue?
By: Bruce Powers | May 16, 2024
• Gold surged to a new high but encountered resistance, pausing its advance. Key trendlines suggest further upside potential, with the rally likely leading to new record highs.
Gold rallied to a new trend high of 2,397 on Thursday before encountering resistance and pulling back intraday. At the time of this writing gold is on track to complete the day with a narrow range, reflecting a pause in the advance. Resistance was seen at the 78.6% Fibonacci retracement and further confirmed by a top rising trend channel line that marked the same price. Support for the day was at 2,371, right at the 61.8% Fibonacci retracement zone (prior resistance becomes support).
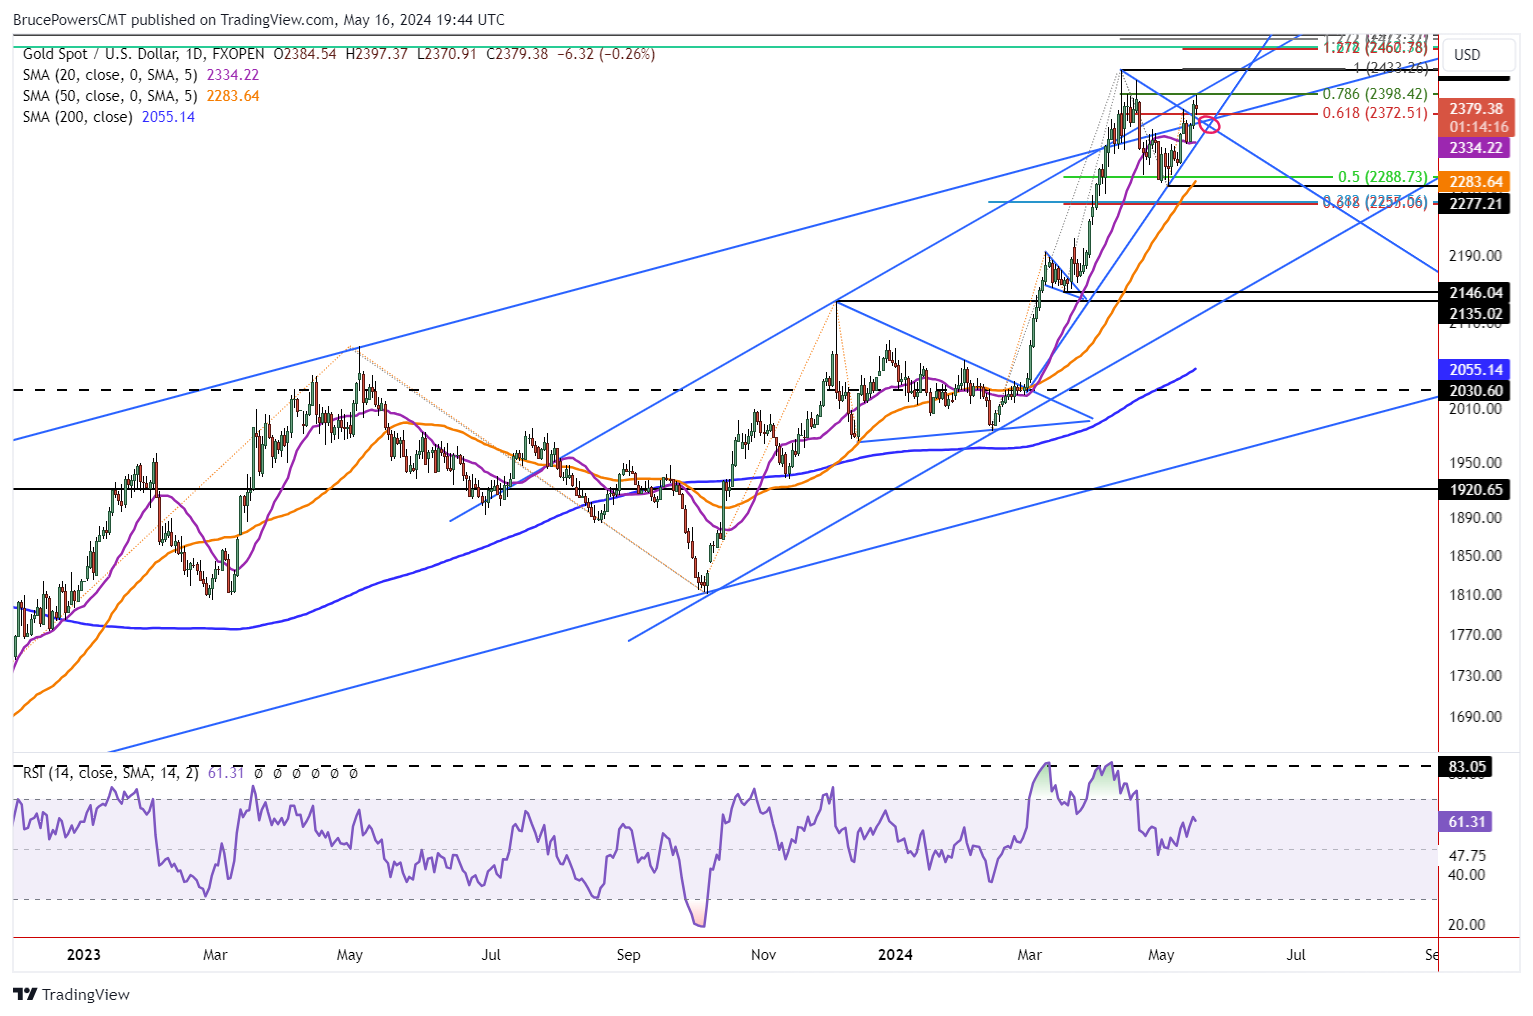
Trendlines Indicate Higher Prices for Gold
Of note is the relationship of the price of gold with two trendlines. The more significant line is the rising line connecting the recent May 3 swing low, as it covers a longer time frame than the second line. If gold stays above that line, it can be anticipated to continue to strengthen. Also, gold rose above the downtrend line starting from the April 12 record high of 2,431 yesterday, and it exceeded the prior trend high at 2,378 as well. Wednesday’s close was above both the line and prior trend high thereby confirming strength.
Second Breakout of Trend Channel in Process
Moreover, yesterday’s advance ended clearly above the longer top rising channel line, triggering a second bullish breakout from the parallel trend channel. Will the second breakout lead to upside follow through? Certainly, it is starting to look that way. In addition to the trendlines noted above, the purple 20-Day MA is critical support if a retracement begins. It happens to match the price represented by the rising trendline today at 2,334.
Breakout Above 2,397 Triggers Bullish Continuation
A decisive rally above today’s high of 2,397 provides a bullish signal. If this occurs the record high of 2,431 is the next target. Gold is likely to then continue to advance into new record high territory. The first new high target is around 2,461/2,462, marked by the confluence of two Fibonacci levels. It includes a 161.8% extension at of the retracement from the decline that began off the August 2011 trend high of 1,921. Therefore, it is potentially a significant price level as it covers a long period of time.
Read Full Story »»»
DiscoverGold
Gold Continues to See $2400 as Trouble
By: Christopher Lewis | May 16, 2024
• The gold market continues to see the $2400 level as a major barrier to continuing the gains in this market. However, it is most certainly a market that can’t be shorted, and at this point, should be a “buy on the dips” scenario.
Gold Markets Technical Analysis
The gold market rallied a bit during the trading session on Thursday to hit the $2,400 level. The $2,400 level is an area that previously has seen a pretty significant barrier. The $2,400 level being broken to the upside opens up the possibility of the market going to the $2,500 level, perhaps even higher than that.
At this point though, it would not surprise me at all to see a little bit of a pullback, mainly due to the fact that we have gotten a little stretched. A pullback could look like the gold market dropping all the way down to the $2,300 level, which is the bottom of the most recent pullback. We also have the 50-day EMA hanging around in the same area, and therefore I think it is more or less a hard floor at the moment.
Short-term pullbacks will more likely than not be a scenario where we can get a little bit of a buy on the dip mentality of most traders around the world. Keep in mind that the gold market is being stepped into by central banks as they’ve been accumulating for some time. The gold market is also highly sensitive to the interest rate situation around the world. So, pay attention to that. And at this point in time, it just looks like we are continuing the overall upward pressure, but I don’t necessarily want to chase right into this resistance.
If we get a daily close that is significantly above $2,400, then fine, I will jump in, but I think you probably get a little bit of a pullback here to offer some value, especially as may wish to take their profit later on on Thursday and into early Friday, we’ll just have to wait and see. Either way, selling gold isn’t even a thought.
Read Full Story »»»
DiscoverGold
Gold Price Breaks Resistance, Eyes Further Gains
By: Bruce Powers | May 15, 2024
• Gold price hits new high at 2,390, showing signs of strength and potential for further gains.
Buyers stepped up on Wednesday to help push the price of gold to a new trend high of 2,390. A bullish breakout triggered on the weekly chart on a move above last week’s high of 2,378. At the time of this writing the high of the day is 2,390. Today’s advance took gold back above a top channel line, which has been tested as resistance several times in the past few weeks and it provides another sign of strength for the precious metals. It doesn’t hurt that silver has also shown signs of continuing higher (not shown) as it rapidly approaches the high for the year.

Next Higher Target Zone is 2,398
Next, gold faces potential resistance around the 78.6% Fibonacci retracement at 2,398. That price area also marks a top channel line. An advance through 2,398 will put gold back above both rising parallel trend channels following a failed breakout in early-April. A recovery following a failed breakout initially sets the stage for a continuation of the trend into higher prices. The first upside target is the trend high of 2,431. If a bull trend continuation signal is generated on a decisive rally above 2,431, the next higher target is at 2,431. Two Fibonacci levels mark that spot.
Second Channel Breakout Attempt
If gold advances above the top channel line and stays there, and then further strengthens, it will confirm strength. The advance to date has seen the price of natural gas appreciate at a rapid pace. A steep angle of ascent represents strength but also increases the risk for a sharp retracement. A daily close or more above the channel will go a long way to satisfying the bulls.
Long-Term Outlook is Bullish
As discussed more than once before, gold is in the process of following through on a bullish breakout above a multi-year base building period. Today’s advance triggered a breakout of the downtrend line and last week’s high. It shows buyers getting aggressively interested in gold as global uncertainty in government broadens. Moreover, a pullback remains a possibility if signs of weakness start to show up. The first sign of weakness that could lead to a deeper retracement would be on a drop below today’s low of 2,352.
Read Full Story »»»
DiscoverGold
Gold Testing Support, Eyes on Upside Breakout
By: Bruce Powers | May 14, 2024
• Gold's position above 20-Day MA is critical, with a potential breakout above 2,364 indicating further strength towards the trend high of 2,378.
Gold has traded above the 20-Day MA for the past few days and again successfully tested the line as support today. This puts it in a critical short-term position. A drop below yesterday’s low of 2,332 is a break below daily support and the 20-Day MA, which is at 2,333 today.
Alternatively, a decisive advance above today’s high of 2,359, at the time of this writing, is a sign of strength, as it would signal an inside day breakout. However, a rise above Monday’s high of 2,364 is a more significant signal and has a better chance of seeing gold continue to strengthen from there. But the trend high of 2,378 needs to be exceeded to the upside before a trend continuation signal is generated.

Two Lines Mark Support
In addition to trend support represented by the 20-Day line, the uptrend line touching the lows of the most recent price action should also be given some attention. Notice that the 20-Day line and nearby uptrend line will converge within a day or two.
It could be hinting at further consolidation for a few more days. This week is an inside week so far. It is possible the week ends with the price of gold staying within the trading range of last week. If so, a sharper and sustained advance to challenge the 2,378 high and possibly exceed it, may have to wait until next week.
Drop Below 2,324 Eyes Deeper Pullback
On the downside, a bear flag may be in the process of forming with the internal uptrend line as a proxy for the lower boundary of the flag. It is not clearly formed yet but deserves to be watched to see if it progresses and becomes more clearly defined.
A drop below the trend line could see gold drop to test the 50-Day MA at 2,274. That price level is very close to the most recent swing low of 2,277. Given gold’s strong rally from the mid-February swing low, a test of support around the 50-Day line would not change the overall bullish outlook for gold. In fact, it would better prepare the market for a continuation into new record highs.
Read Full Story »»»
DiscoverGold
China’s Central Bank Topped Up Its Gold Reserves For An 18th Straight Month
By: Frank Holmes | May 14, 2024
Strengths
• The best performing precious metal for the week was silver, up 6.56%, which can be an indicator of speculative interest being revived in the precious metal trade. Gold consolidated early in the week between $2,340 to nearly $2,310, but the weaker than expected initial jobless claims came in higher than expectations, which launched gold higher, and the momentum continued Friday with the weaker than expected preliminary survey of consumer sentiment by the University of Michigan.
• K92 Mining reported drilling results from the Kainantu gold mine in Papua New Guinea that extended multiple high-grade zones and included a new dilatant zone discovery. At the Kora South deposit, a new dilatant zone was discovered with intercepts of 78.50 meters at 27.03 grams per ton gold equivalent and 34 meters at 8.14 grams per ton gold equivalent.

• Kinross reported operating results that surpassed RBC and consensus expectations with 4% higher production and 5% lower costs. This supported higher adjusted earnings per share (EPS) ($0.10 versus RBC $0.09). KGC reiterated annual guidance—in their view 1Q positions the company favorably to achieve annual targets.
Weaknesses
• The worst performing precious metal for the week was gold, but still up 2.66%. Gold Fields reported its Q1/24 operational results. While BMO had incorporated the softer quarter, costs came in significantly higher than expected. However, with backend-weighted production in H2/24, the company has kept overall guidance unchanged.
• Following a strong start to 2024, SA PGM exports for the month of March declined 13% year-over-year (YoY) and 12% month-over-month (MoM) to 504,000 ounces to the lowest levels since 2020. However, SA PGM exports year-to-date are still up 12% YoY and UBS continues to see increased exports for these metals to the West.
• Gatos' Q1 EPS of $0.04 compared with BMO’s $0.06 estimate, which included revenue of $72 million versus their $79 million. Notably, the JV continued to make strong capital distributions increasing Gatos' cash balance to $85.4M. All-in sustaining costs (AISC) of $14.36/ounce silver was at the low end of guidance and below their estimate.
Opportunities
• Data dating back to 2010 shows that in times of buoyant gold prices, exploration spend has typically followed. However, since 2019, exploration spend and the gold price have decoupled, Canaccord thinks driven by M&A. Over the last 10 years, periods of sustained exploration spend have typically been followed by several world-class discoveries.
• China’s central bank topped up its gold reserves for an 18th straight month in April, although the pace of buying slowed in the face of record prices. The People’s Bank of China has long been one of the market’s largest buyers, steadily growing its bullion holdings since 2022. However, the precious metal’s record-breaking rally since mid-February — with successive all-time-highs reached last month — seems to have dented demand, according to Bloomberg.
• A booming solar-power industry is driving a surge in the demand for silver, which is needed in large quantities to make photovoltaic panels. Silver is integral to the production of solar photovoltaic -- or solar PV -- panels because of its high electrical conductivity, thermal efficiency and optical reflectivity, as reported by the Wall Street Journal.
Threats
• JPMorgan summarized rainfall data for the April month for a selection of Australian projects, utilizing Bureau of Meteorology data. Rainfall 25%+ above the monthly mean was recorded at 11 sites, with East Coast assets in New South Wales and Queensland bearing the brunt coming out of the wet season.
• Gold’s 12% rally this year has put major bond and stock markets in the shade, but it does look to be losing momentum. That happens to coincide with a slowdown in the Chinese central bank’s purchases of the precious metal, according to Bloomberg.
• The Pan American Silver Escobal mine in Guatemala remains on care and maintenance as the ILO 169 consultations continue with the Xinka indigenous representatives and as a new government gains familiarity with the project. Management notes that the ILO 169 consultation process has experienced delays since the new government in Guatemala took office in January 2024, according to Canaccord.
Read Full Story »»»
DiscoverGold
NY Gold Futures »» Weekly Summary Analysis
By: Marty Armstrong | May 11, 2024
NY Gold Futures closed today at 23750 and is trading up about 14% for the year from last year's settlement of 20718. Caution is required for this market is starting to suggest it may now decline on the MONTHLY level. At the moment, this market has been rising for 6 months going into May suggesting that this has been a bull market trend on the monthly time level which has been confirmed by electing all of our model's long-term Bullish Reversals from the key low.
ECONOMIC CONFIDENCE MODEL CORRELATION
Here in NY Gold Futures, we do find that this particular market has correlated with our Economic Confidence Model in the past. The Last turning point on the ECM cycle low to line up with this market was 2022 and 2015. The Last turning point on the ECM cycle high to line up with this market was 2020 and 2011 and 1996.
MARKET OVERVIEW
NEAR-TERM OUTLOOK
The NY Gold Futures has continued to make new historical highs over the course of the rally from 2015 moving into 2024. However, this last portion of the rally has taken place over 9 years from the last important low formed during 2015. Noticeably, we have elected four Bullish Reversals to date.
This market remains in a positive position on the weekly to yearly levels of our indicating models. Pay attention to the Monthly level for any serious change in long-term trend ahead.
Looking at the indicating ranges on the Daily level in the NY Gold Futures, this market remains in a bullish position at this time with the underlying support beginning at 23479.
On the weekly level, the last important high was established the week of April 8th at 24488, which was up 8 weeks from the low made back during the week of February 12th. We have been generally trading up for the past week from the low of the week of April 29th, which has been a move of 4.380%. When we look deeply into the underlying tone of this immediate market, we see it is currently still in a semi neutral posture despite declining from the previous high at 24488 made 4 weeks ago. Still, this market is within our trading envelope which spans between 20767 and 23969. Immediately, this decline from the last high established the week of April 8th has been important Before, this recent rally exceeded the previous high of 20832 made back during the week of January 29th. Nonetheless, that high was actually lower than the previous high made the week of December 25th suggesting this market has really been running out of sustainable buying for right now. This immediate decline has thus far held the previous low formed at 19964 made the week of February 12th. Only a break of that low would signal a technical reversal of fortune and of course we must watch the Bearish Reversals. Right now, the market is neutral on our weekly Momentum Models warning we have overhead resistance forming and support in the general vacinity of 23402. Additional support is to be found at 22491. Looking at this from a wider perspective, this market has been trading up for the past 12 weeks overall.
INTERMEDIATE-TERM OUTLOOK
YEARLY MOMENTUM MODEL INDICATOR
Our Momentum Models are declining at this time with the previous high made 2020 while the last low formed on 2023. However, this market has rallied in price with the last cyclical high formed on 2023 and thus we have a divergence warning that this market is starting to run out of strength on the upside.
Interestingly, the NY Gold Futures has been in a bullish phase for the past 17 months since the low established back in November 2022.
Critical support still underlies this market at 20030 and a break of that level on a monthly closing basis would warn that a sustainable decline ahead becomes possible. Immediately, the market is trading within last month's trading range in a neutral position.
DiscoverGold
Gold Price Exclusive Update
By: Jack Chan | May 11, 2024

Our proprietary cycle indicator is now DOWN.
To public readers of our updates, our cycle indicator is one of the most effective timing tool for traders and investors. It is not perfect, because periodically the market can be more volatile and can result in short term whipsaws. But overall, the cycle indicator provides us with a clear direction how we should be speculating.
Investors
Accumulate positions during an up cycle and hold for the long term.
Traders
Enter the market at cycle bottoms and exit at cycle tops for short term profits.

GLD is on short term sell signal.

GDX is on short term sell signal.

XGD.to is on short term sell signal.

GDXJ is on short term sell signal.
Analysis

Current data favors overall lower gold prices.

Our ratio is on buy signal.

Trend is UP for USD.

Trend is UP for gold stocks.

Trend is UP for gold.

GDX is bound by support and resistance in a tight range.

A diamond bottom is a bullish chart pattern.

An ending diagonal has a bearish bias.
Summary
Gold sector cycle is now down.
Trend is up for gold and gold stocks..
$$$ We were stopped out with a small profit.
Read Full Story »»»
DiscoverGold
Gold CoT: Peek Into Future Through Futures, How Hedge Funds Are Positioned
By: Hedgopia | May 11, 2024
• Following futures positions of non-commercials are as of May 7, 2024.
Gold: Currently net long 199.6k, down 4.6k.

Last Friday, gold bugs showed up at $2,285 – well before testing horizontal support at $2,240s. They built on that this week, as the metal rallied 2.9 percent to $2,375/ounce. This comes after two weeks of decline.
On April 12th, gold printed a new intraday high of $2,449 but only to then reverse hard to close the session at $2,361. Friday’s intraday high of $2,385, in fact, kissed a falling trendline from that high. This resistance likely gives way in the sessions ahead.
Read Full Story »»»
DiscoverGold
Gold's $9K will take us all by surprise! How Many Ounces Of Gold & Silver Are You HOLDING? -
Rule
The Market View
Gold Price Breakout Above Key Levels Signals Strength
By: Bruce Powers | May 10, 2024
• After triggering a bullish weekly reversal, gold's advance signals strength, with potential for further upside towards recent highs.
Gold triggered a bullish weekly reversal on Friday as it advanced above last week’s high of 2,347. The high of the day was 2,378 before it pulled back intraday. Gold is on track to end the week above last week’s high and above the most recent swing high at 2,352, further confirming strength. Yesterday, gold gave an initial sign of strength with a daily close above the 20-Day MA.
Today’s advance completed a 61.8% Fibonacci retracement of the recent decline around 2,373. Also, notice that today’s rally got above a top channel trendline and is set to close above it. That line represented resistance recently during the pullback.

Bullish Reversal on Weekly Chart
This could be the beginning of a bullish reversal that tests recent highs and potentially begins an advance to new record highs. The recent retracement stalled at a low of 2,277, which is near the 50% retracement of an internal upswing. However, when measuring a larger portion of the uptrend that starts from the February swing low, support came in above the 38.2% Fibonacci retracement.
A retracement to the 38.2% price level would also be relatively minor and reflect underlying strength. However, buyers were more aggressive and turned the price of gold back up at a higher price area. And momentum has been strong the past two days as the ascent began.
Price Levels to Watch on the Way Up
Price levels to watch on the way up include the three-week high of 2,389 and the 78.6% Fibonacci retracement at 2,398. There is then an interim swing high at 2,418 and the trend high at 2,431. An initial breakout above the top trend channel line triggered on April 8. But it failed to continue and led to the recent retracement. It is interesting to note that the market recognized that pivot as the two channel lines crossed at that point (circled).
Subsequently, the top lines acted as support for the next nine days as gold attempted to go higher. Watch for similar or more bullish price action once gold gets above both lines. It is now above one line. But that line is more significant as it measures the larger rising parallel trend channel.
Read Full Story »»»
DiscoverGold
Gold $GLD - Update...
By: Sahara | May 10, 2024
• $GOLD $GLD - Update.
Held that Channel (Shaded) and now pressuring the 'Flag' B/Out Line. If successful will bring $2500-$2600 Level into focus...

Read Full Story »»»
DiscoverGold
Maple Gold Mines:
This penny gold stock may have five million ounces in the ground by year end (2024) when fully funded drilling is completed.
✔️📈👍
Gold Price Forecast: What’s Next for the Precious Metal?
By: Bruce Powers | May 9, 2024
• A breakout above key resistance levels, including 2,347 and this week's high, could signal a sustained advance for gold, following its multi-year basing pattern breakout in March.
Gold showed strength today, rising to test resistance around the 20-Day MA with the day’s high of 2,342, at the time of this writing. That is an eight-day high for which it traded within a relatively tight range. Today’s high generates a new high for the consolidation range. Although it is a sign of short-term strength, it doesn’t change the near-term outlook. A daily close above the 20-Day MA at 2,335 would begin to do that. Also, after today’s session, a daily close above today’s high would also be a sign of strength that may lead to increased demand.
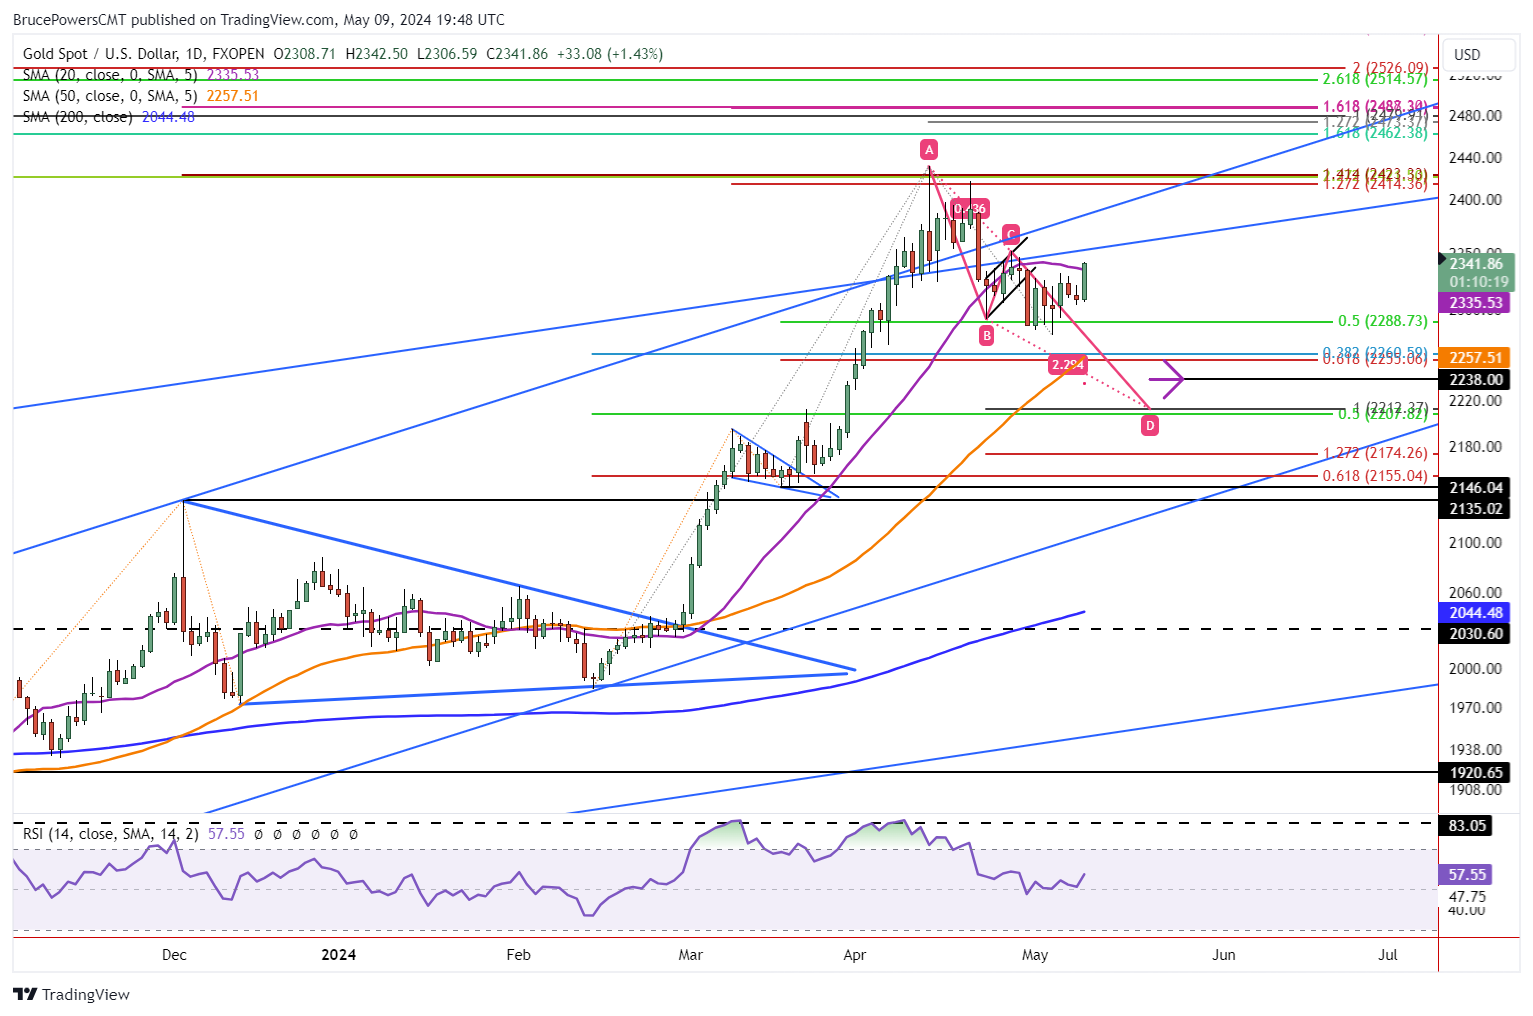
Testing Resistance
So, what happens next will be of interest. If gold moves above today’s high (also 20-Day MA), then higher prices may follow. But if today’s resistance holds and is followed by a pullback, a continuation of the retracement remains in play. Last week’s high of 2,347 is also an important near-term price level as a rally above it will trigger a bullish reversal in the weekly time frame. Currently, gold is set to complete this week as an inside week.
Therefore, starting next week a breakout above this week’s high would provide a bullish signal, keeping in mind that such a move would also exceed resistance around the 20-Day line. Buyers have regained control of silver following today’s rally above its 20-Day MA. This might be a warning that gold could be about to do the same. Price action will provide a guide.
Watching for Signs of Strength
Potential lower targets have been discussed in recent articles, so today let’s consider the upside potential. A decisive breakout above last week’s high of 2,347 will provide a bullish signal that could lead to higher prices, or above this week’s high once the week completes. Additional strength will be indicated on a rally above the most recent swing high on the daily chart at 2,352 (C). Once there is a daily close above the slightly higher level, the chance for a sustained advance improves.
Minor Retracement Shows Underlying Strength
When considering the larger picture. Gold broke out of a multi-year basing pattern in March and kept going until reaching the current record high of 2,431. If last week’s low of 2,277 is the completion of a retracement, it would reflect strong underlying demand for gold as buyers stepped up before a 38.2% Fibonacci retracement completed.
Read Full Story »»»
DiscoverGold
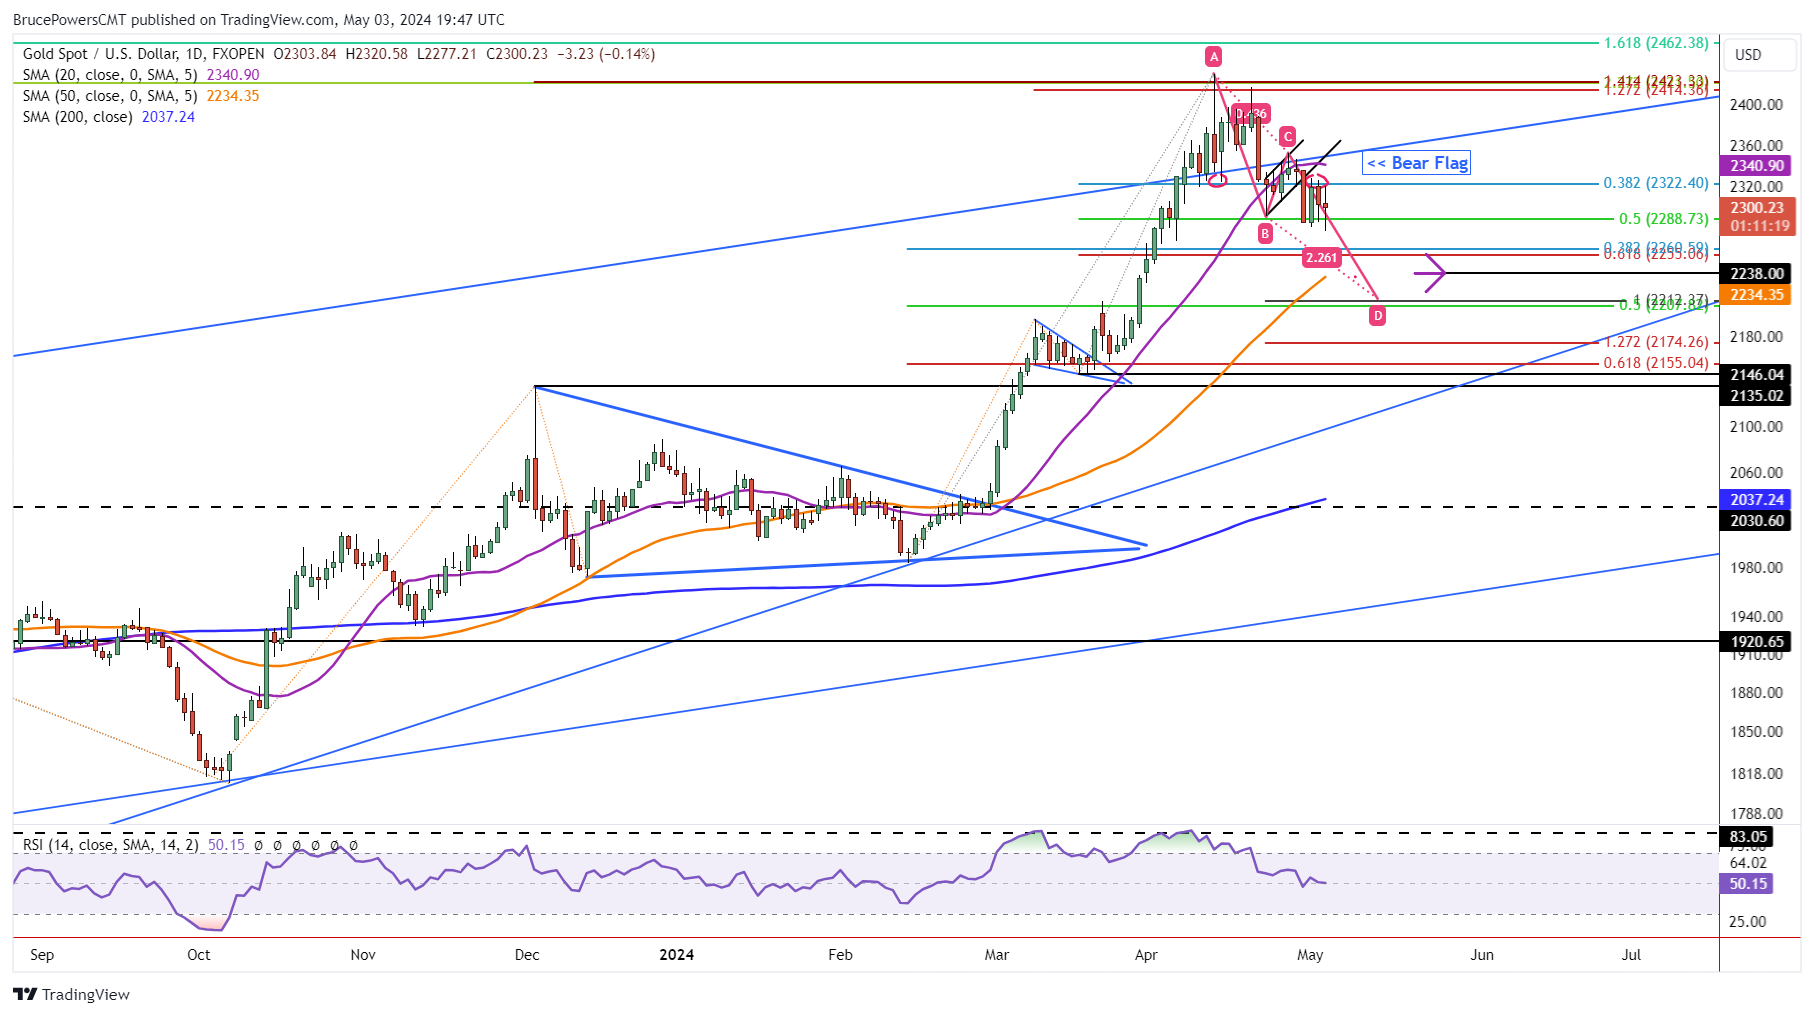
Gold Bearish Bias Persists as Consolidation Persists
By: Bruce Powers | May 8, 2024
• Gold's price movements suggest a bearish bias, with key support levels and potential targets indicating a possible continuation of the current downtrend.
Gold continues to go nowhere as it further trades within a seven day price range on Wednesday. The stage is set for a continuation lower. A bearish bias remains given the breakdown from a bear flag last week. Gold also continued to fall away from the 20-Day MA, which was tested as resistance all this week. April 23 was the first decline below the 20-Day line since the rally began on February 29 with a breakout from a symmetrical triangle bottom pattern.
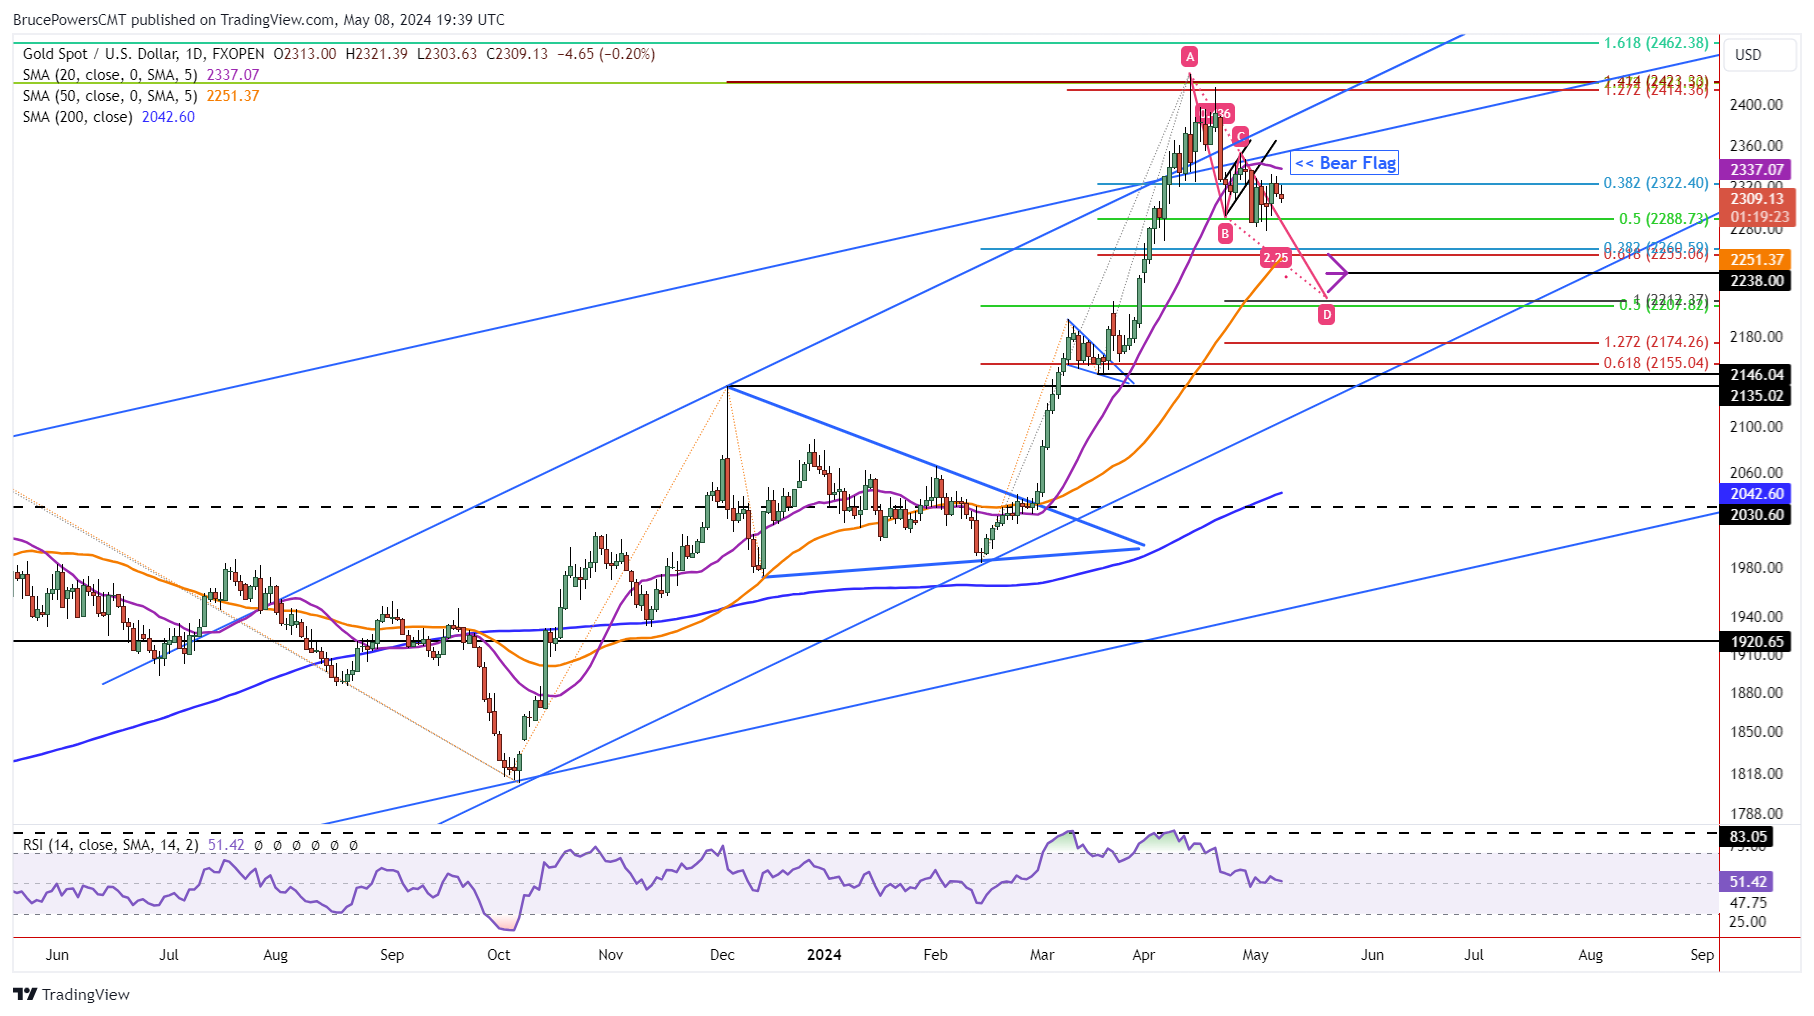
50-Day Moving Average is Key Lower Target
A key lower potential support level is around the 50-Day MA, currently at 2,251. It is close to converging with a Fibonacci confluence zone from 2,261 to 2,255. Together, they create a price range from 2,261 to 2,255. This will be a decision zone where there may be signs of support followed by a bullish reversal. However, there are lower price targets in the case that gold continues to retrace the previous advance.
Lower Targets if 50-Day Line Fails to Hold
The initial target from the bear flag pattern is at 2,238, while a falling ABCD pattern targets 2,212. That lower price level is given added significance by the 50% retracement at 2,208. It is important to be aware that the low support level from April was at 2,228. This means that if gold falls below 2,228 on the way to the lower price zone, it will have triggered a bearish move on the monthly chart. That would be a sign of weakness that could make it more difficult for the uptrend to recover without further consolidation or retracement.
Recognition of Rising Trend Channels
How down might gold go? There are two rising trend channels on the chart of gold. A larger one and smaller one. Gold remains within the boundaries of the smaller channel, that is within the larger channel. Last month there was a false breakout of both trend channels, leading to the current retracement. Typically, once a side of the channel has been tested as resistance in this case, the potential for gold to fall to test the lower channel line becomes possible. Of course, that would occur first on the smaller channel. But the price represented by the line will depend on when it is approached given its downward slope.
Read Full Story »»»
DiscoverGold
Gold Sideways Trend Continues, Bear Flag Pattern Signals Potential Decline
By: Bruce Powers | May 7, 2024
• Gold remains in consolidation below key resistance levels, with a bearish flag pattern indicating potential for lower prices unless it rallies above recent highs.
Gold remains stuck in consolidation and has been trending sideways for the five days. Consolidation is occurring just below resistance represented by the purple 20-Day MA, currently at 2,330, and the 38.2% Fibonacci retracement at 2,322. The 38.2% price zone previously represented support and now resistance. Further, gold remains under a bear flag that triggered a sharp decline starting with a break below 2,320 last Tuesday. Since then, recent price action has done nothing to negate the potential for a deeper pullback and lower prices indicated by the breakdown of the flag.
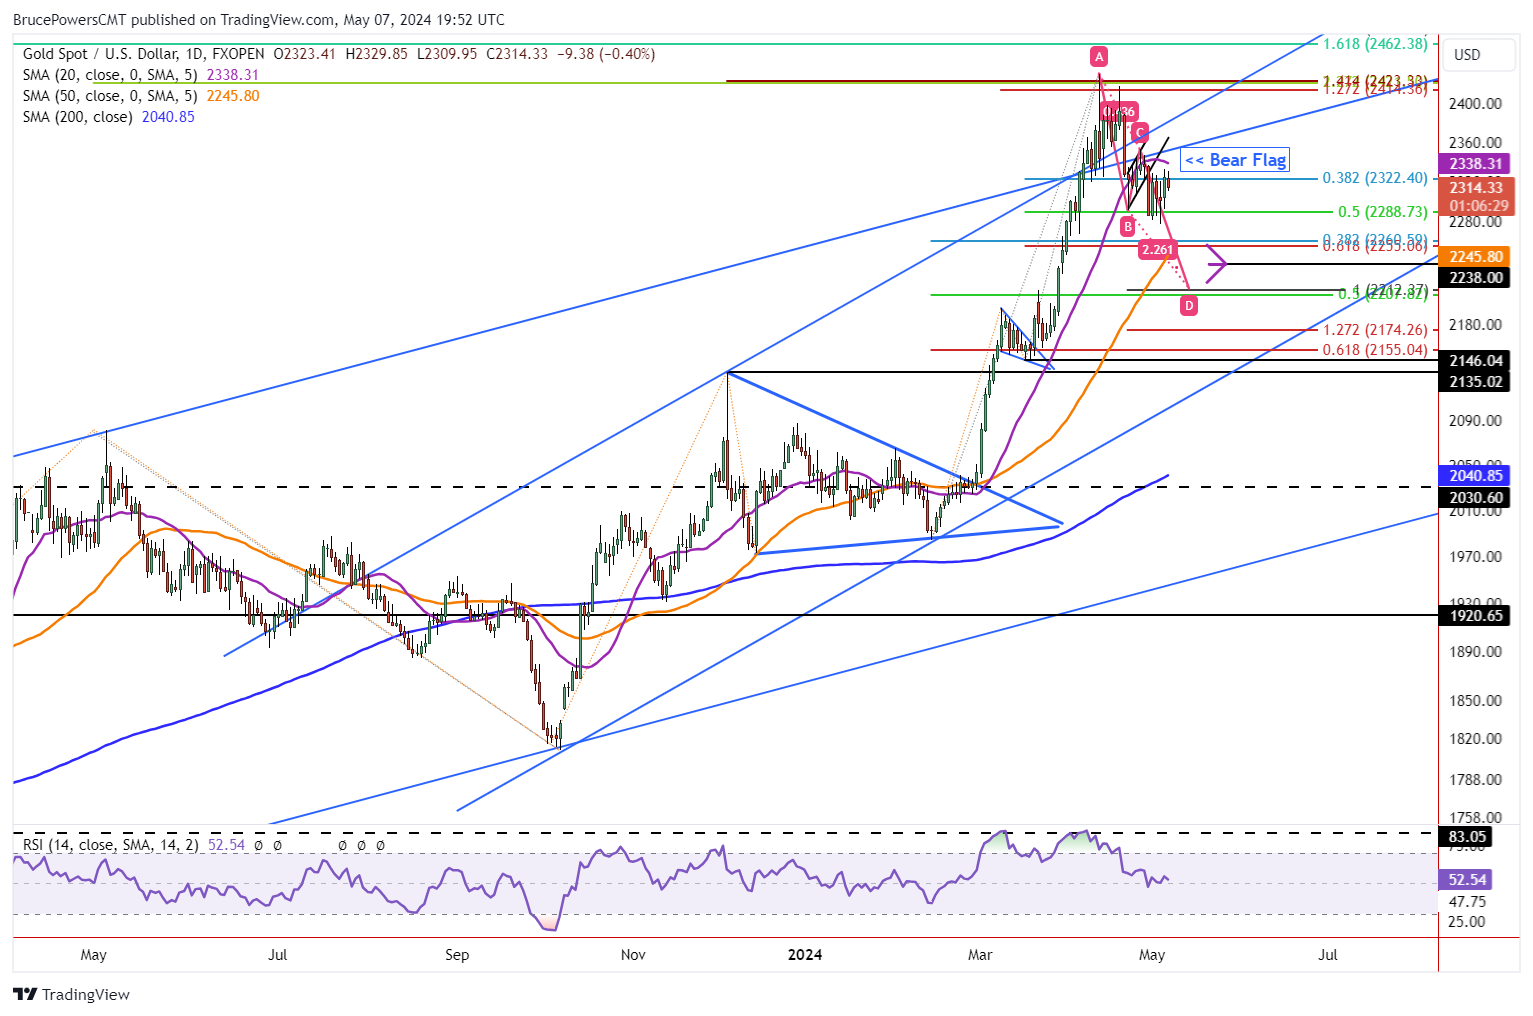
Bear Flag on Deck
The bear flag shows a small rising parallel trend channel. Each boundary line has three touches from price. There is symmetry represented in the pattern as the channel can be divided in half. In other words, it is a clear and solid pattern that has been broken. It shows a pause in the degree of selling that occurred prior to the flag’s formation. Therefore, a continuation lower is the most likely resolution and that has been indicated by the breakdown last week.
Nevertheless, a five-day pause below the breakdown level does not show selling pressure increasing. It leaves open the possibility of a failure of the bearish pattern. A failure would occur during an advance prior to new retracement lows. However, a rally above last week’s high of 2,347 would need to occur for signs of a failed bearish pennant.
Key Near-Term Support at 2,227
Support from the recent consolidation is at last week’s low of 2,227. The next bearish signal will be indicated on a drop below that price level. Calculating the measuring objective for the bear flag provides a minimum target of 2,238. However, the orange 50-Day MA has been rising as the price of gold consolidates. If it continues to consolidate for a while longer, the 50-Day line may join a slightly higher target zone from 2,261 to 2,255. If it does, the chance of hitting that price zone will increase. The 50-Day line is currently at 2,246.
There is also a lower potential target zone from around 2,212 to 2,208. However, last month’s low support was at 2,228. If this lower price zone is reached, then the monthly low would have been broken. A drop below a monthly low would diminish the current underlying bullishness that remains in the market.
Read Full Story »»»
DiscoverGold
Gold Forecast: Gold Cycles Warned of Current Decline
By: Jim Curry | May 5, 2024
From my last article posted back in mid-April ("Gold Cycles Move into Topping Range"), Gold has turned south, and is in the midst of a correction with our 72-day time cycle. Though this decline looks to have further to run, it is expected to end up as an eventual countertrend affair - due to the position of the larger-degree waves.
Gold's Dominant 72-Day Cycle
As in past articles, the last low for our 72-day wave was made back in mid-February, later confirmed by the subsequent reversal above the 2086 figure. In terms of price, that action triggered a 10-14% rally for the metal, which was easily met with the action that followed.
Here again is our 72-day time cycle for Gold:
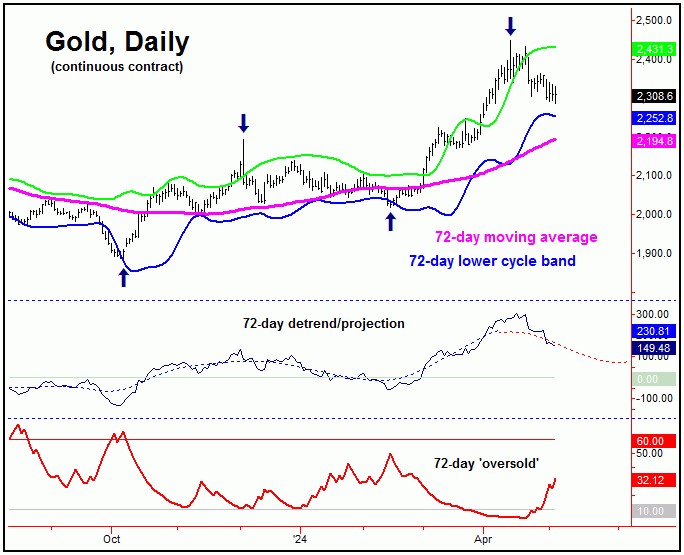
From my April 14th article: "the average rally phases with this 72-day wave were noted as having taken 39 trading days before topping, which favored higher highs into April 9th or later. With that, the highest high seen was Friday's (April 12th) peak of 2448.80, which puts us into the expected topping range with this cycle. Once this 72-day wave turns, a decent correction should be expected to unfold."
As originally noted in article back in March, the average rallies with this 72-day cycle - when coming off a 'higher-low' - took around 39 trading days before completing. This made the inference for strength into April 9th or later, which was seen - with the highest high made with the April 12th tag of 2448.80 (June, 2024 contract).
There were technical signs that Gold was peaking back on April 12th, with the main one of these being our Gold Timing Index, shown on the chart below:
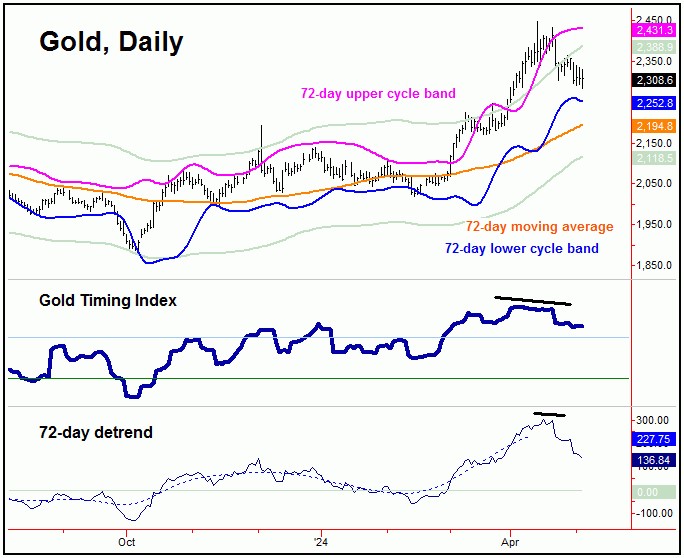
One of the things that we look for at Gold cycle tops (such as with our 72-day wave) is a divergence between our Gold Timing Index, and the actual price of the metal. Typically, the indicator and the price of Gold will move in tandem.
Having said the above, when Gold spikes to a higher price high - and is accompanied by a divergence in our Gold Timing Index - the market is often near a peak of importance. And, since the last peak was expected to come from our 72-day time cycle, the assumption was that this wave was topping - as per my last article from mid-April.
Going further, since the long side was at higher risk - based on the above divergence signal - we managed to exit our open long GLD position on April 12th, the exact day of the high for the last swing. With that, we will be looking for indications to re-enter the long side going forward, based on the position of our 72-day cycle.
Potential Downside & Expected Pattern
In terms of price, following my rule that a valid cycle will see a reversion back to a moving average of the same length better than 85% of the time, the downside 'risk' is back to the 72-day moving average in the coming weeks. Even said, the decline into the next 72-day trough is unlikely to be a straight shot down (though anything is possible).
Having said the above, if the downward phase of our 72-day wave is to remain intact into the late-May to early-June window, this would tell us to expect any short-term rallies to end up as countertrend. With that, we are in the range for a short-term low to develop, coming from a smaller-tracked 20-day cycle, shown in the chart below:
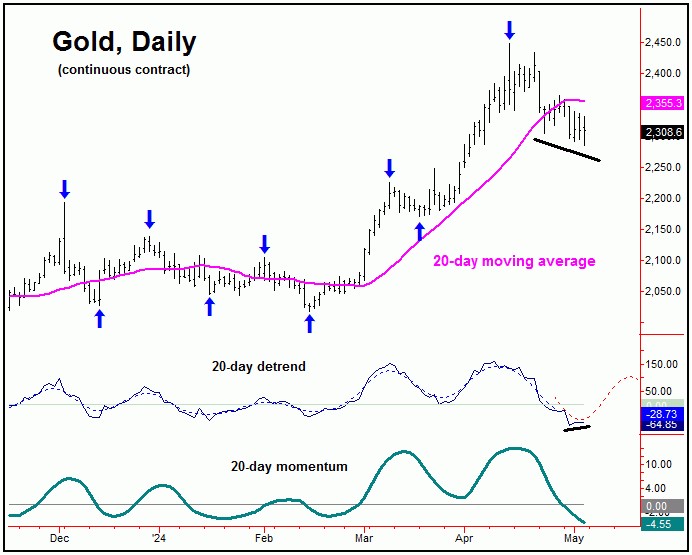
With the above said and noted, a short-term rally with the 20-day wave could see the 20-day moving average acting as the magnet - and may also act as resistance, to a move expected to end up as countertrend, due again to the position of our 72-day wave. If correct, a drop back to lower lows would play out into late-May to early-June.
Stepping back then, if Gold is making lower lows for the 72-day cycle downward phase into late-May to early-June, we will need to be on the lookout for indications of a bottom forming with this wave, as what follows is expected to be another sharp rally of some 10-14% off the low, lasting well into the Summer of this year.
With that, we can look at a chart of our 72-day wave once again, this time adding in both our Gold Timing Index - as well as our 72-day 'oversold' indicator:
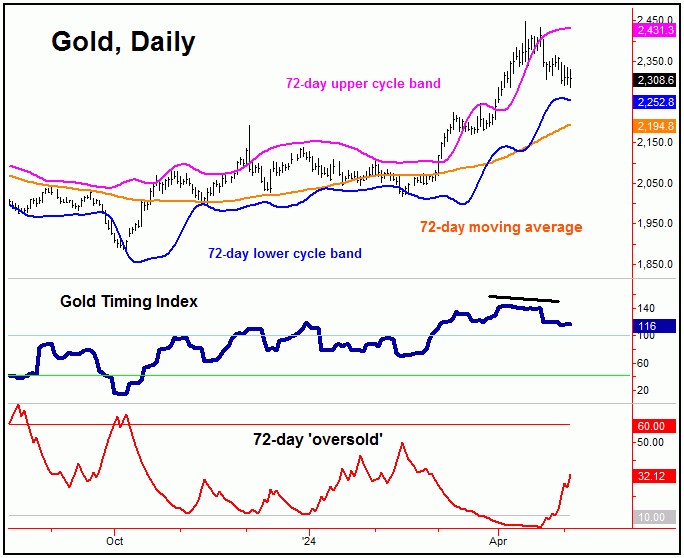
What we like to see as our 72-day wave bottoms out is either (1) a drop below the 40 level in our Gold Timing Index, and/or (2) a spike above the 72-day 'oversold' indicator's upper reference line of 60. If either (or the combination of the above) are seen going forward, this would be our indication to re-enter the long side, in the anticipation of a sharp 10-14% rally playing out into this Summer.
Read Full Story »»»
DiscoverGold
Gold Commodity Trading Advisor (CTA)' bullish stance on gold reflects their confidence in the precious metal's potential for upward price momentum and as a hedge against inflation and financial uncertainties
By: Isabelnet | May 7, 2024
• Gold
CTAs' bullish stance on gold reflects their confidence in the precious metal's potential for upward price momentum and as a hedge against inflation and financial uncertainties

Read Full Story »»»
DiscoverGold
Gold $GLD - 'Cup' Latest. Watch the Qtrly 5/MA (Lime) for Spprt...
By: Sahara | May 3, 2024
• $GOLD $GLD - 'Cup' Latest.
Watch the Qtrly 5/MA (Lime) for Spprt...

Read Full Story »»»
DiscoverGold
NY Gold Futures »» Weekly Summary Analysis
By: Marty Armstrong | May 4, 2024
NY Gold Futures closed today at 23086 and is trading up about 11% for the year from last year's settlement of 20718. Caution is required for this market is starting to suggest it may now decline on the MONTHLY level. Immediately, this market has been rising for 6 months going into May suggesting that this has been a bull market trend on the monthly time level which has been confirmed by electing all of our model's long-term Bullish Reversals from the key low.
ECONOMIC CONFIDENCE MODEL CORRELATION
Here in NY Gold Futures, we do find that this particular market has correlated with our Economic Confidence Model in the past. The Last turning point on the ECM cycle low to line up with this market was 2022 and 2015. The Last turning point on the ECM cycle high to line up with this market was 2020 and 2011 and 1996.
MARKET OVERVIEW
NEAR-TERM OUTLOOK
The NY Gold Futures has continued to make new historical highs over the course of the rally from 2015 moving into 2024. However, this last portion of the rally has taken place over 9 years from the last important low formed during 2015. Distinctly, we have elected four Bullish Reversals to date.
This market remains in a positive position on the weekly to yearly levels of our indicating models. Pay attention to the Monthly level for any serious change in long-term trend ahead.
The perspective using the indicating ranges on the Daily level in the NY Gold Futures, this market remains moderately bearish position at this time with the overhead resistance beginning at 23380 and support forming below at 22962. The market is trading closer to the support level at this time.
On the weekly level, the last important high was established the week of April 8th at 24488, which was up 8 weeks from the low made back during the week of February 12th. We have seen the market drop sharply for the past week penetrating the previous week's low and it closed lower. We are trading below the Weekly Momentum Indicators warning that the decline is very significant and we need to pay attention to the timing and reversals. When we look deeply into the underlying tone of this immediate market, we see it is currently still in a semi neutral posture despite declining from the previous high at 24488 made 3 weeks ago. Still, this market is within our trading envelope which spans between 17100 and 27120. Immediately, this decline from the last high established the week of April 8th has been important closing sharply lower as well. Before, this recent rally exceeded the previous high of 20832 made back during the week of January 29th. Nonetheless, that high was actually lower than the previous high made the week of December 25th suggesting this market has really been running out of sustainable buying for right now. This immediate decline has thus far held the previous low formed at 19964 made the week of February 12th. Only a break of that low would signal a technical reversal of fortune and of course we must watch the Bearish Reversals. Right now, the market is below momentum on our weekly models casting a bearish cloud over the price action as well as trend, long-term trend, and cyclical strength. Looking at this from a wider perspective, this market has been trading up for the past 11 weeks overall.
INTERMEDIATE-TERM OUTLOOK
YEARLY MOMENTUM MODEL INDICATOR
Our Momentum Models are declining at this time with the previous high made 2020 while the last low formed on 2023. However, this market has rallied in price with the last cyclical high formed on 2023 and thus we have a divergence warning that this market is starting to run out of strength on the upside.
Interestingly, the NY Gold Futures has been in a bullish phase for the past 17 months since the low established back in November 2022.
Critical support still underlies this market at 20030 and a break of that level on a monthly closing basis would warn that a sustainable decline ahead becomes possible. Immediately, the market is trading within last month's trading range in a neutral position.
DiscoverGold
Gold CoT: Peek Into Future Through Futures, How Hedge Funds Are Positioned
By: Hedgopia | May 4, 2024
• Following futures positions of non-commercials are as of April 30, 2024.
Gold: Currently net long 204.2k, up 1.3k.

Bids showed up this week well before testing horizontal support at $2,240s, which is where the 50-day now lies. Gold dropped 1.6 percent this week to $2,309/ounce, with Friday’s low tagging $2,285. This was the second weekly decline in a row.
The metal has been unwinding the overbought condition it is in since bottoming at $1,824 last October and at $1,996 as recently as February 14th. On April 12th, the metal printed a new intraday high of $2,449 but only to then reverse hard to close the session at $2,361.
The weekly remains overbought. At some point, gold bugs will be forced to defend breakout retest at $2,080s, which the yellow metal broke out of in early March. Right here and now, they have an opportunity to put their foot down. Nearest resistance lies at $2,350s.
Read Full Story »»»
DiscoverGold
Gold Technical Signals Point to Potential Downside
By: Bruce Powers | May 3, 2024
• Despite holding support around the 50% retracement level, gold faces more technical bearish signs, with a bear flag pattern indicating potential for lower levels ahead.
Although gold reached a new retracement low of 2,277, it continues to find support around the 50% retracement level. It is set to end Friday above the 50% retracement for the third day in a row, which is at 2,289. However, there remains more technical bearish signs than bullish indications currently, as it is in the process of retracing prior gains.
Bear Flag Continuation Potential Remains
A bear flag trend continuation pattern triggered on Tuesday and gold closed weak, near the low of the day and below the prior April 23 (B) swing low. That is a bearish sign indicating that it wants to go lower. However, rather than continue lower following the bearish signal, for the past three days gold has been consolidating around Tuesday’s price range instead. Nonetheless, price patterns are indicating lower support levels will likely be tested before the larger bull trend is ready to resume. An advance above last week’s high of 2,352 (C) would be needed to change that outlook.
Several Lower Targets
The next potential support area below this week’s low is a range of Fibonacci levels from 2,261 to 2,255. But that may be an interim level as the 50-Day MA has not been tested as support since the February 29 symmetrical triangle breakout. Since the 20-Day MA has failed to hold as support, the 50-Day line becomes a target. It is currently at 2,234, and very close to an initial target derived from the bear flag measurements. That pattern indicates a potential target of 2,238. Be aware that April saw support at a low of 2,228.
Support From April at 2,228
If the next lower price zone is to be reached this month, a bearish month signal will have triggered. If that happens, sellers could get more aggressive and drive prices lower. Below the 50-Day line there is the completion of a falling ABCD pattern at 2,212 and a 50% retracement level at 2,208. That would be the price area to watch for support if the 50-Day line is broken followed by April’s low.
Read Full Story »»»
DiscoverGold
Gold Weekly Price Forecast – Gold Continues to See a Lot of Volatility
By: Christopher Lewis | May 3, 2024
• Gold markets have been all over the place during the course of the week, as we continue to see a lot of noise from various input factors.
Gold Markets Weekly Technical Analysis
We have fallen rather significantly to break below the $2300 level. At this point we have turned around to show signs of life and the $2300 level I think is going to continue to be a situation where we will have to see if we can recover.
If we can recover from here, then it’s likely that we will make a move to the $2,400 level. In general, this is a market that remains bullish so even though we sold off the way we did, I don’t really have any interest in trying to get involved. If we break down below the bottom of the candlestick for the week then it could open up a move down to the $2,200 level. In general, there are a lot of things to worry about when it comes to gold markets and what could be driving them. So do be aware of the fact that we might have a situation where traders start to worry about geopolitical issues, perhaps interest rates. We’ll just have to wait and see.
With the jobs number coming in weaker than anticipated, it looks like people are taking a little bit of a breather, perhaps selling some of the gains in the gold market to finance new positions in places like NASDAQ. We will have to wait and see, but this is obviously a very bullish market, and I don’t need to Look at any indicators to sort this out sooner or later we balance and once we start to bounce, I’m going to be on the other side of it and start buying gold at that point again for a longer-term trade If you like the video, give me a thumbs up and subscribe.
Read Full Story »»»
DiscoverGold
Gold Bearish Signals Point to Deeper Retracement
By: Bruce Powers | May 2, 2024
• Top trendline and 20-Day MA now act as resistance after previously behaving as support, indicating a bearish turn for gold..
Resistance was tested again today in gold for the second day in a row following the breakdown from a bear flag on Tuesday. Notice that resistance occurred around prior support represented by the 38.2% Fibonacci retracement level of 2,322. The 38.2% price zone was tested as support on the first pullback from the recent 2,431 record high on April 15. This is typical price behavior in a market that is turning bearish. Prior support levels become resistance. Although the bull trend remains well intact a deeper retracement is likely before it is ready to resume.
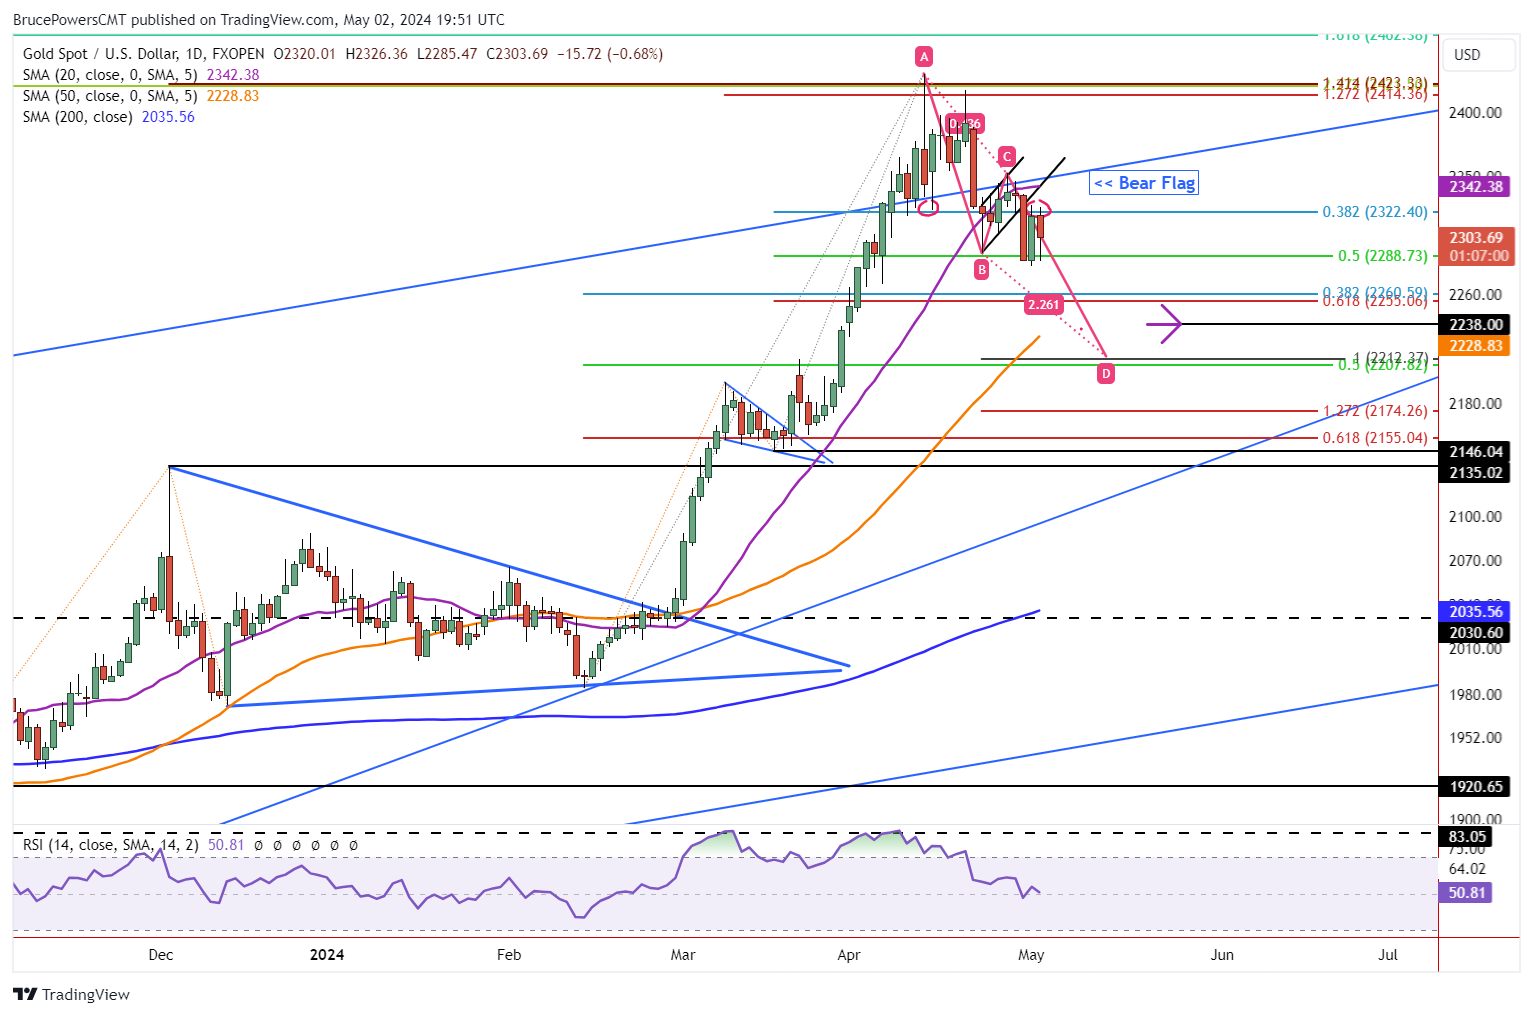
Signs of Weakening as Previous Support Becomes Resistance
Similar behavior was seen recently around the top trendline and 20-Day MA. Each previously represented a support zone. Following the sharp selloff on April 22 that dropped gold below the top trendline, it was tested as resistance. Once the 20-Day MA failed as support it was subsequently successfully tested as resistance. Combined with the breakdown of a bear flag on Tuesday, gold looks to be telegraphing a deeper retracement. And the bear wedge just triggered, so it remains in the early stage of another leg down. Nevertheless, a decisive advance above this week’s high of 2,347 would negate the bear flag.
Several Lower Targets
Following a drop below this week’s low of 2,282 gold will likely first be heading towards a small Fibonacci confluence zone from 2,260 to 2,255. If it keeps falling the minimum 2,238 target from the bear flag comes into view. Now that the 50-Day MA has risen a bit above the next lower target zone, it falls close to the flag target at 2,229. A little lower is a 2,212 to 2,208 price zone consisting of the initial target from the descending ABCD pattern and the 50% retracement of the swing started from the February low, respectively.
April Low at Risk
Of note is last month’s low of 2,228. It is significant since it was a monthly low. A drop below it is bearish by itself, but the implications would depend on what happens next. Does gold continue to fall to test lower price zones? If it does, the speed of recovery of the 2,228 will be telling.
Read Full Story »»»
DiscoverGold
Gold Bear Flag Breakdown Points to Lower Prices
By: Bruce Powers | April 30, 2024
• Gold broke down from a bear flag pattern, signaling a potential further decline towards key support levels around 2,212 to 2,238, including the 50-Day MA.
Gold breaks down from a bear flag on Tuesday with a drop below Monday’s low of 2,320. The decline may see a repeat of the drop that followed the 2,431-record high. It was followed by a decline to a low of 2,291, essentially reaching the 50% retracement. A measured move of the second decline, from the top of the flag, matches the first decline (purple arrows) at 2,212.
This is the same as a falling ABCD where the pattern is identifying symmetry between swings. The 2,212-price level is within a price range from 2,218 (50-Day MA) to 2,208 (50% retracement). Since the 20-Day MA has been busted, the 50-Day line becomes an obvious eventual lower target.
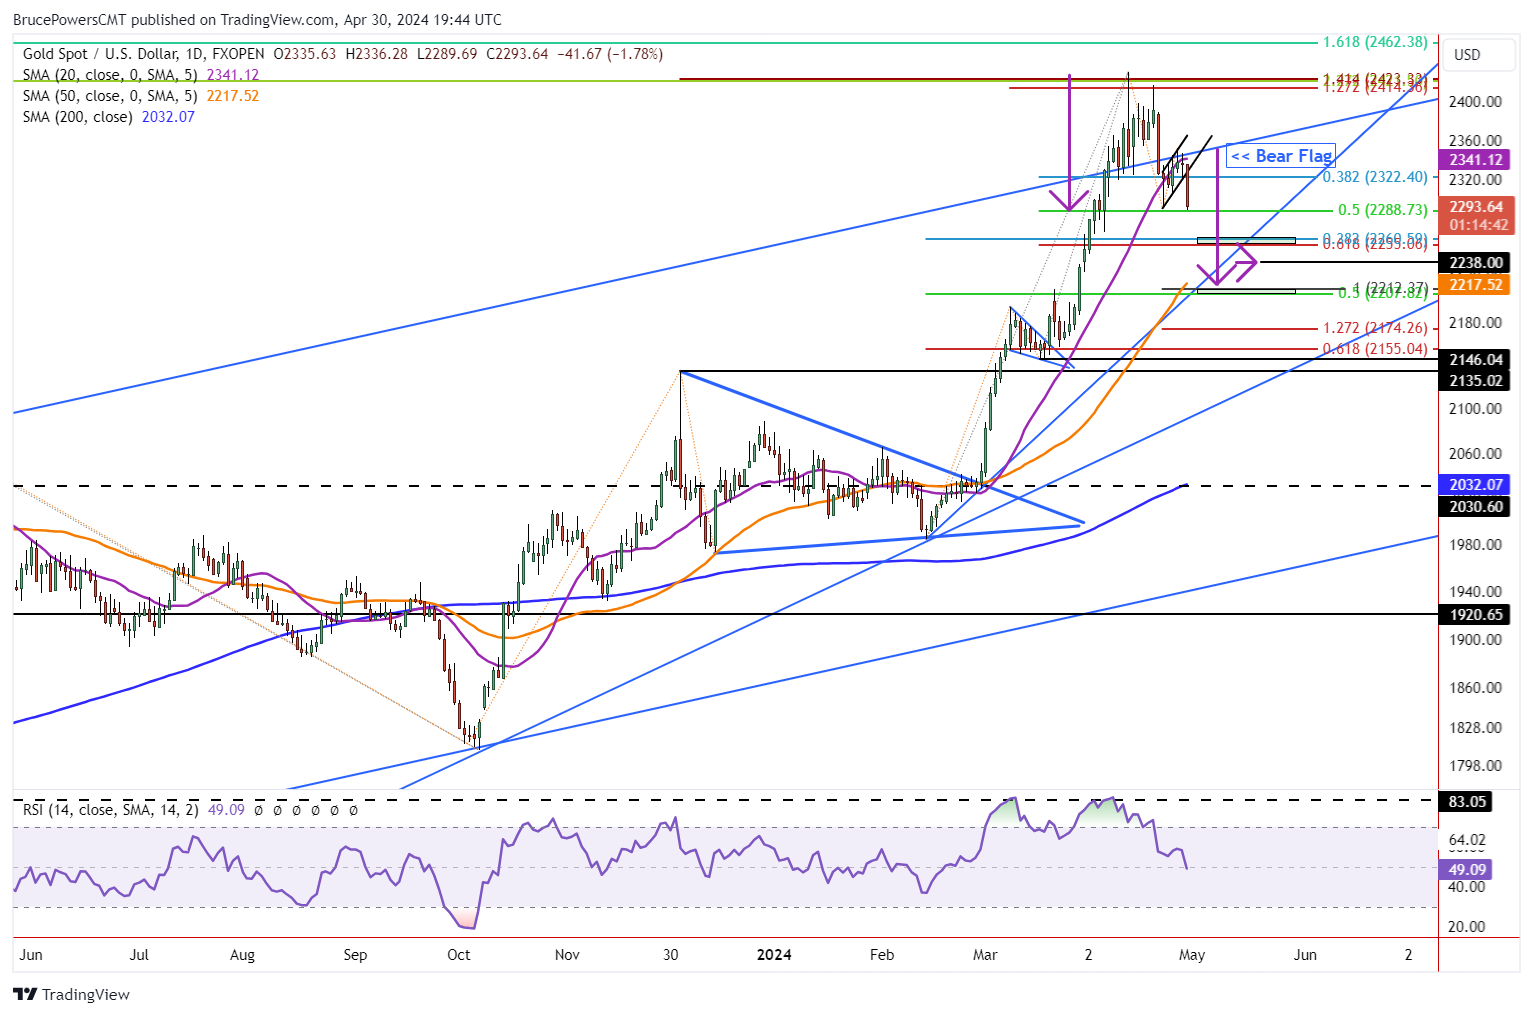
Bear Flag Measuring Objective
Measuring the bear flag provides a slightly different target that is a little higher than the 50-Day line. If the flagpole is measured from the daily breakdown of the April 19 low of 2,373 to the recent retracement low of 2,291, a potential target of 2,238 is calculated. Given the clarity expressed by today’s selling (wide range red candle with trading continuing near the range lows) it seems that the chance of meeting the flag target becomes more likely. Selling doesn’t happen in one day and there is some similarity between today’s wide range day and the first on April 12, and the second on April 22.
Interim Target
Nevertheless, the next potential support zone is around 2,261 to 2,255, consisting of two Fibonacci levels. Also, an internal uptrend line is close to the price zone depending on when it is reached. It provides an added indication on the way down.
Regardless of the potential support levels on the way down, given the large rising parallel trend channel in gold, the lower internal uptrend line could also be reached. We will be watching for clues on the way down. As of now, the price zone around the 50-Day MA is the deepest anticipated retracement.
Weekly Bearish Signal
Last week’s low and the next support level, although minor, is 2,291. A drop below that level will trigger a bearish continuation on a weekly basis thereby further supporting the likelihood of lower prices. Gold had a strong run and long-term bullish breakout. It is coming off a 22.5% sharp rally in only 41 days. A deeper retracement is healthy for the market and will better establish support in preparation of the next rally.
Read Full Story »»»
DiscoverGold
Gold Struggles Amid Technical Challenges
By: Bruce Powers | April 29, 2024
• Bearish flag forms, increasing retracement risk. Drop below 2,320 triggers breakdown.
Not much of a change for gold on Monday as it continues to attempt to advance from the 2,291-swing low hit last Tuesday. Although it is on track to close in the top quarter of the day’s range with a bullish hammer candlestick pattern it remains stuck around the 20-Day MA and a top rising trend channel line. Since the low last Tuesday, it has managed to complete a 38.2% Fibonacci retracement but not much higher. Together, these are some of the technical factors that continue to weigh on the price of gold.
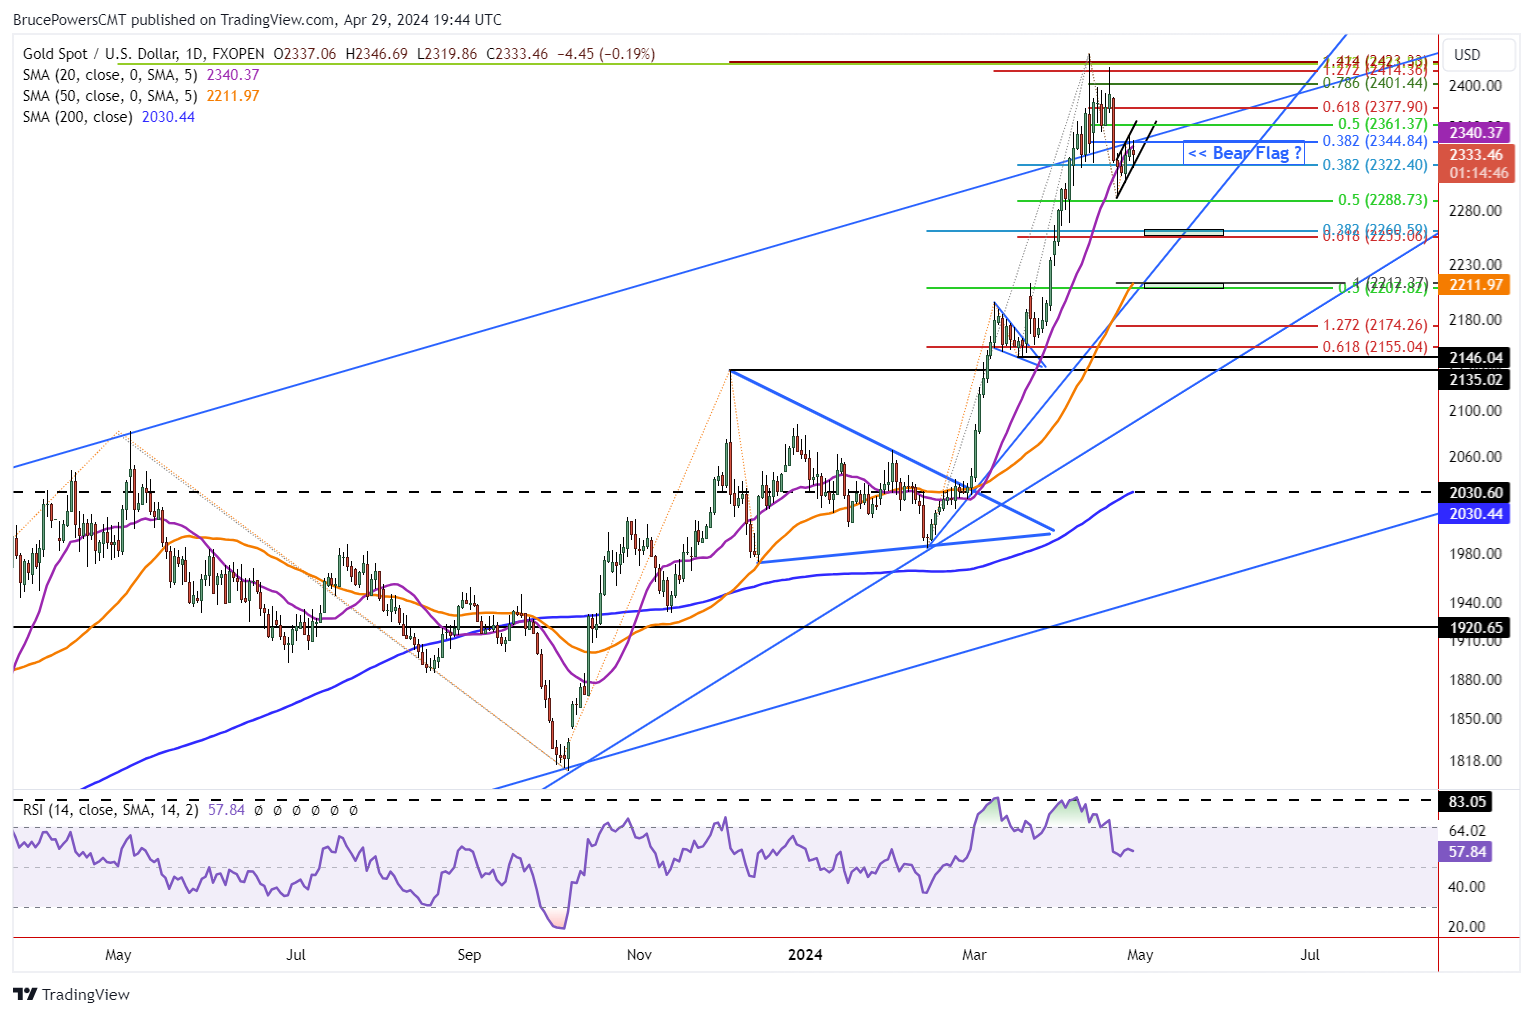
Downward Pressure Remains
The longer gold attempts and fails to rally, the greater the chance for a retracement lower. There is now a clear bear flag that has formed on the daily chart for gold. Today’s low of 2,320 provides confirmation of the lower parallel line of the pattern. A decisive breakdown from today’s low triggers the bearish pattern. If it occurs the 2,291-swing low will be at risk of being broken as the next lower support zone is around 2,261 to 2,255, derived from two Fibonacci levels.
Further down is the target from the bear flag. It comes in around 2,238, which is below the 2,255-price zone but above the next lower price zone from 2,212 to 2,208. Notice that both an uptrend line and 50-Day MA are included in that lower price zone. The 50-Day line matches the top of the zone. If the 20-Day MA is broken to the downside the chance of reaching the 50-Day increases.
Downside Risk Remains if Higher Prices Stay Within Flag Boundary
Regardless of the potential for a deeper retracement, the possibility for an upside continuation remains. A decisive breakout above Friday’s high of 2,352 would be needed for bullish signs followed by a daily close above that price level. If this bullish scenario unfolds, keep in mind that higher prices that trade inside the rising parallel bull flag, remain within the flag.
The flag may expand yet remain bearish if trading continues inside the two rising parallel lines of the flag. A daily close above the top flag channel line would be needed for a clear bullish continuation signal.
Read Full Story »»»
DiscoverGold
Gold Continues to See Supportive Action
By: Christopher Lewis | April 29, 2024
• Gold continues to see a lot of volatility, but in the end, it sees more support than anything else. This is a market that should be approached with a bit of caution as far as position size is concerned.
Gold Markets Technical Analysis
Gold has initially fallen overnight during the off hours on Monday, but at this point in time, it does look like it is trying to do everything it can to recover and perhaps take off to the upside. In general, this is a market that I think will be very noisy but bullish underneath.
The $2,300 level is likely to be an area of significant support and I do think a lot of people will be paying close attention to it. If we were to break down below the $2,300 level, then the 50 day EMA comes into the picture. The market has been strong for some time, and I just don’t see how it will change anytime soon, especially considering there are so many concerns out there.
Nonetheless, I like this market. I like buying short term pullbacks, and those pullbacks should continue to attract a lot of inflows. The $2,400 level above is a major resistance barrier, and I think at this point we might be trying to come into a $100 consolidation area working off some of the froth from the massive shot higher. I have no interest in shorting gold because I think gold is far too strong and there are far too many concerns out there that could make gold go higher, and as a result you have to think of dips in this market as an opportunity to pick up the possibility of “cheap gold.” This is the way the market has been trading for some time, and it should continue to do so unless we see some kind of major change in attitude and fundamentals.
Read Full Story »»»
DiscoverGold
Making all hedge funds primary dealers of UST, now we know why that is…..boj would have to sell ust to intervene like they say. I’d much rather they do something with gold than to go cbdc.
Aris Mining Corp - Chart Review, 1.4 million
The trading in Aris has been a thing of beauty, today was no different. Combined volume in Canada and USA today was 1.4 million shares. It appears to me that institutions are dueling each other to accumulate the stock.
ARIS.TO Short Term
https://stockcharts.com/h-sc/ui?s=ARIS.TO&p=D&yr=1&mn=0&dy=0&id=p59790594190&a=1260483926&listNum=1
ARIS.TO Long Term
https://stockcharts.com/h-sc/ui?s=ARIS.TO&p=W&yr=4&mn=0&dy=0&id=p46278488149&a=1326772940&listNum=1
US Ticker ARMN
https://stockcharts.com/h-sc/ui?s=ARMN&p=W&yr=4&mn=6&dy=0&id=p99407663878&a=1651391510&listNum=1
No, its actually just begun, by the time anyone who doesn't understand or believes what is going to happen or just says its too late, it will be multiples above where it is now.
https://www.msn.com/en-us/money/markets/powell-warns-us-is-on-an-unsustainable-fiscal-path/ss-AA1nOnpt?ocid=msedgdhp&pc=U531&cvid=d27e35bcda2341828e91f3caecfa7d66&ei=11
He and the dummies in gov are the ones who put us here, all roads now lead to gold, its the only way out.
Is it too late to invest in the gold rush?
By: Financial Times | April 26, 2024
• Demand from China drove prices to a record high this month — now many suspect the normal rules no longer apply
On the High Street in Hungerford, a historic market town about an hour west of Reading, is Nigel Montgomery’s stamp and coin shop.
He has traded precious metals for about 50 years, but has never seen a gold rush like this: the price of a troy ounce, the unit used to weigh precious metals that dates to the Middle Ages, hit an all-time high this month, above $2,400.
“We’ve never seen so much retail demand as we are seeing at the moment,” says the 67-year-old. “I’ve been through various gold and silver booms since the 1970s — we’re seeing a more sustained, stronger and genuine rally.”
Investors have snapped up tax-free capital gains in gold sovereign and Britannia coins to hedge their portfolios against inflation and any escalation of conflict in the Middle East. So much so that Montgomery is continuously having to replenish his stock.
But the origins of this gold rush are thousands of miles from Montgomery’s town — and far from the historic global trading centres of London, Zurich and New York — in Beijing and Shanghai.
The People’s Bank of China led record gold purchases by central banks in 2022 and 2023, collectively buying above 1,000 tonnes each year, as emerging markets sought to diversify their reserve holdings away from the US dollar, which was weaponised by Washington in sanctions against Russia after its invasion of Ukraine.
Chinese retail investors have amassed gold as other investments from property to local equities turn sour. Chinese hedge funds and other speculators have also piled in.
“This rally has Chinese characteristics written all over it,” says John Reade, chief market strategist at the World Gold Council, an industry lobby group. “Everything leads back to different actors in China.”
While punters in Hungerford and at Costco stores across the US go gaga for gold, the western investor has, by and large, sat on the sidelines of gold’s latest rally. Gold-backed exchange traded funds (ETFs) have continued to experience monthly outflows, while bar and coin demand has been abysmal in Germany, typically the world’s third-largest market.
Andreas Habluetzel, chief executive of Degussa Goldhandel, Europe’s largest gold dealer, which owns London’s Sharps Pixley, says the cost of living crisis and stubborn inflation is driving customers to sell.
“We all want to keep the same lifestyle: sending your kids to good schools and owning two cars. When we talk to the middle-income people they are liquidating as they need money,” he says.
That creates a dilemma for the western armchair investor. Gold has rallied some $600 per troy ounce since conflict erupted between Israel and Hamas in October, yet the staggering rise is widely seen by analysts as disproportionate to the gold price’s usual drivers: real rates on US Treasuries, the dollar and ETF flows.
“This is not the behaviour of gold. It’s more or less the behaviour of crypto,” says Habluetzel.
When the asset is so volatile, should investors rely on it as a haven asset? And if the market’s centre of gravity is shifting to a set of investors in China with a fundamentally different set of concerns to your own, should you bank on backing bullion?
From a tactical perspective, gold’s sharp rise could make it poised for a sharp correction, having already fallen about $50 this week, making it a dangerous entry point.
But others argue gold has a cohort of buyers waiting in the wings for any dips to pile into gold — including western ETF investors that have not participated yet. Deutsche Bank analyst Michael Hsueh says that it is likely that “any profit-taking by early investors would be replaced by investment from those who have so far not participated in the move”.
Looking further out, the question for investors is whether they believe the global monetary system is at the early innings of sweeping transformation. That might be a new era of persistent inflation that erodes the purchasing power of fiat currencies and great power competition that increases gold’s share of reserve assets at the US dollar’s expense.
Max Belmont, portfolio manager of the Gold strategy at First Eagle Investments, an asset manager, says that gold is “sniffing out” mounting concerns over the sustainability of global debt levels.
US debt increases by about $1tn every 100 days or so with interest rates at their current levels, while investors fear Europe could struggle to manage debt levels if Donald Trump enters the White House and pushes for Nato defence spending to rise. The IMF warned this month that the US, China, Italy and the UK “critically need to take policy action” on debt. Neither US presidential candidate shows much sign of wanting to rein in spending.
Nicky Shiels, precious metals analyst at MKS Pamp, a Swiss refinery and trader, says surging gold prices anticipate a “big regime change the west is going through”, from erosion of US dollar purchasing power, higher-for-longer inflation and a multipolar world.
When it comes to US debt, she says the market has grown increasingly convinced that the Fed may cut interest rates even if inflation roars higher in order to reduce the interest payments that the US government is servicing (the Fed is independent of the Treasury).
“This is it: two decades of easing monetary policy coming to a head,” she says.
On the other hand, emerging market central banks and sovereign wealth led by China, Russia and the Middle East are buying gold after the US sanctioned billions of dollars of Moscow’s reserves held in US bonds.

“It’s the dollar losing utility as an asset to store trade surpluses,” says John Hathaway, managing partner of Sprott Inc, a Canadian asset manager specialising in metals. Gold has traditionally tracked real rates of US Treasuries but he adds that “the Fed’s policies may not matter anymore to gold prices” given the new club of buyer’s motivations.
And Chinese investors are taking cues from their own central banks’ purchases. “An awful lot of private wealth is going to be running into gold as there’s nothing else to buy: property sucks, equities lose you money, cash in the bank is paying nothing and they can’t get the money offshore,” says Adrian Ash, director of research at BullionVault, an online gold marketplace.
But others say geopolitical risks, the dollar’s demise and debt concerns are over-egged.
“The world is not nearly as risky as [in] 1980,” says James Steel, chief precious metals analyst at HSBC, when gold hit its inflation-adjusted record high well above $3,000 per troy ounce.
For retail investors concerned that they missed riding the wave of frothy gold prices, one option could be gold mining equities.
Valuations of the world’s gold producers, led by Newmont and Barrick Gold, have rarely been as heavily discounted in the past 40 years versus the gold price as they are now, according to asset manager Schroders. That has made the gold mining sector’s collective valuation at roughly $300bn no bigger than Home Depot, the US DIY retailer.
The theory is that lofty gold prices will feed through to higher margins when gold producers next report earnings, sending share prices shooting up.
“It’s a different risk-reward. If gold prices double then you should get a bigger increase in your margin,” says Robert Crayfourd, who manages the Golden Prospect Precious Metals fund at CQS, an asset manager.
Jim Luke, fund manager at Schroders, wrote in a recent note that “dismal western sentiment” on gold and poor operational delivery by the sector’s leading companies were behind the low valuations.
“It is not hyperbole to say the sector could rally 50 per cent and still look inexpensive,” he says.

Gold mining equities face structural challenges from their ESG credentials, as they play little role in the energy transition, rising political risk in cash-strapped developing nations from Mali to Mexico and declining reserves.
More troubling, however, is that this gold rally has been driven by the Chinese central bank, retail investors, asset managers and funds for whom western gold mining equities hold little appeal.
Investors have been deterred by the sector’s inability to tame cost inflation from vital inputs such as fuel, explosives and cyanide in the past couple of years and overspending during previous booms. Fund managers want to see proof that margins will march higher.
John McCluskey, chief executive of Alamos Gold, a mid-sized Canadian gold producer, says that the tech-led run for equity markets, with the Dow Jones breaking above 38,000, makes it hard to call when gold producers will get a look in.
“‘The party is going full tilt. I think I’ll go home to check the gas is on’ — you’re not going to do that now. ‘I’ll stick it out and put it in these gold funds that haven’t performed well for 10 years’ — you don’t do that,” he says. But, he adds: “When they see the margins then they will buy those equities.”
Jason Todt calls himself one of the new breed of “retired gold bugs” who are partying hard.
After the global financial crisis, the manager of a car dealership in Missouri spent $100,000 from a property sale on gold. Had the 47-year-old held on to all of his bullion until now, it would be worth $120,000. Instead, Todt earned $1.5mn by selling $65,000 of his gold hoard in 2017 to buy bitcoin and other assets, enabling him to retire early in 2020, meet his Ukrainian wife and travel the world in a sailboat.
“It has taken seven years to get a 100 per cent return on gold when you can do that in bitcoin in a year,” he says.
Jason Todt and his wife Evgenia Grydnieva on their sailboat, moored in Gulfport, Mississippi © Bryan Tarnowski/FT
Todt’s situation highlights the pull for many investors of potential mega-returns through cryptocurrencies, AI and tech stocks over the pursuit of wealth preservation.
Laith Khalaf, head of investment analysis at AJ Bell, warns that even for those trying to cling on to their wealth, gold often fails to fulfil its “safe haven” reputation because it is volatile and trades sideways or downwards for long periods of time.
“It shouldn’t be a big part of your portfolio,” he says. “No more than 5 per cent.”
But the wealthy of the world appear to disagree. US funds, family offices and asset managers are increasing gold’s allocation within their portfolios to 10-15 per cent, up from 5-7 per cent, says Habluetzel of Degussa.
That is underpinned by gold’s long-run ability to preserve wealth — if bought at the right time. Since 1970, when US President Richard Nixon untethered the dollar from gold, bullion has produced an average return of just below 8 per cent a year, says Peter Clark, a retired fund manager.
For Montgomery in Hungerford, gold is a must-have insurance policy for investors to protect themselves against an end to the equity and crypto mania.
“If we had world peace and a more stable economy, gold would be steady or go down,” he says. “But the world isn’t a stable place. People have had a really good run on the stock markets and property prices have kept going up. What’s left? It’s gold.”
Read Full Story »»»
DiscoverGold
Gold Falters, Treads Water
By: Mark Mead Baillie | April 28, 2024
Per a tongue-in-cheek note this past week to our StateSide Investors’ Roundtable, we apologized for single-handedly having “crashed” the precious metals’ markets with last Saturday’s missive (“Gold Fit to Pull Back a Bit”) following which on Monday — directly out of the chute — the yellow metal suffered its third-worst intraday high-to-low loss (-2.7% or -$62/oz.) in better than 14 months…
Too, Sweet Sister Silver’s simultaneous stint saw a -5.7% slam. Damn!
We nonetheless plead innocent for merely going with the math, a valued leading science which few anymore seem to do. For recently we’d written ad nauseum: “…near-term Gold is very over-extended; but broad-term Gold remains very undervalued…” And for you WestPalmBeachers down there, “near-term” plays out prior to “broad-term”, the former being exactly what Gold is now enduring, (i.e. ’tis going down). Or for those you scoring at home: mere math + historical repetition = leading knowledge. Hardly the “holy grail”, but given prudent cash management, ’tis on balance beneficial to one’s trading account. “Try it, you’ll like it!” –[Alka-Selzer, ’72].
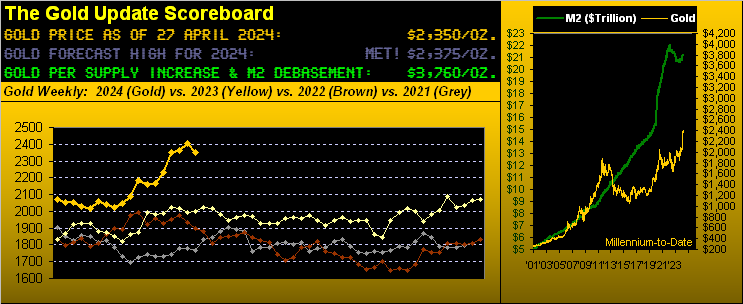
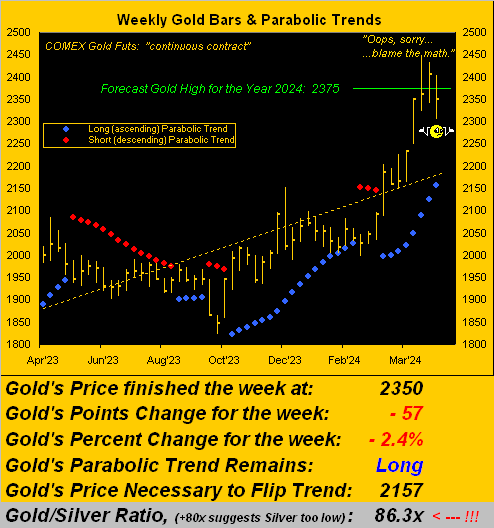
Oh to be sure, Gold through just the first third of this year has already achieved our forecast high of 2375, indeed reaching up to 2449, albeit price settled yesterday (Friday) below both of those levels at 2350. And whilst we’re on record to not upwardly re-forecast a revised target, we’d be surprised should Gold not trade higher still as the year unfolds, even if the Federal Reserve raises rates. ‘Course, you regular readers know we’ve be musing since the start of this year over the Fed actually needing to again raise rates, contra to the non-math parroting crowd’s having called for as many as three rate cuts during 2024, (such expectations having lately been reduced to just one cut toward the end of the year).
But even should the Fed dutifully raise, such move — as we’ve in the past shown — wouldn’t automatically deter Gold from moving higher. Recall the three-year stint from 2004 through 2006: the FedFundsRate rose 425 basis points … and Gold rose +69%.
Thus whilst Gold is positioned just fine (thank you very much), when it comes to the stock market, it seems as if we’re in a constant state of hand-holding. On days when the S&P 500 rises +1%, FinMedia responses range from neutral to happy. But toss in a -1% down day, and many-a-headline goes catastrophic:
• “Markets Roiled by FedSpeak!”
• “Markets Plunge on Powell!”
• “Markets Tumble on Earnings Trouble!”
Good grief. The telling optics are that the FinMedia folks today have no concept of “Roiled”, “Plunge” nor “Tumble”. They weren’t around in ’87, ’02, ’09, et alia. Reprise The Temptations from ’66: “Get Ready”.
And although we’re not predicting what would be a third -50% “correction” in just this century for the S&P, by math (oh-no, say it ain’t so) the setup is sitting there:
• Neither earnings nor yield are supportive of price;
• Twice as much money is invested in the S&P than exists (by “M2”); and
• Risk-free dough pays triple the S&P’s yield.
Back in “our day”, a stock was purchased to benefit from a methodically rising price based on earnings generation — plus for high-quality companies — a dividend yield. Today, stocks are purchased on expectations of their quickly quadrupling. ‘Tis why we regularly term this “The Investing Age of Stoopid”. Have a nice day.
Meanwhile, although April has been a losing month for the S&P, ’tis been a good month for Gold, as you know price having reached an All-Time High of 2449 (at precisely 07:15 GMT on the 9th). And with but two trading days remaining in April, ’tis close enough to month-end to bring up our BEGOS Markets Standings essentially through this year’s first quadrimestris. Therein, red-hot metal Copper –which a month ago had been sixth in this stack — is now leading the pack (a sign of continued inflation expectations), having even surpassed Oil, with Gold still on the podium scantly ahead of what is undoubtedly a pouting Sister Silver, just one-tenth of a percent behind in fourth:

Too, from the “Gold Plays No Currency Favourites Dept.” note that despite the Dollar Index being +4.9%, Gold nonetheless is +13.4%. (Just because “That can’t happen”, ’tis).
And as Gold indeed is “What’s Happenin’!”, let’s go to the weekly bars from one year ago-to-date, wherein we see the blue-dotted parabolic Long trend now eight weeks in duration. Moreover, in spite of last Monday’s price falter, Gold has since tread water by closing well off the week’s low (2304) per the closing nub (2350) on the rightmost bar:
Here comes the however: the near-term “math” suggests we’ll see lower levels still. For instance, we’ve the following two-panel display. On the left is a graphic with which by now you’ve become quite familiar: ’tis our BEGOS Markets near-term valuation (smooth line) for Gold based on its price movements relative to the other four primary BEGOS components (Bond, Euro, Oil, S&P). And at present per the lower left section, price is still better than +100 points above valuation. On the right we’ve Gold’s daily “candles” for the past 21 trading days (one month) wherein we find the parabolics having flipped to Short (per the red-encircled dot of last Monday). Such flip was anticipated in last week’s missive — (“Too from the technical tent, Gold…is approaching a flip of the daily parabolic measure from Long to Short”) — and so it came to pass:
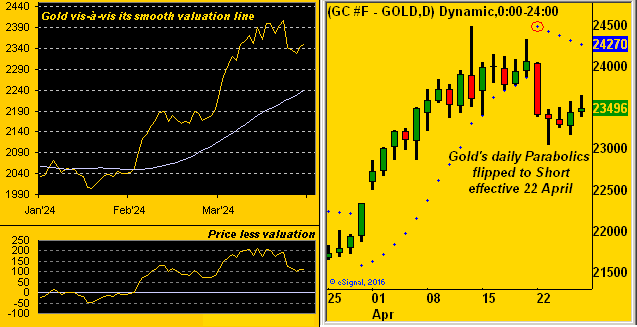
In terms of how far further Gold may fold from here, the 2247-2171 zone appears structurally supportive, (i.e. a drop from here of another -100 points wouldn’t be untoward). And that technically trues up nicely per the above graphic wherein price is just over +100 points above valuation. See how easy this is? (Hopefully we’re wrong and Gold simply zooms back up the road).
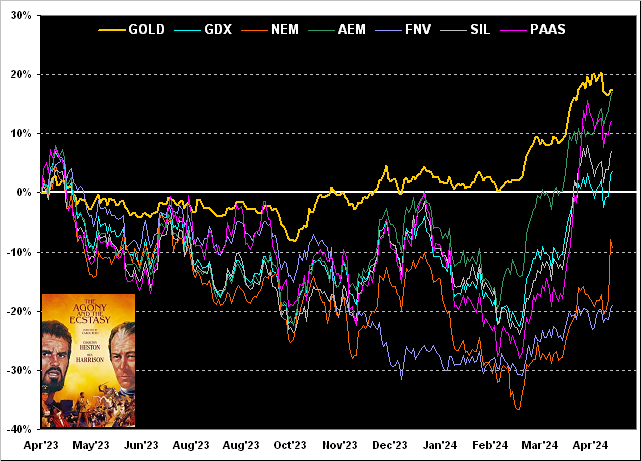
Meanwhile: “How ’bout ‘dem miners!” Long overdue to get on the move, so have they been doing of late, albeit they too shall deflate should Gold near-term further slip from “Great!”. Indeed here’s our usual month-end chart of Gold’s year-over-year daily percentage track along with those of its key equities brethren. From worst-to-first we’ve: Franco-Nevada (FNV) -19%, Newmont (NEM) -9% (but sporting a very robust, earnings-induced up move this past week), the VanEck Vectors Gold Miners exchange-traded fund (GDX) +4%, the Global X Silver Miners exchange-traded fund (SIL) +7%, Pan American Silver (PAAS) +12%, Agnico Eagle Mines (AEM) +17%, and Gold itself +18%. As we go to the graphic, let us — for the equities — appropriately cue “The Agony and the Ecstasy”, –[Heston, Harrison, 20th Century Fox, ’65]:
Next we go ’round the horn across the past 21 trading days for all eight BEGOS components. The “Baby Blues” therein reflect the day-to-day consistency of each market’s respective grey trendline. And as noted in yesterday’s Prescient Commentary, there’s the old adage “Follow the Blues instead of the news, else lose your shoes”, which specific below to both Gold and Silver is yet another technical case for further price fallout near-term. But does that in turn mean we buy the Euro, its dots curling upward? Given the Federal Open Market Committee’s pending “do nothing” Policy Statement and Powell Presser (on Wednesday, 01 May), any “hint” of a rate cut delay (if not outright suggestion of a rate hike), ought only serve to further strengthen the Dollar:
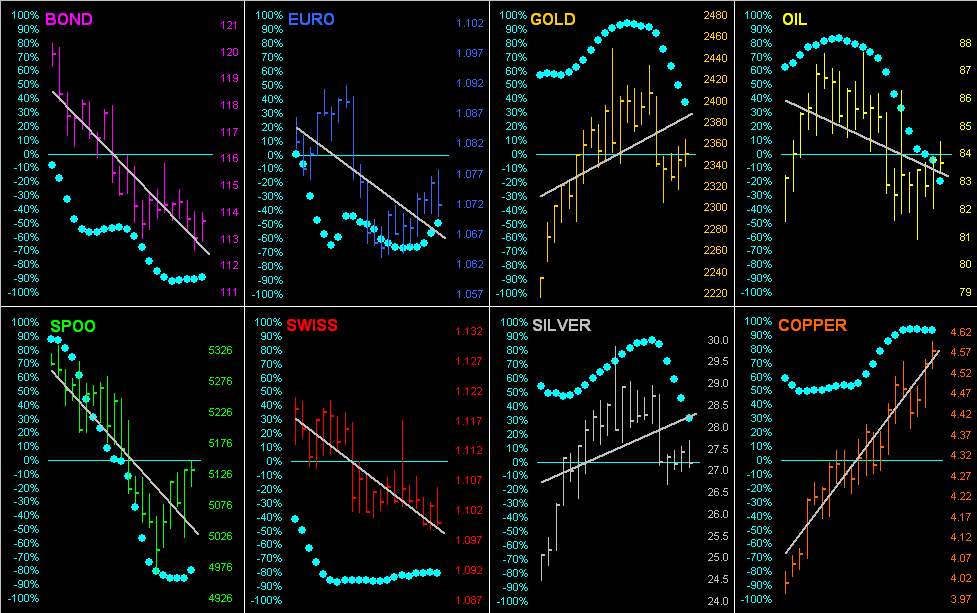
Moving on to the 10-day Market Profiles for the precious metals, we’ve Gold (at left) and Silver (at right). Simply per this construct, there is quite a bit of overhead volume resistance with which to deal. Those prices levels of volume domination are as labeled:
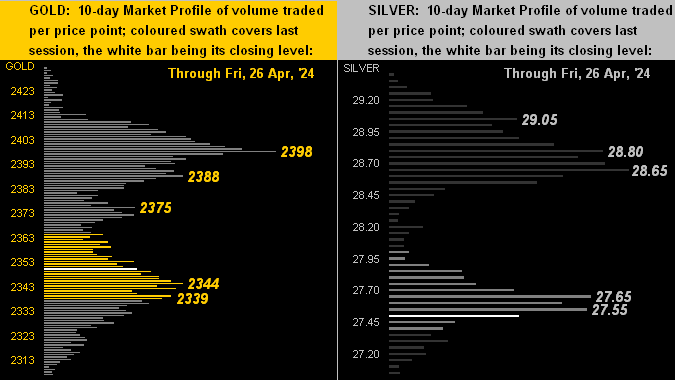
And of course it being month-end (save for two trading days), here we’ve Gold’s structure across the past 16 years. Note the forecast high (2375) having been achieved (and then some), followed by price’s pullback. Still, we’ve added scaling space up toward 2600, just in case, (wink wink, nudge nudge…):
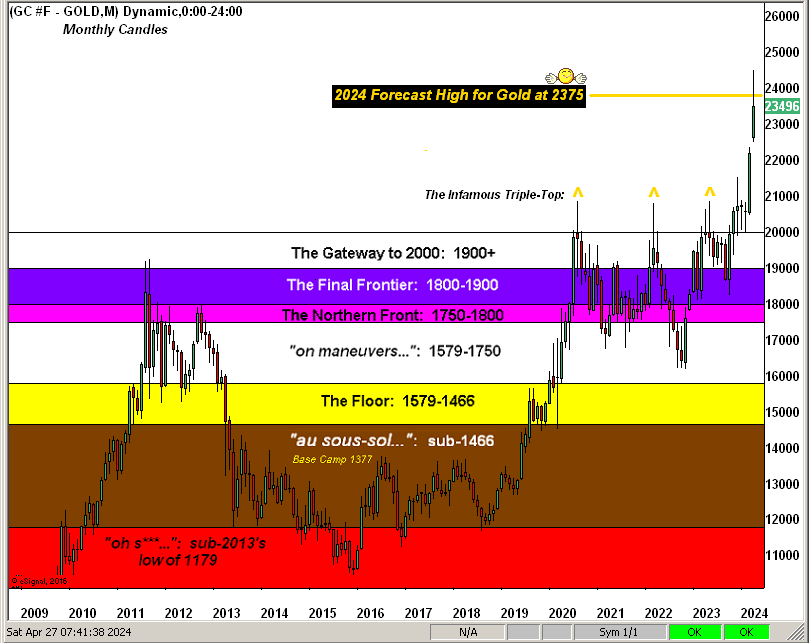
As for the StateSide Economic Barometer, the two most eyed items of the past week were the first peek at Q1 Gross Domestic Product and March’s Personal Consumption Expenditures. First to the GDP: its annualized nominal Q1 growth rate was +4.7% … but … +3.1% of such growth was pure inflation so the … net … real GDP growth was at best a tepid +1.6%. Again, can you state “stagflate“?
Second to the “Fed-favoured” PCE for March: both the headline and core readings maintained their +0.3% February paces, which when annualized comes to +3.6%, (nearly double the Fed’s targeted +2.0%). Can you say “raise“? Nevertheless, March’s Home Sales (both New and Pending) improved, as did Personal Income and Durable Orders, the Baro in turn getting a boost:
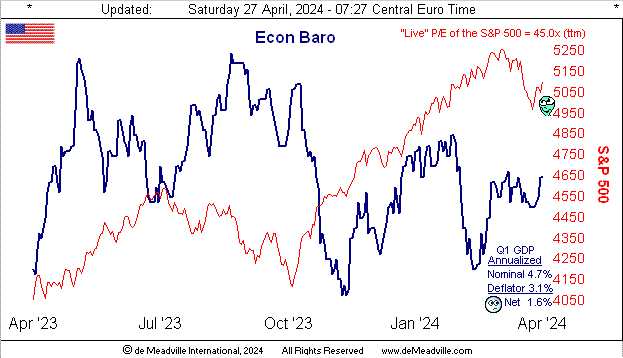
Notwithstanding our ever-ongoing aforementioned misgivings about the terrifically overvalued stock market as measured by the S&P (aka “Casino”) 500, note in the Baro the “live” price/earnings ratio is now 45.0x (by trailing twelve months) which as we near the half-way mark of Q1 Earnings Season hasn’t — on a cap-weighted basis — declined a material wit, (’twas 46.1x at the start of Earnings Season).
Yes, some 64% of S&P constituents have thus far reported year-over-year earnings increases: but that impossibly supports a P/E of such level, indeed nearly double that of a dozen years ago. Also, the “all-risk” Casino’s yield is now 1.413% versus the “no-risk” annualized U.S. three-month T-Bill’s 5.238%. And yet the week was replete with such FinMedia headlines as (hat-tip Bloomy) –> “Magnificent Seven Roar…”, “Big Tech Surges…” and “AI Craze Powers Best Week…” Thus the great game of “Equities Chicken” continues.
Oooh, and we shan’t then close without mentioning this from the “Which Came First? The Chicken or the Egg? Dept.” (Hat-tip NewsMax) –> Engineers from The University of Colorado “Go Buffs!” at Boulder have conclusive research that folks over the age of 65 tend to slow down as it takes more energy to move than it does those younger. Which has us seriously considering a new career in the field of such paid-for research of obvious conclusion.
Either way conclusively, don’t you be a chicken: use our weekly research to buy and hold Gold!
Read Full Story »»»
DiscoverGold
Jack Chan: Gold Price Exclusive Update
By: Jack Chan | April 27, 2024
Our proprietary cycle indicator is UP.
To public readers of our updates, our cycle indicator is one of the most effective timing tool for traders and investors. It is not perfect, because periodically the market can be more volatile and can result in short term whipsaws. But overall, the cycle indicator provides us with a clear direction how we should be speculating.
Investors
Accumulate positions during an up cycle and hold for the long term.
Traders
Enter the market at cycle bottoms and exit at cycle tops for short term profits.
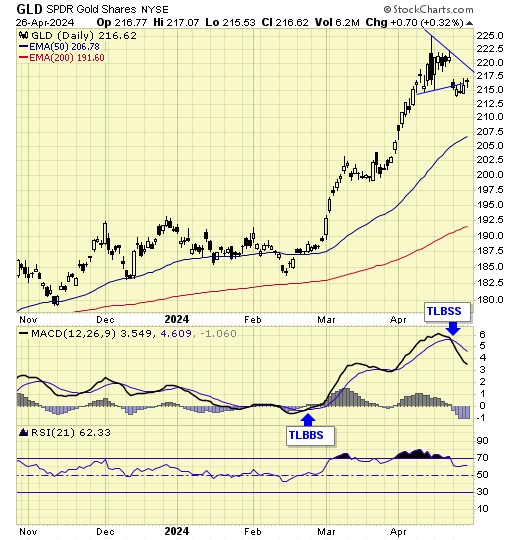
GLD is on short term sell signal.
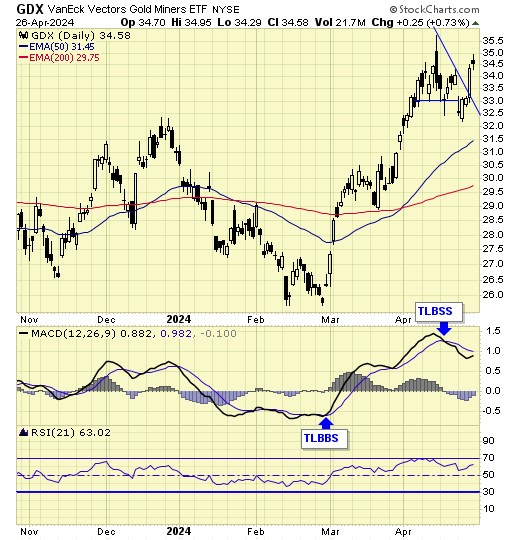
GDX is on short term sell signal.
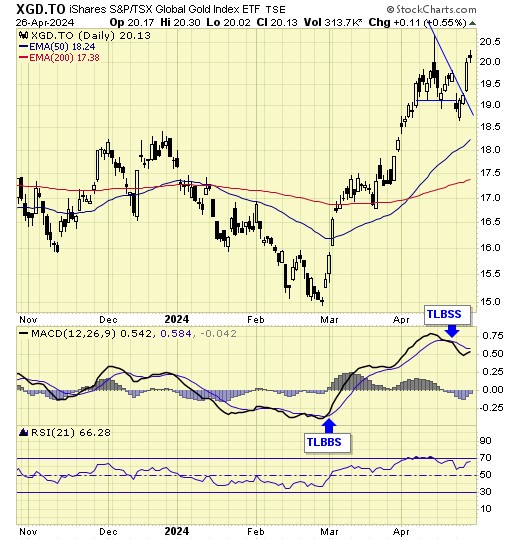
XGD.to is on short term sell signal.
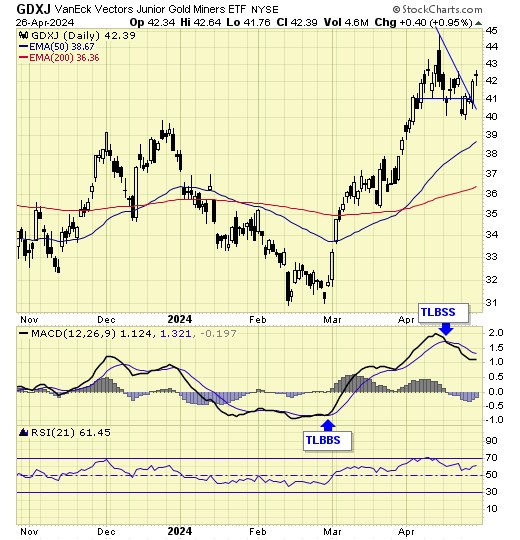
GDXJ is on short term sell signal.
Analysis
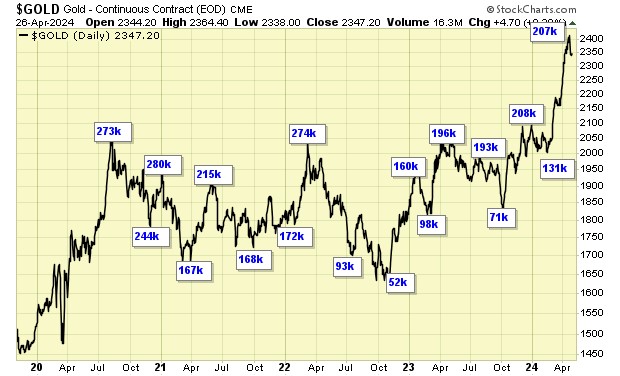
Speculation is now at overbought level.
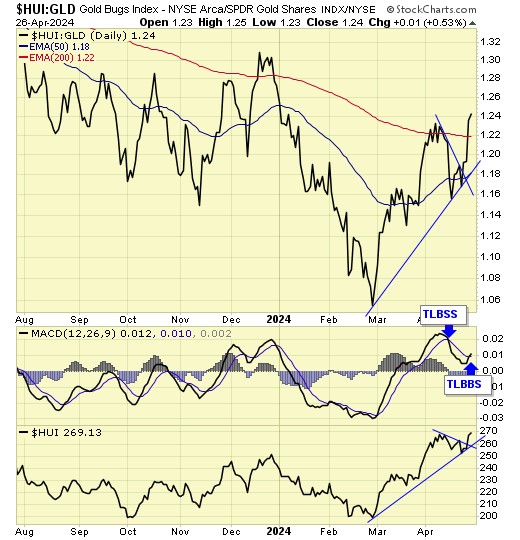
Our ratio is on buy signal.
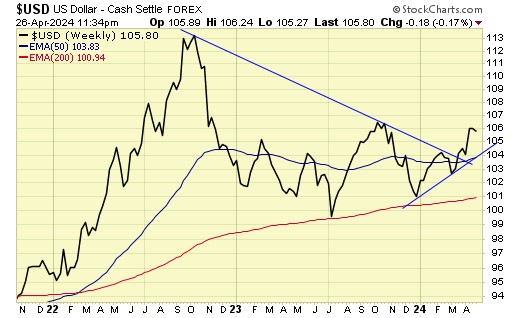
Trend is UP for USD.
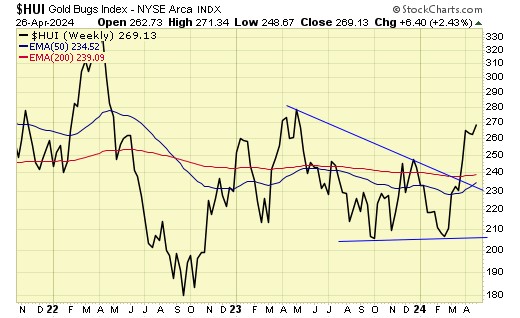
Trend is UP for gold stocks.
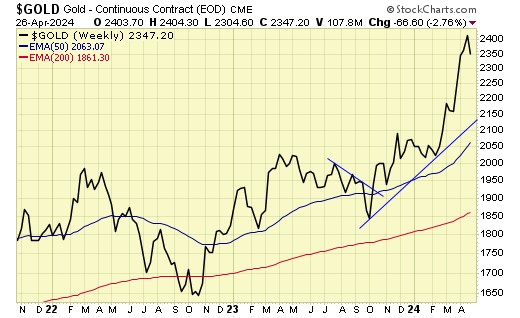
Trend is UP for gold.
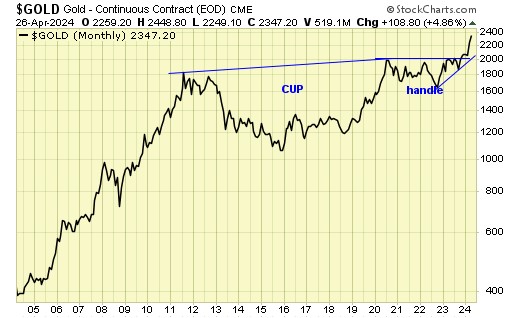
Gold has broken out firmly and has no overhead resistance.
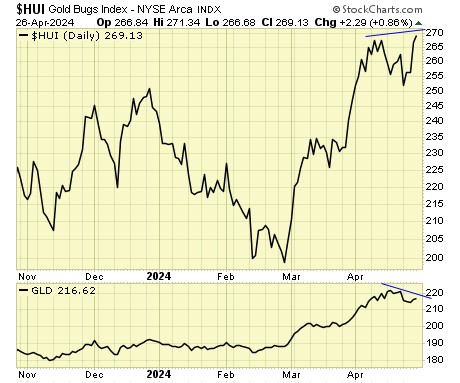
A divergence is in progress.
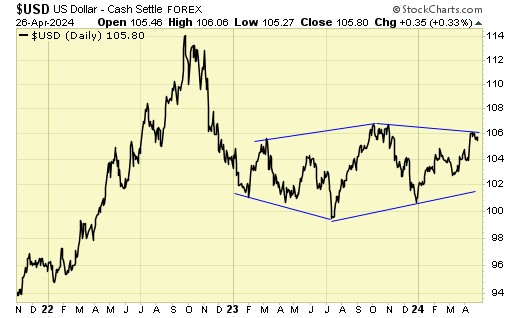
A diamond bottom is a bullish chart pattern.
Summary
Gold sector cycle is up.
Trend is up for gold and gold stocks..
$$$ We were stopped out with a small profit.
Read Full Story »»»
DiscoverGold
NY Gold Futures »» Weekly Summary Analysis
By: Marty Armstrong | April 27, 2024
This market made a new high today after the past 3 trading days. The market opened higher and closed higher. The immediate trading pattern in this market has exceeded the previous session's high intraday reaching 23644. Therefore, this market has rallied over the past 52 trading sessionsNonetheless, the market remains neutral on our system indicators.
This market has not closed above the previous cyclical high of 24488. Obviously, it is pushing against this resistance level.
ECONOMIC CONFIDENCE MODEL CORRELATION
Here in NY Gold Futures, we do find that this particular market has correlated with our Economic Confidence Model in the past. The Last turning point on the ECM cycle low to line up with this market was 2022 and 2015. The Last turning point on the ECM cycle high to line up with this market was 2020 and 2011 and 1996.
MARKET OVERVIEW
NEAR-TERM OUTLOOK
The NY Gold Futures has continued to make new historical highs over the course of the rally from 2015 moving into 2024. However, this last portion of the rally has taken place over 9 years from the last important low formed during 2015. Noticeably, we have elected four Bullish Reversals to date.
This market remains in a positive position on the weekly to yearly levels of our indicating models. Pay attention to the Monthly level for any serious change in long-term trend ahead.
Solely focusing on only the indicating ranges on the Daily level in the NY Gold Futures, this market remains moderately bearish position at this time with the overhead resistance beginning at 23479 and support forming below at 23046. The market is trading closer to the resistance level at this time. An opening above this level in the next session will imply that a bounce is unfolding.
On the weekly level, the last important high was established the week of April 8th at 24488, which was up 8 weeks from the low made back during the week of February 12th. We have seen the market drop sharply for the past week penetrating the previous week's low and it closed lower. We are still trading neutral on the Weekly Momentum Indicators and this is a warning that initial support has been breached. This strongly implies we should pay close attention now to the Weekly Bearish Reversals. If we begin to elect Weekly Bearish Reversals, then we are dealing with a more sustainable near-term correction. When we look deeply into the underlying tone of this immediate market, we see it is currently still in a semi neutral posture despite declining from the previous high at 24488 made 2 weeks ago. Still, this market is within our trading envelope which spans between 16947 and 26879.
INTERMEDIATE-TERM OUTLOOK
YEARLY MOMENTUM MODEL INDICATOR
Our Momentum Models are declining at this time with the previous high made 2020 while the last low formed on 2023. However, this market has rallied in price with the last cyclical high formed on 2023 and thus we have a divergence warning that this market is starting to run out of strength on the upside.
Interestingly, the NY Gold Futures has been in a bullish phase for the past 16 months since the low established back in November 2022.
Critical support still underlies this market at 19860 and a break of that level on a monthly closing basis would warn that a sustainable decline ahead becomes possible. Nevertheless, the market is trading above last month's high showing some strength.
DiscoverGold
Gold CoT: Peek Into Future Through Futures, How Hedge Funds Are Positioned
By: Hedgopia | April 27, 2024
• Following futures positions of non-commercials are as of April 23, 2024.
Gold: Currently net long 202.9k, up 968.
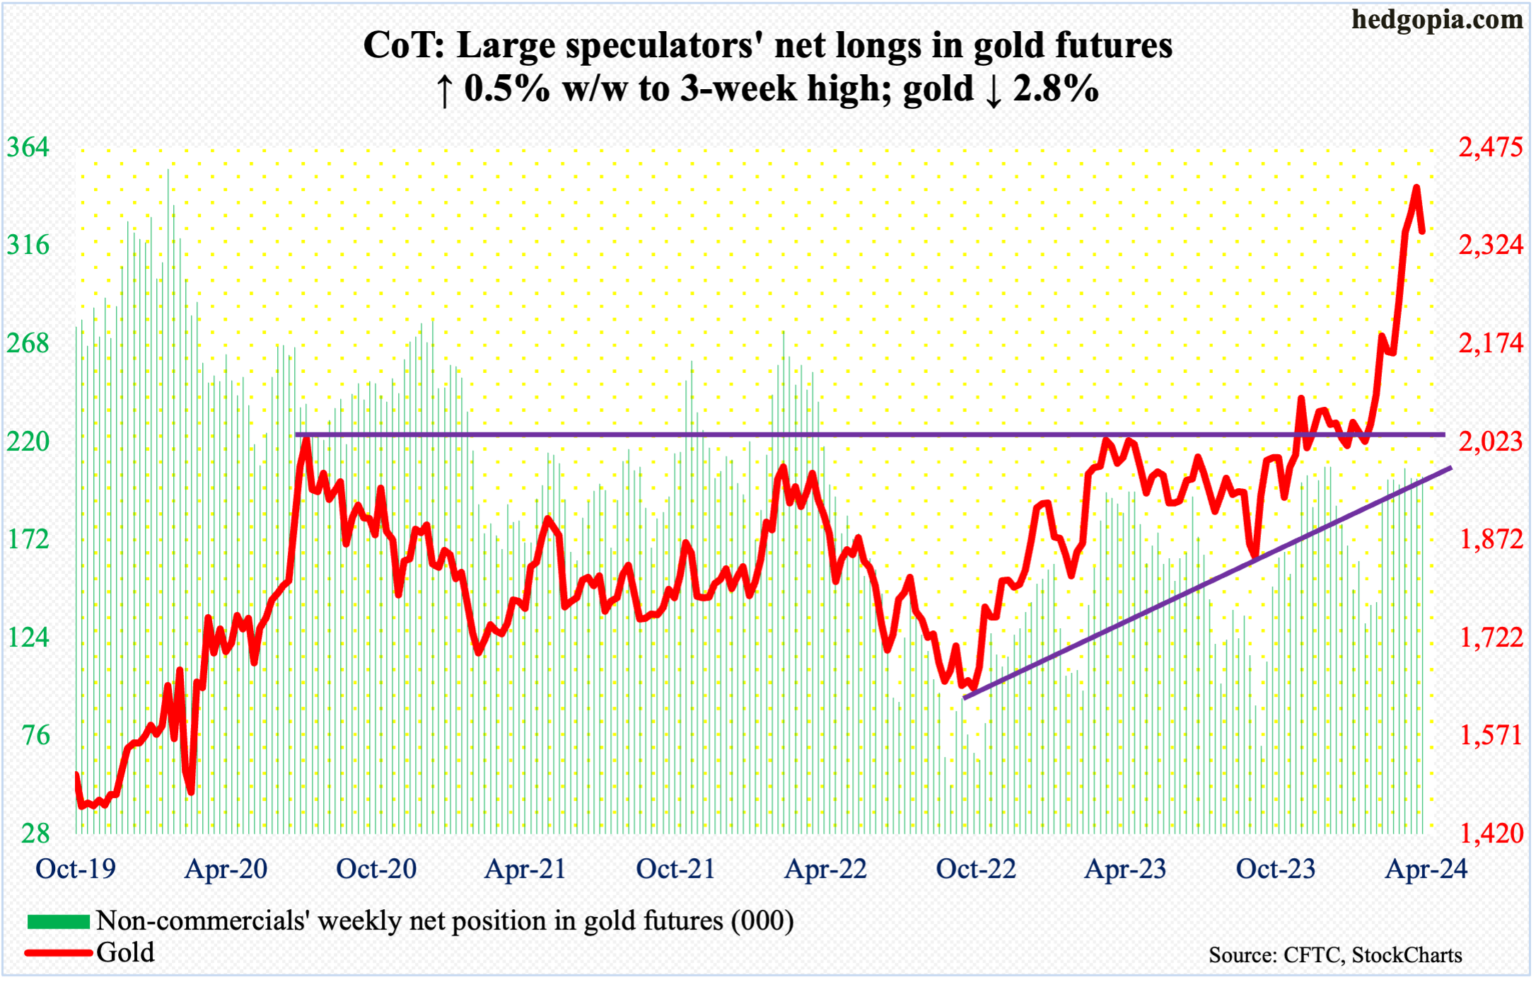
Gold is either healthily digesting its massive gains since last October or is on the way to unwinding the overbought condition it is in.
On the 12th, the metal printed a new intraday high of $2,449 but only to then reverse hard to close the session at $2,361. This preceded a nearly parabolic move higher. Last October, gold bottomed at $1,824 and tagged $2,047 as recently as March 1st.
Since the peak two weeks ago, gold has acted tentative, with this week down 2.8 percent to $2,347/ounce. The weekly particularly is way overbought, and this raises the risk to a move lower toward near-term support at $2,240s. Worse, gold bugs will be forced to defend breakout retest at $2,080s, which the yellow metal broke out of in early March.
Read Full Story »»»
DiscoverGold
Gold Faces Resistance, Risk of Deeper Pullback Looms
By: Bruce Powers | April 26, 2024
• Gold faces resistance at the 8-Day MA, signaling potential for a deeper pullback and bearish behavior.
Although gold has been slowly moving higher the past few days it encountered resistance at the 8-Day MA today with a high of 23,352. The 8-Day line has recently turned down, adding to the risk of a deeper pullback. The 8-Day line was previously an area of support and now it is showing signs of resistance. This is classic bearish behavior as a possible further retracement may be developing. Moreover, notice the relationship with the top channel line. Ire previously represented support but has been successfully tested as resistance over four days.
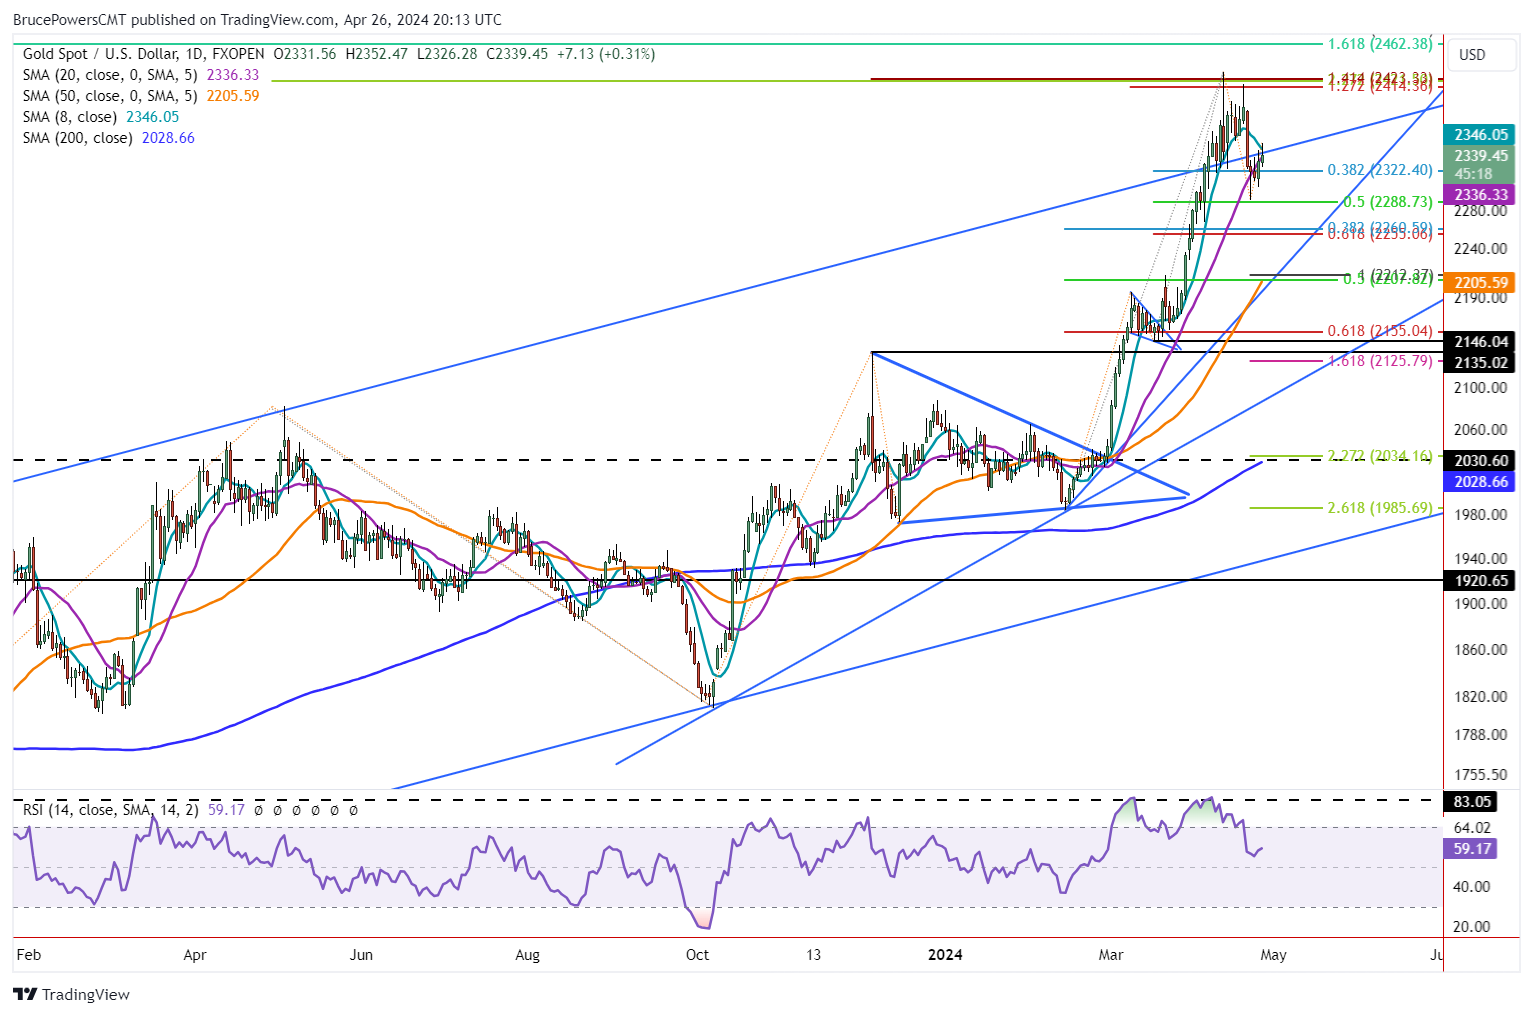
Drop Below 2,326 is Short-term Bearish
A drop below today’s low of 2,326 would provide an initial bearish signal that could lead to a test of the recent swing low at 2,291 and possibly a decline lower. If the 2,291-support zone fails to stop a decline the next lower target zone is from around 2,261 to 2,255. Two Fibonacci levels point to that price zone. Lower still is the 50-Day MA at 2,206. Further
Upside Potential Remains
On the upside, a breakout above this week’s high of 2,389. Would be needed to provide confidence that a rally may be able to continue higher and challenge the most recent record high of 2,431. Upside targets in gold remain. The question is will it enter a deeper retracement prior to a new high? The first higher target is the completion of an extended retracement at 2,462. It is followed by a price zone from around 2,480 to 2,488. The two-week low of 2,324 can also be watched for either signs of support or a breakdown. Certainly, it will provide a clue.
Watch for Additional Tests of Resistance
There may still be further tests of resistance heading into next week but the chance for a deeper retracement grows. Let’s consider the two recent sharp down days that reflected some degree of panic selling. The first was on April 12 and the second on April 22. If Friday’s high ends up being a swing high the chance for a further decline increases as well as the 2,212 to 2,207 lower target zone.
Read Full Story »»»
DiscoverGold
Yup after 17 yrs they raised rates, another words they blinked. They hold more foreign debt than anyone. Everything is coming up roses for gold.
Zimbabwe, one of the record holders for inflation and worthless paper in the past, is completely ahead of the curve, they know whats coming and have hitched their wagon to gold. it is the sign for what is coming, and nothing will stop it. its going unnoticed, by everyone but smart money, and central banks.
its going to be the run of a lifetime, central banks are all accumulating gold as fast as they can, they know fiat currency is unsalvageable due to debt and associated interest. its game over. expect a move that cannot be calculated, all the targets people talk about does not take into consideration the influence that generates what is now, all roads lead to gold.
Gold Short-Term Bullish Momentum but Resistance Looms
By: Bruce Powers | April 25, 2024
• Gold's outside day signals short-term bullishness, but resistance at the 20-Day MA and range around recent swing highs could cap gains.
Gold traced out an outside day today as it continues to flirt with the 20-Day MA as resistance. Earlier in the session gold fell to a low of 2,305 where it encountered support the led to an upside breakout above Wednesday’s 2,337 high. Today’s high was 2,345, at the time of this writing. Gold closed just below the 20-Day line yesterday and it continues to trade around the 20-Day MA.
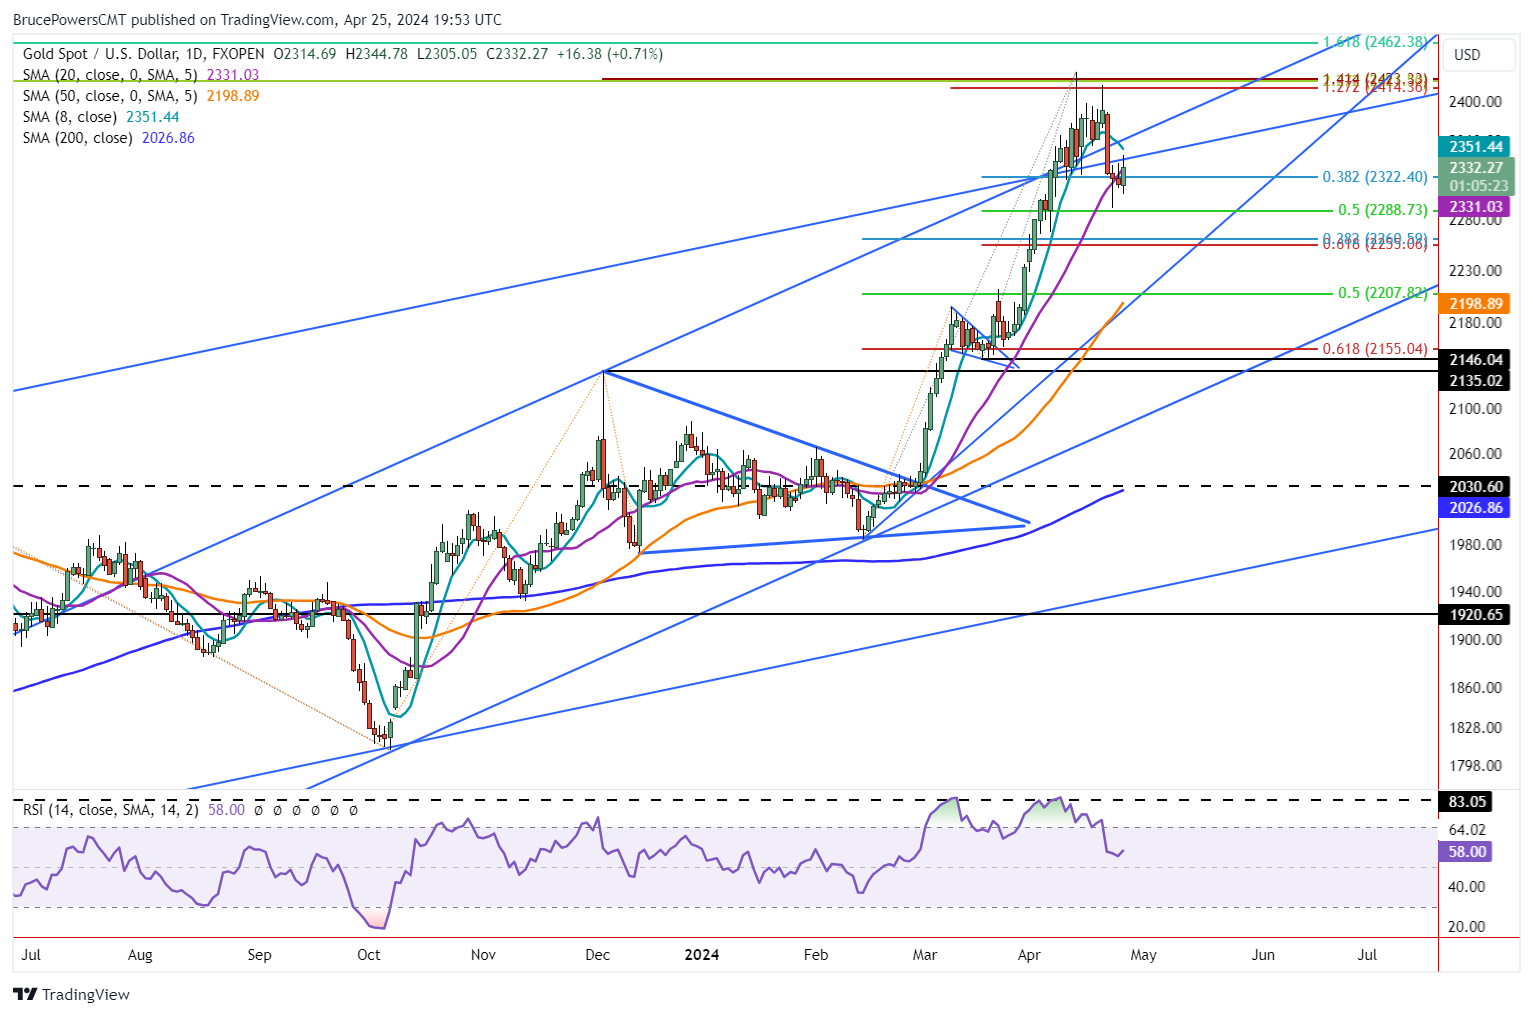
Short-Term Bullish
Nevertheless, today’s price action is short-term bullish and could lead to higher prices if today’s high of 2,345 is exceeded. If today’s bullish action continues gold would be heading up into a range of resistance around the recent swing high. The 8-Day MA is at 2,352 and this week’s high is at 2,389. This would seem to indicate a rally will likely encounter resistance before gold exceeds the recent record high of 2,431.
Resistance Around 20-Day MA Remains a Concern
Resistance was seen today, as well as the prior two days, around a top rising parallel channel line that previously was part of a support zone. In other words, the market is telling us prior support, represented by the line, may now be resistance. That is a small clue showing weakening in price.
Further, the 8-Day MA has turned down for the first time since mid-February, and it another sign that the short-term trend is weakening. It remains to be seen whether that weakening continues. A drop below today’s low would be the first sign of it. The recent swing low of 2,291 would then be at risk of being tested again as support, and it may fail leading to a deeper retracement.
April Closing to Provide Clues
Considering the monthly chart, gold is currently trading around the halfway point for the month’s trading range. If it closes the April at or below the 50% level, which is at 2,330 currently, it will end the month in a relatively weak position. March completed with a large green candle that closed near the highs.
It shows strong upward momentum that marks a breakout of a long-term base. Given the long-term breakout, it wouldn’t be surprising to see gold end the month in a strong position, above the 50% level. This may increase the chance for a continuation of the advance from this week’s low.
Read Full Story »»»
DiscoverGold
Gold No Progress from Bullish Setup
By: Bruce Powers | April 24, 2024
• Gold's price movement shows uncertainty as it approaches key resistance levels. A breakout triggered by a bullish pattern lacks convincing strength, while a bearish indication looms if the 20-Day MA becomes resistance.
There was little upside follow through on Wednesday, following a brief breakout above Tuesday’s hammer candlestick pattern. The high for the day was 2,337 and yesterday’s high was 2,334. Gold ended above the 20-Day MA on Tuesday following an earlier decline below it.
However, it is not yet clear where today’s close will be. Trading is happening around the 20-Day line at the time of this writing. A daily close below the line would be slightly bearish as it would be the first time the gold has closed below the line since the second half of February.
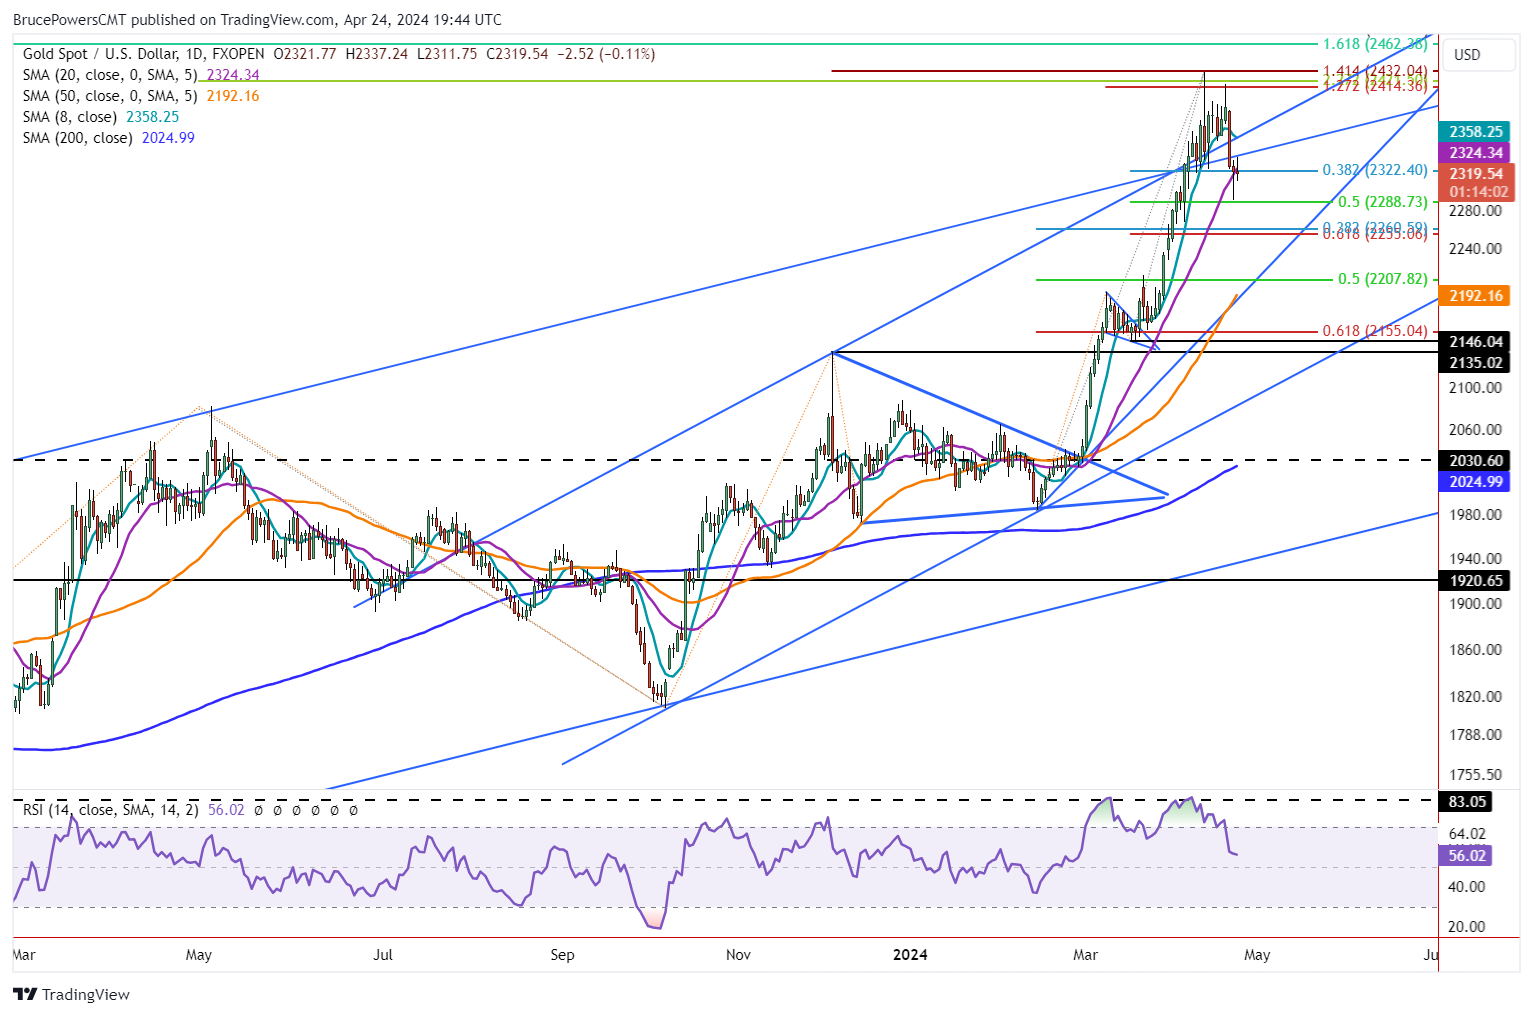
Watching for Further Signs
A bullish pattern breakout signal needs to have additional confirmation of strength following the breakout. Gold is already indicating that the hammer breakout is suspect given the relationship to the 20-Day MA. Also, the rise above yesterday’s high was minor and not convincing. It doesn’t show a clear improvement in demand. Further, notice that today’s high of 2,312 found resistance at a top channel line that had been part of a support zone until Monday’s sharp decline.
Tuesday’s Strength Needs Upside Follow Through
Tuesday’s low of 2,291 completed a 50% retracement level of the internal trend. The subsequent bullish hammer candlestick and daily close above the 20-Day line indicated that the retracement in gold may have completed. However, an upside breakout and subsequent additional signs of strength were needed.
The breakout has been triggered but there are not yet additional signs of strength. A daily close today above the 20-Day would be one sign, but minor. Then, another breakout above yesterday’s high followed by a daily close above it will provide additional confirmation.
20-Day MA is Key
Also, on the bearish side, a daily close below the 20-Day is a bearish indication. Further, today’s low of 2,312 could trigger short-term weakening as gold again approaches yesterday’s low of 2,291. If that low is broken to the downside, then a deeper correction is likely. The next lower target would be around the 38.2% Fibonacci retracement of the full swing that began from the February swing low. That price level is at 2,261 and includes the 61.8% retracement of the internal upswing at 2,255.
Read Full Story »»»
DiscoverGold
Gold Intraday Bullish Reversal Shows Strength
By: Bruce Powers | April 23, 2024
• Gold completes a 50% retracement, rebounds to 2,334, signaling potential upside breakout.
Gold completed a 50% retracement today with a low of 2,291 before buyers took control and ran the precious metal up to a high of 2,334, at the time of this writing. Earlier in Tuesday’s session the sellers were in control and dropped gold down to below its 20-Day MA to test support around the 50% retracement of the internal upswing. The 50% level is at 2,289. That is close enough given the subsequent bullish reaction following that low.
Quick Recovery of 20-Day Line is Bullish
Since around February 23 gold has been trading above the 20-Day line. Today was the first direct test of the line as support since then. Although it failed to maintain support, gold may close above the line with a bullish doji hammer candlestick pattern. Both a close above the 20-Day MA is bullish, and the fast recovery of the line is also bullish. It points to the possibility that a correction may be complete, or at least for now.
Upside Breakout Above Tuesday’s High
An upside breakout will be triggered on a rally above today’s high of 2,334, while a drop below today’s low of 2,291 signals a continuation of the correction. Also, gold could trade tomorrow inside day, which would provide a setup for Wednesday. A rally will be heading up into a potential resistance zone that arguably starts from around 2,354. Also, keep an eye on potential resistance around the 8-Day MA at 2,362 and this week’s high of 2,389.
Long-term Base Breakout in Play
Gold broke out of a multi-year basing pattern recently, which greatly improved its chances to continue to strengthen and trend higher following a correction. The degree and length of the current correction will tell us something about underlying demand. It should not be surprising if it stays strong given the significance of the long-term breakout. Upward momentum really kicked in upon the breakout of a symmetrical triangle on February 29. By March 5 a new record high in gold had been reached.
Drop Below 2,291 Starts a Deeper Retracement
There will likely be a retracement to test support around the orange 50-Day MA at some point during the advance. However, so far, it doesn’t look like it will happen in the current correction. Nonetheless, as noted above, a drop below today’s low of 2,291 could accelerate that scenario. But first there is potential support around the 2,261-price area, which the 38.2% Fibonacci retracement of the bull upswing, beginning from the February 14 swing low.
Read Full Story »»»
DiscoverGold
Gold Commodity Trading Advisor (CTA)s' bullish stance on gold reflects their confidence in the precious metal's ability to experience upward price momentum and its potential as a hedge against inflation and financial uncertainties
By: Isabelnet | April 23, 2024
• Gold
CTAs' bullish stance on gold reflects their confidence in the precious metal's ability to experience upward price momentum and its potential as a hedge against inflation and financial uncertainties.

Read Full Story »»»
DiscoverGold
Gold Continues to Slump
By: Christopher Lewis | April 23, 2024
• The gold market has drifted lower again in the early hours of Tuesday, as we continue to see the idea of a widening war in the Middle East disappear, at least for now. However, there are other reasons to think that the gold market could find buyers eventually.
Gold Markets Technical Analysis
The gold market fell again during the early hours on Tuesday, as you can see, testing the $2,300 level pretty quickly in the day. That being said, this is a market that I think will end up seeing a move lower, perhaps down to the 50 day EMA. After that, we would have $2,200.
So, with that being said, it does suggest that we’re probably more likely than not to see a little bit of selling pressure. And I think part of this comes down to the fact that the geopolitical concerns have kind of calmed down with even the Iranians saying that the Israelis had received the appropriate response. So, if that’s going to be the case, it does take that piece out of the decision making.
That doesn’t mean the gold will start to fall apart or that the trend is over. What it does mean is we are likely to have an opportunity to buy it at lower pricing. The 50 day EMA, the $2,200 level, I think both would be excellent entry points if we get that. But what I’m going to do is wait for a daily candlestick that ends up forming something like a hammer or signs of an impulsive move to the upside that I would take advantage of the relative strength index is now well within normalcy.
So, I think that’s something to keep in mind as well. We are far from the overbought condition that we had been in, so I will probably stop paying as much attention to that. Either way, I think you do get an opportunity for value play. Hopefully, we will drop another $100 and make it a truly strong opportunity, but we’ll just have to take what the market gives us.
Read Full Story »»»
DiscoverGold
Only reason gold and silver dropped so much is COMEX margin requirements. Gold went up 6% and silver 10%…..got to have more fiat to buy physical:)
33k if china or america pegs its fiat to gold, puts out their own coin, and chains like Ripple, through their seamless and lightning fast exchange, follow gold to the top of the Titons.
|
Followers
|
404
|
Posters
|
|
|
Posts (Today)
|
1
|
Posts (Total)
|
43442
|
|
Created
|
01/21/05
|
Type
|
Free
|
| Moderators NYBob DiscoverGold | |||
GOLDBUGS - I-hub's #1 precious metals board was created for those with an affinity for the yellow stuff.
Gold has a long history as a hedge against inflation, and in these challenging times it seems prudent to have a certain portion of your portfolio in gold and other precious metals.
For the novice or experienced trader investing in mining stocks or NYMEX, bullion or coins, exploration stocks or producers, you'll find others with similar interests.
Whether a technical or fundamental trader, long or short term, your questions and input are welcomed and appreciated.
"The GOLDBUGS board" is the place where Goldbugs live.
Articles, technical analysis, charts, and data of interest to goldbugs are all welcome here. Information concerning currencies and commodities are also welcome as these markets influence the PM's.
Rules of the Road:
1) No insults or bashing of another member.
2) Members will maintain an attitude of humility.
3) Members who find they are able to help another member will do so.
If you find the board useful please let us know by clicking the "Add To Favorites" link.


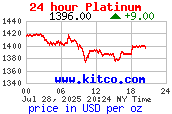


| Volume | |
| Day Range: | |
| Bid Price | |
| Ask Price | |
| Last Trade Time: |


