


| Followers | 692 |
| Posts | 144677 |
| Boards Moderated | 34 |
| Alias Born | 03/10/2004 |
Friday, May 03, 2024 5:08:13 PM
By: Bruce Powers | May 3, 2024
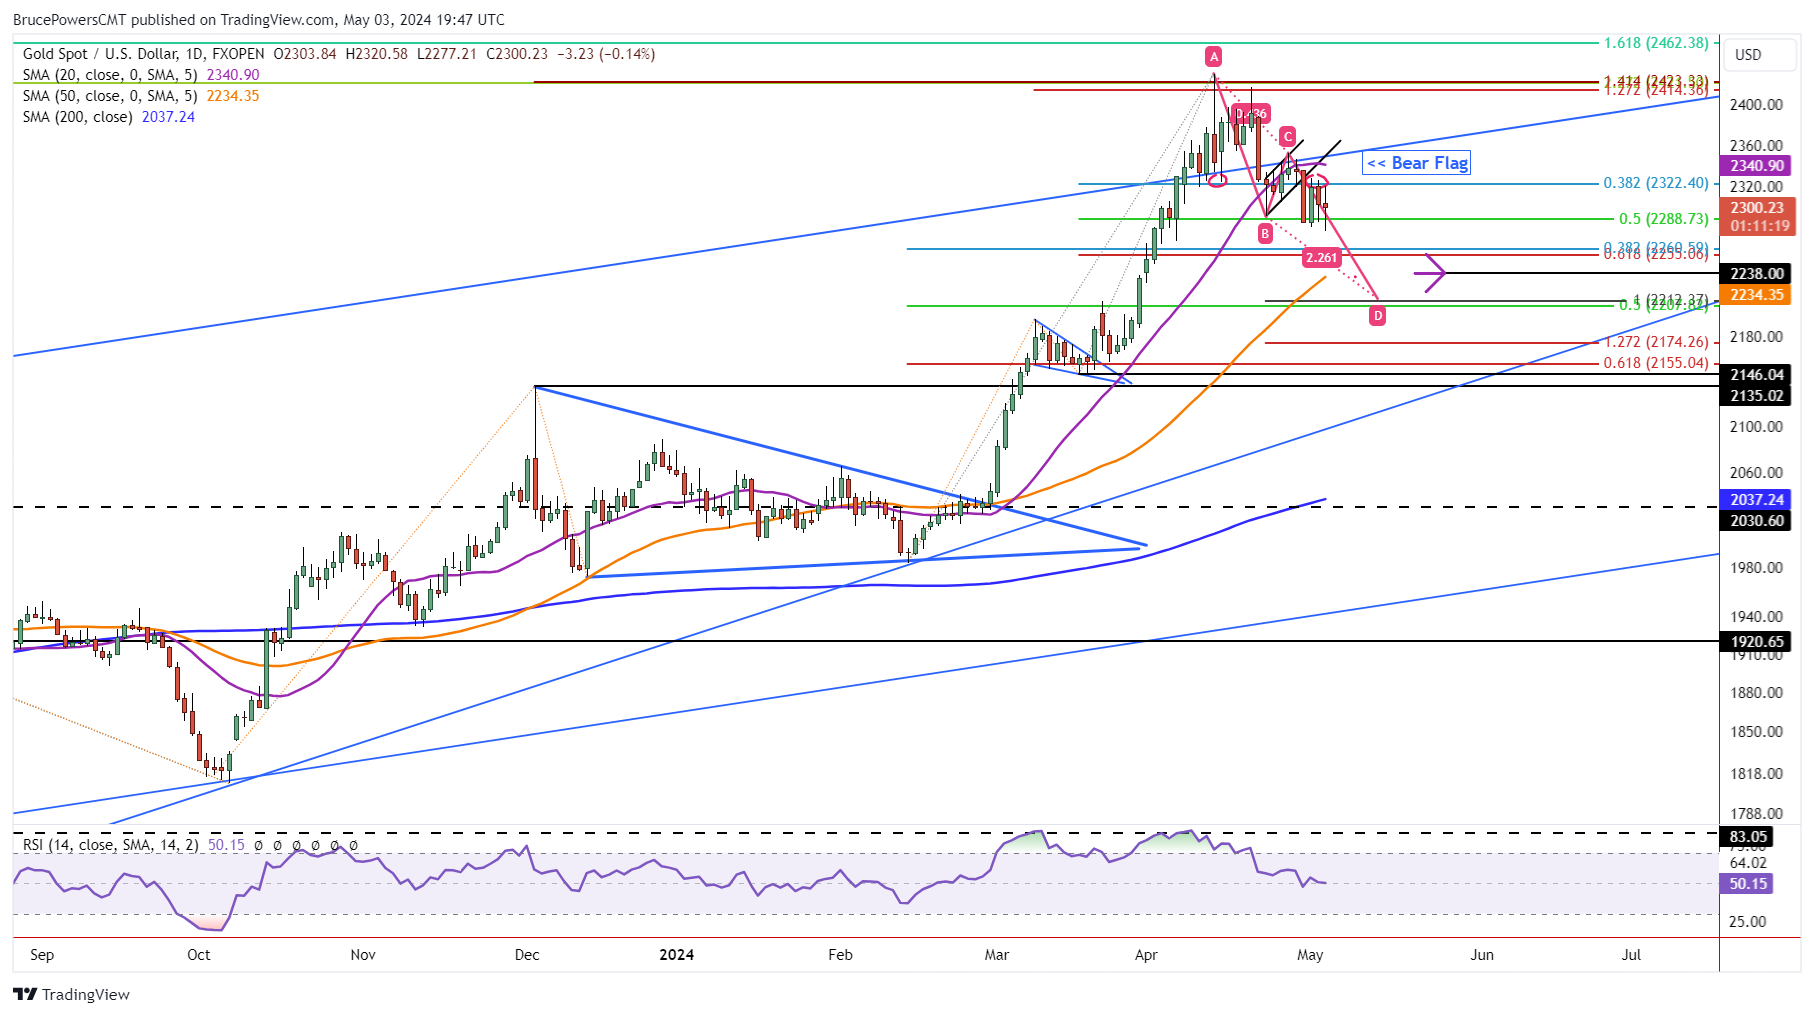
• Despite holding support around the 50% retracement level, gold faces more technical bearish signs, with a bear flag pattern indicating potential for lower levels ahead.
Although gold reached a new retracement low of 2,277, it continues to find support around the 50% retracement level. It is set to end Friday above the 50% retracement for the third day in a row, which is at 2,289. However, there remains more technical bearish signs than bullish indications currently, as it is in the process of retracing prior gains.
Bear Flag Continuation Potential Remains
A bear flag trend continuation pattern triggered on Tuesday and gold closed weak, near the low of the day and below the prior April 23 (B) swing low. That is a bearish sign indicating that it wants to go lower. However, rather than continue lower following the bearish signal, for the past three days gold has been consolidating around Tuesday’s price range instead. Nonetheless, price patterns are indicating lower support levels will likely be tested before the larger bull trend is ready to resume. An advance above last week’s high of 2,352 (C) would be needed to change that outlook.
Several Lower Targets
The next potential support area below this week’s low is a range of Fibonacci levels from 2,261 to 2,255. But that may be an interim level as the 50-Day MA has not been tested as support since the February 29 symmetrical triangle breakout. Since the 20-Day MA has failed to hold as support, the 50-Day line becomes a target. It is currently at 2,234, and very close to an initial target derived from the bear flag measurements. That pattern indicates a potential target of 2,238. Be aware that April saw support at a low of 2,228.
Support From April at 2,228
If the next lower price zone is to be reached this month, a bearish month signal will have triggered. If that happens, sellers could get more aggressive and drive prices lower. Below the 50-Day line there is the completion of a falling ABCD pattern at 2,212 and a 50% retracement level at 2,208. That would be the price area to watch for support if the 50-Day line is broken followed by April’s low.
Read Full Story »»»
 DiscoverGold
Information posted to this board is not meant to suggest any specific action, but to point out the technical signs that can help our readers make their own specific decisions. Caveat emptor!
• DiscoverGold
Recent GOLD News
- Barrick Responds to Mali Government’s Claims of Breaching Its Commitments • GlobeNewswire Inc. • 10/24/2024 08:10:17 PM
- Barrick Reports Q3 Preliminary Production Results With Continued Improvement at Pueblo Viejo • GlobeNewswire Inc. • 10/16/2024 11:00:00 AM
- Notice of Release of Barrick’s Third Quarter 2024 Results • GlobeNewswire Inc. • 10/10/2024 11:00:09 AM
- Africa’s Largest Gold Mine Probes Significant New Discoveries • GlobeNewswire Inc. • 10/08/2024 04:00:00 PM
- Twiga Partnership Leads Extractive Industry’s Contribution to Tanzanian Economy • GlobeNewswire Inc. • 10/05/2024 12:00:00 PM
- Lumwana’s Super Pit Expansion Officially Launched • GlobeNewswire Inc. • 10/02/2024 06:51:40 PM
- Barrick and Mali Reach Agreement to Settle Disputes • GlobeNewswire Inc. • 09/30/2024 06:35:12 PM
- Porgera Mine Working with UN and Enga Provincial Government to Provide Humanitarian Aid to Violence-Stricken Province • GlobeNewswire Inc. • 09/20/2024 03:35:21 PM
- Barrick Continues to Unlock Value Embedded in Its Asset Base • GlobeNewswire Inc. • 09/17/2024 05:00:29 PM
- Feasibility Study on Lumwana Super Pit Expansion Expected by Year-End • GlobeNewswire Inc. • 09/11/2024 09:00:00 PM
- Key Projects Advance as Barrick Keeps Tight Focus on Value Creation and Growth • GlobeNewswire Inc. • 08/12/2024 10:00:00 AM
- Barrick Declares Q2 Dividend and Buys Back Shares • GlobeNewswire Inc. • 08/12/2024 09:59:00 AM
- U.S. Futures Steady as Markets Await Key Inflation Data, Oil Prices Climb • IH Market News • 08/12/2024 09:47:41 AM
- Mining Plays a Vital Role in Advancing the UN’s Sustainable Development Goals, says Barrick • GlobeNewswire Inc. • 08/02/2024 06:45:39 PM
- Porgera Remains On Track Despite Mulitaka Landslide Challenges • GlobeNewswire Inc. • 07/25/2024 11:00:00 AM
- Higher Q2 Production Puts Barrick On Track to Deliver 2024 Targets • GlobeNewswire Inc. • 07/16/2024 11:00:00 AM
- Barrick Continues to Invest in Mali • GlobeNewswire Inc. • 07/09/2024 07:00:00 PM
- Exploration Success, Capital Investment and Reserve Growth to Sustain Kibali’s Production Profile • GlobeNewswire Inc. • 07/02/2024 04:00:00 PM
- Barrick and Zijin Contribute $1 Million to Support Papua New Guinea Landslide Victims • GlobeNewswire Inc. • 06/07/2024 11:18:39 AM
- Form SD - Specialized disclosure report • Edgar (US Regulatory) • 05/29/2024 08:01:04 PM
- Barrick’s Sustainability Strategy Delivers Real Value to Stakeholders • GlobeNewswire Inc. • 05/15/2024 11:00:00 AM
- Barrick Announces Extensive Exploration Partnership with Geophysx Jamaica • GlobeNewswire Inc. • 05/01/2024 10:15:00 AM
- Barrick to Ramp Up Production As It Remains On Track to Achieve 2024 Targets • GlobeNewswire Inc. • 05/01/2024 10:00:00 AM
- Barrick Declares Q1 Dividend • GlobeNewswire Inc. • 05/01/2024 09:59:00 AM
- Barrick Announces Election of Directors • GlobeNewswire Inc. • 04/30/2024 08:15:55 PM
CBD Life Sciences Inc. (CBDL) Launches High-Demand Mushroom Gummy Line for Targeted Wellness Needs, Tapping into a Booming $20 Billion Market • CBDL • Oct 31, 2024 8:00 AM
Nerds On Site Announces Q1 Growth and New Initiatives for the Remainder of 2024 • NOSUF • Oct 31, 2024 7:01 AM
Innovation Beverage Group Receives Largest Shipment of its Top-Selling Bitters to Date in the U.S.-Ready to Meet Growing Demand from Expanding Distribution Network • IBG • Oct 30, 2024 12:22 PM
Element79 Gold Corp to Update Investors on the Emerging Growth Conference on October 31, 2024 • ELMGF • Oct 30, 2024 9:08 AM
CBD Life Sciences Inc. (CBDL) Announces Grand View Research Report Findings on High - Growth CBD Equine Market, Aiming to Drive Unprecedented Shareholder Value • CBDL • Oct 29, 2024 10:19 AM
Integrated Ventures Announces Partnership And Lease Agreement with Driptide Wellness - Leading Health and Wellness Provider. • INTV • Oct 29, 2024 8:45 AM

