


| Followers | 680 |
| Posts | 141357 |
| Boards Moderated | 36 |
| Alias Born | 03/10/2004 |
Monday, April 29, 2024 6:02:26 PM
By: Bruce Powers | April 29, 2024
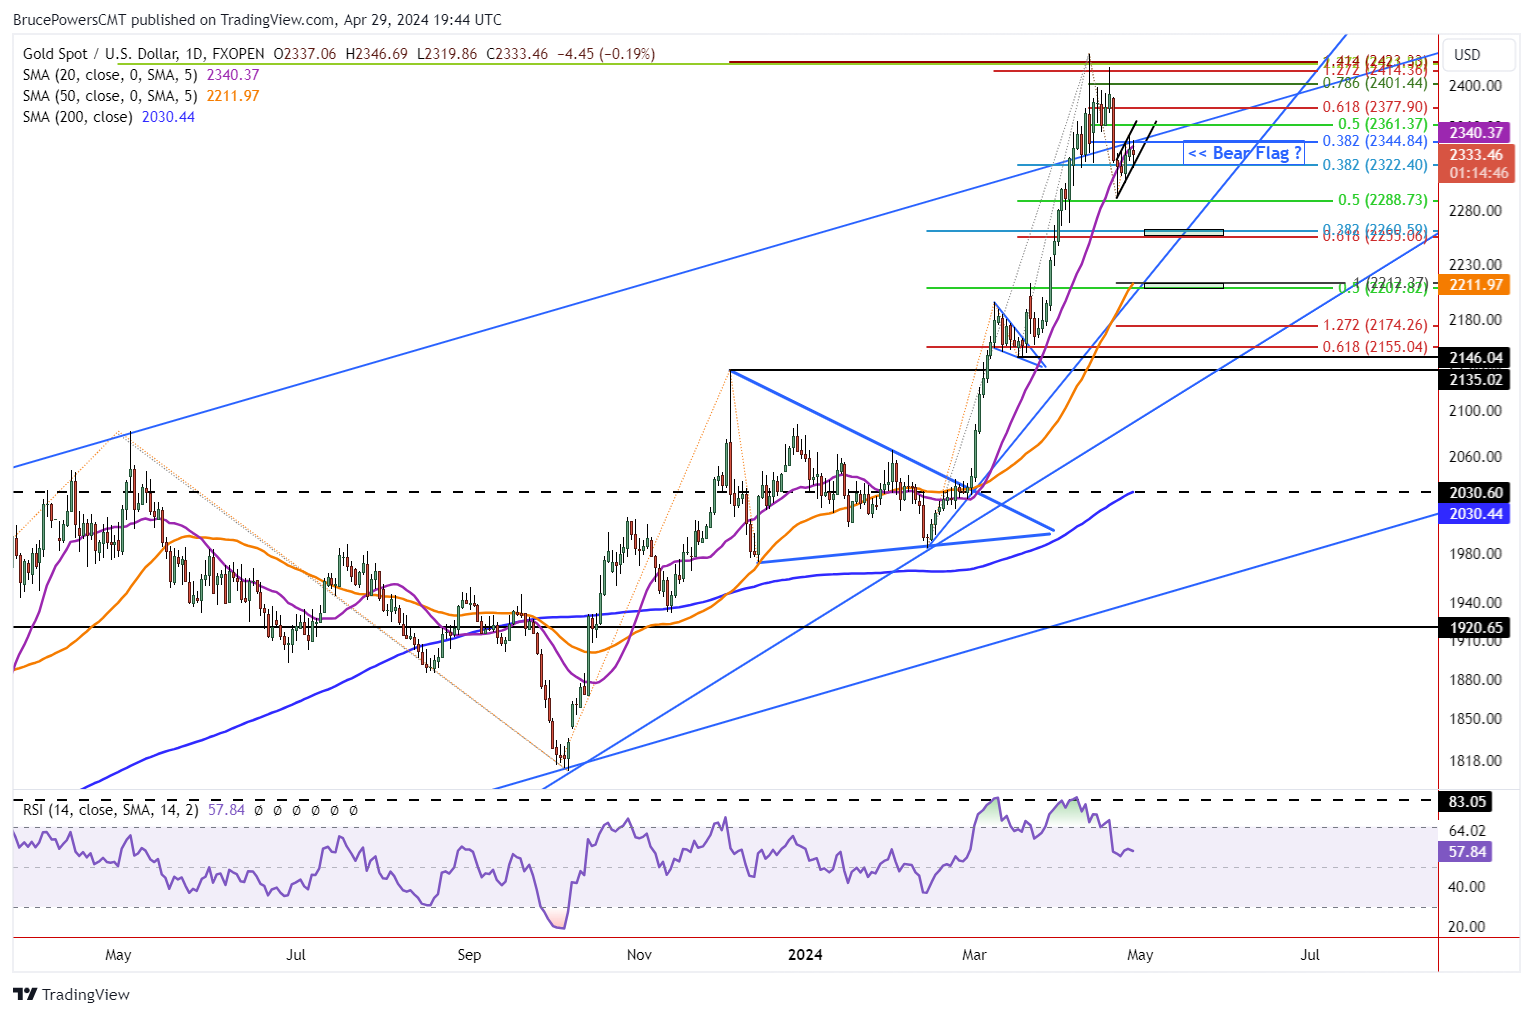
• Bearish flag forms, increasing retracement risk. Drop below 2,320 triggers breakdown.
Not much of a change for gold on Monday as it continues to attempt to advance from the 2,291-swing low hit last Tuesday. Although it is on track to close in the top quarter of the day’s range with a bullish hammer candlestick pattern it remains stuck around the 20-Day MA and a top rising trend channel line. Since the low last Tuesday, it has managed to complete a 38.2% Fibonacci retracement but not much higher. Together, these are some of the technical factors that continue to weigh on the price of gold.
Downward Pressure Remains
The longer gold attempts and fails to rally, the greater the chance for a retracement lower. There is now a clear bear flag that has formed on the daily chart for gold. Today’s low of 2,320 provides confirmation of the lower parallel line of the pattern. A decisive breakdown from today’s low triggers the bearish pattern. If it occurs the 2,291-swing low will be at risk of being broken as the next lower support zone is around 2,261 to 2,255, derived from two Fibonacci levels.
Further down is the target from the bear flag. It comes in around 2,238, which is below the 2,255-price zone but above the next lower price zone from 2,212 to 2,208. Notice that both an uptrend line and 50-Day MA are included in that lower price zone. The 50-Day line matches the top of the zone. If the 20-Day MA is broken to the downside the chance of reaching the 50-Day increases.
Downside Risk Remains if Higher Prices Stay Within Flag Boundary
Regardless of the potential for a deeper retracement, the possibility for an upside continuation remains. A decisive breakout above Friday’s high of 2,352 would be needed for bullish signs followed by a daily close above that price level. If this bullish scenario unfolds, keep in mind that higher prices that trade inside the rising parallel bull flag, remain within the flag.
The flag may expand yet remain bearish if trading continues inside the two rising parallel lines of the flag. A daily close above the top flag channel line would be needed for a clear bullish continuation signal.
Read Full Story »»»
 DiscoverGold
Information posted to this board is not meant to suggest any specific action, but to point out the technical signs that can help our readers make their own specific decisions. Caveat emptor!
• DiscoverGold
Recent GOLD News
- Barrick’s Sustainability Strategy Delivers Real Value to Stakeholders • GlobeNewswire Inc. • 05/15/2024 11:00:00 AM
- Barrick Announces Extensive Exploration Partnership with Geophysx Jamaica • GlobeNewswire Inc. • 05/01/2024 10:15:00 AM
- Barrick to Ramp Up Production As It Remains On Track to Achieve 2024 Targets • GlobeNewswire Inc. • 05/01/2024 10:00:00 AM
- Barrick Declares Q1 Dividend • GlobeNewswire Inc. • 05/01/2024 09:59:00 AM
- Barrick Announces Election of Directors • GlobeNewswire Inc. • 04/30/2024 08:15:55 PM
- Barrick On Track to Achieve 2024 Targets • GlobeNewswire Inc. • 04/16/2024 11:00:00 AM
- Notice of Release of Barrick’s First Quarter 2024 Results • GlobeNewswire Inc. • 04/09/2024 11:00:00 AM
- Strategy-Driven Barrick Builds on Value Foundation • GlobeNewswire Inc. • 03/28/2024 09:20:38 PM
- Barrick Hunts New Gold and Copper Prospects in DRC From Kibali Base • GlobeNewswire Inc. • 03/20/2024 02:00:00 PM
- Barrick Opens Academy at Closed Buzwagi Mine • GlobeNewswire Inc. • 03/18/2024 08:00:00 AM
- Barrick to Grow Production and Value on Global Asset Foundation • GlobeNewswire Inc. • 03/15/2024 11:53:01 AM
- Loulo-Gounkoto Delivers Another Value-Creating Performance • GlobeNewswire Inc. • 03/10/2024 10:00:00 AM
- Passing of the Right Honorable Brian Mulroney • GlobeNewswire Inc. • 03/02/2024 01:17:35 AM
- Kibali and DRC Partner to Promote Local Content • GlobeNewswire Inc. • 03/01/2024 02:22:43 PM
- Tanzanian Parliamentary Committee Lauds Barrick’s Work at North Mara • GlobeNewswire Inc. • 02/23/2024 12:00:00 PM
- Form 6-K - Report of foreign issuer [Rules 13a-16 and 15d-16] • Edgar (US Regulatory) • 02/14/2024 10:28:08 PM
- Form 6-K - Report of foreign issuer [Rules 13a-16 and 15d-16] • Edgar (US Regulatory) • 02/14/2024 08:05:25 PM
- Clear Strategies and Strong Partnerships Set Barrick Up to Outperform, Says Bristow • GlobeNewswire Inc. • 02/14/2024 11:00:00 AM
- Barrick Announces New Share Buyback Program • GlobeNewswire Inc. • 02/14/2024 10:59:00 AM
- Barrick Declares Q4 Dividend • GlobeNewswire Inc. • 02/14/2024 10:58:00 AM
- NGM Strongly Positioned for Growth • GlobeNewswire Inc. • 02/10/2024 01:00:16 AM
- Form SC 13G - Statement of acquisition of beneficial ownership by individuals • Edgar (US Regulatory) • 02/08/2024 03:03:08 PM
- Form 6-K - Report of foreign issuer [Rules 13a-16 and 15d-16] • Edgar (US Regulatory) • 02/08/2024 12:46:55 PM
- Geologically Driven Asset Management Delivers Barrick’s Third Successive Year of Reserve Growth at Sustained Quality, While Unlocking Embedded Growth Portfolio • GlobeNewswire Inc. • 02/08/2024 12:00:00 PM
- Form SC 13G/A - Statement of acquisition of beneficial ownership by individuals: [Amend] • Edgar (US Regulatory) • 02/01/2024 06:04:56 PM
FEATURED Music Licensing, Inc. (OTC: SONG) Subsidiary Pro Music Rights Secures Final Judgment of $114,081.30 USD, Demonstrating Strength of Licensing Agreements • May 17, 2024 11:00 AM
Greenlite Ventures Inks Deal to Acquire No Limit Technology • GRNL • May 17, 2024 3:00 PM
VPR Brands (VPRB) Reports First Quarter 2024 Financial Results • VPRB • May 17, 2024 8:04 AM
ILUS Provides a First Quarter Filing Update • ILUS • May 16, 2024 11:26 AM
Cannabix Technologies and Omega Laboratories Inc. enter Strategic Partnership to Commercialize Marijuana Breathalyzer Technology • BLO • May 16, 2024 8:13 AM
Avant Technologies to Revolutionize Data Center Management with Proprietary AI Software Platform • AVAI • May 16, 2024 8:00 AM

