


| Followers | 687 |
| Posts | 142406 |
| Boards Moderated | 35 |
| Alias Born | 03/10/2004 |
Thursday, May 02, 2024 4:36:26 PM
By: Bruce Powers | May 2, 2024
• Top trendline and 20-Day MA now act as resistance after previously behaving as support, indicating a bearish turn for gold..
Resistance was tested again today in gold for the second day in a row following the breakdown from a bear flag on Tuesday. Notice that resistance occurred around prior support represented by the 38.2% Fibonacci retracement level of 2,322. The 38.2% price zone was tested as support on the first pullback from the recent 2,431 record high on April 15. This is typical price behavior in a market that is turning bearish. Prior support levels become resistance. Although the bull trend remains well intact a deeper retracement is likely before it is ready to resume.
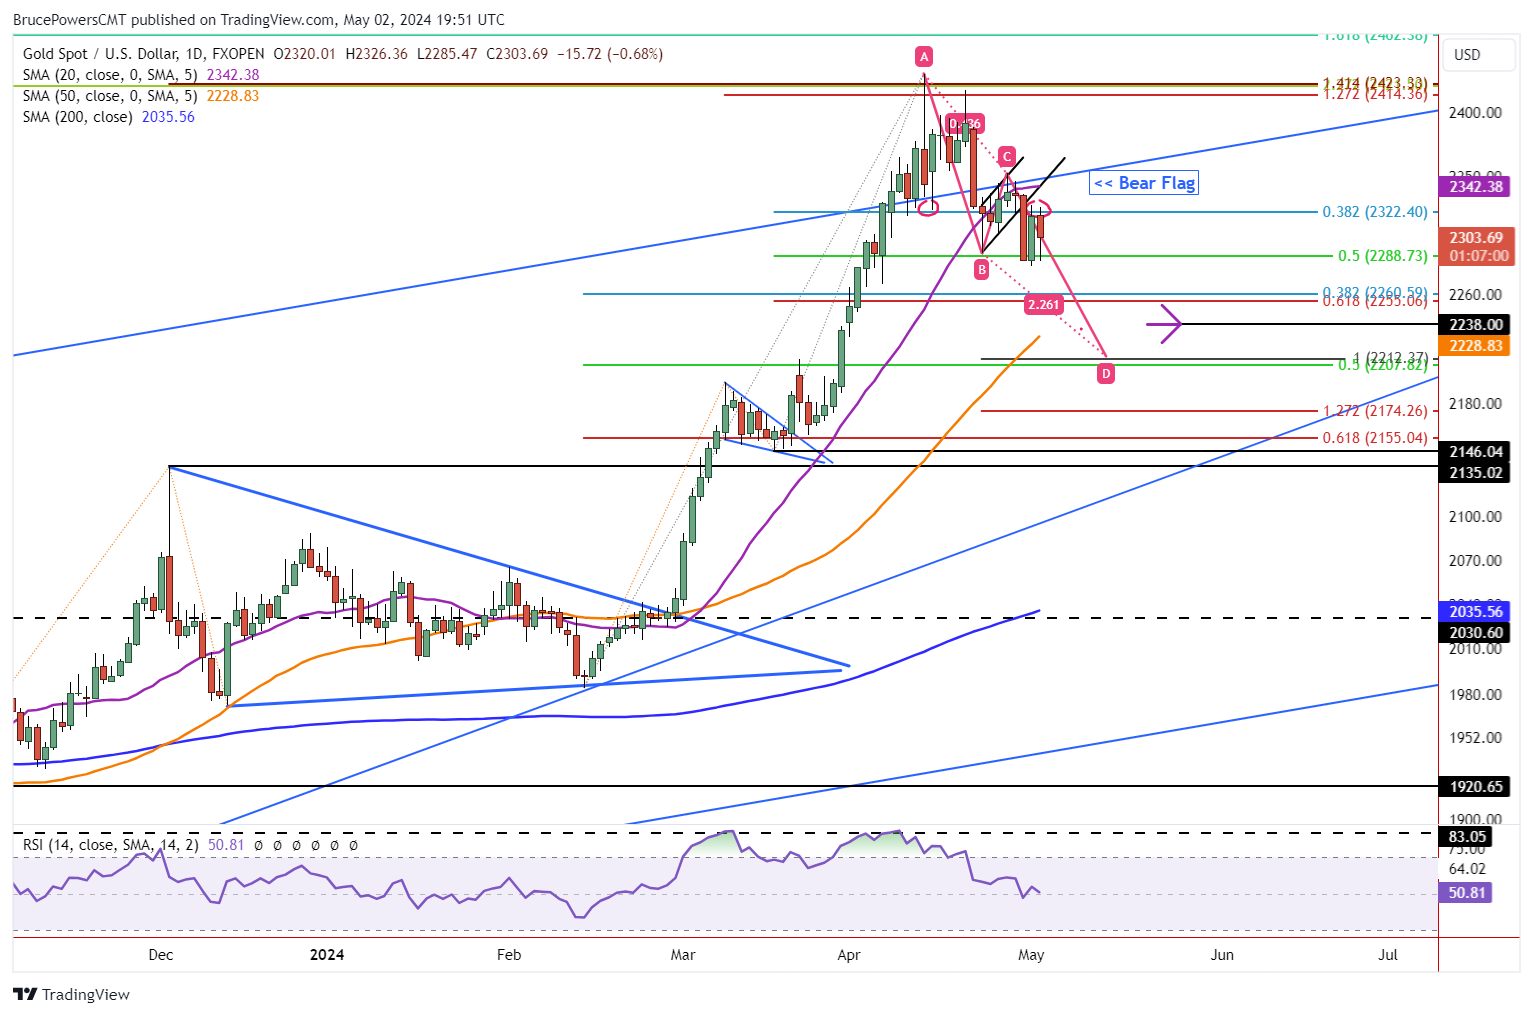
Signs of Weakening as Previous Support Becomes Resistance
Similar behavior was seen recently around the top trendline and 20-Day MA. Each previously represented a support zone. Following the sharp selloff on April 22 that dropped gold below the top trendline, it was tested as resistance. Once the 20-Day MA failed as support it was subsequently successfully tested as resistance. Combined with the breakdown of a bear flag on Tuesday, gold looks to be telegraphing a deeper retracement. And the bear wedge just triggered, so it remains in the early stage of another leg down. Nevertheless, a decisive advance above this week’s high of 2,347 would negate the bear flag.
Several Lower Targets
Following a drop below this week’s low of 2,282 gold will likely first be heading towards a small Fibonacci confluence zone from 2,260 to 2,255. If it keeps falling the minimum 2,238 target from the bear flag comes into view. Now that the 50-Day MA has risen a bit above the next lower target zone, it falls close to the flag target at 2,229. A little lower is a 2,212 to 2,208 price zone consisting of the initial target from the descending ABCD pattern and the 50% retracement of the swing started from the February low, respectively.
April Low at Risk
Of note is last month’s low of 2,228. It is significant since it was a monthly low. A drop below it is bearish by itself, but the implications would depend on what happens next. Does gold continue to fall to test lower price zones? If it does, the speed of recovery of the 2,228 will be telling.
Read Full Story »»»
 DiscoverGold
Information posted to this board is not meant to suggest any specific action, but to point out the technical signs that can help our readers make their own specific decisions. Caveat emptor!
• DiscoverGold
Recent GOLD News
- Exploration Success, Capital Investment and Reserve Growth to Sustain Kibali’s Production Profile • GlobeNewswire Inc. • 07/02/2024 04:00:00 PM
- Barrick and Zijin Contribute $1 Million to Support Papua New Guinea Landslide Victims • GlobeNewswire Inc. • 06/07/2024 11:18:39 AM
- Form SD - Specialized disclosure report • Edgar (US Regulatory) • 05/29/2024 08:01:04 PM
- Barrick’s Sustainability Strategy Delivers Real Value to Stakeholders • GlobeNewswire Inc. • 05/15/2024 11:00:00 AM
- Barrick Announces Extensive Exploration Partnership with Geophysx Jamaica • GlobeNewswire Inc. • 05/01/2024 10:15:00 AM
- Barrick to Ramp Up Production As It Remains On Track to Achieve 2024 Targets • GlobeNewswire Inc. • 05/01/2024 10:00:00 AM
- Barrick Declares Q1 Dividend • GlobeNewswire Inc. • 05/01/2024 09:59:00 AM
- Barrick Announces Election of Directors • GlobeNewswire Inc. • 04/30/2024 08:15:55 PM
- Barrick On Track to Achieve 2024 Targets • GlobeNewswire Inc. • 04/16/2024 11:00:00 AM
- Notice of Release of Barrick’s First Quarter 2024 Results • GlobeNewswire Inc. • 04/09/2024 11:00:00 AM
- Strategy-Driven Barrick Builds on Value Foundation • GlobeNewswire Inc. • 03/28/2024 09:20:38 PM
- Barrick Hunts New Gold and Copper Prospects in DRC From Kibali Base • GlobeNewswire Inc. • 03/20/2024 02:00:00 PM
- Barrick Opens Academy at Closed Buzwagi Mine • GlobeNewswire Inc. • 03/18/2024 08:00:00 AM
- Barrick to Grow Production and Value on Global Asset Foundation • GlobeNewswire Inc. • 03/15/2024 11:53:01 AM
- Loulo-Gounkoto Delivers Another Value-Creating Performance • GlobeNewswire Inc. • 03/10/2024 10:00:00 AM
- Passing of the Right Honorable Brian Mulroney • GlobeNewswire Inc. • 03/02/2024 01:17:35 AM
- Kibali and DRC Partner to Promote Local Content • GlobeNewswire Inc. • 03/01/2024 02:22:43 PM
- Tanzanian Parliamentary Committee Lauds Barrick’s Work at North Mara • GlobeNewswire Inc. • 02/23/2024 12:00:00 PM
- Form 6-K - Report of foreign issuer [Rules 13a-16 and 15d-16] • Edgar (US Regulatory) • 02/14/2024 10:28:08 PM
- Form 6-K - Report of foreign issuer [Rules 13a-16 and 15d-16] • Edgar (US Regulatory) • 02/14/2024 08:05:25 PM
- Clear Strategies and Strong Partnerships Set Barrick Up to Outperform, Says Bristow • GlobeNewswire Inc. • 02/14/2024 11:00:00 AM
- Barrick Announces New Share Buyback Program • GlobeNewswire Inc. • 02/14/2024 10:59:00 AM
- Barrick Declares Q4 Dividend • GlobeNewswire Inc. • 02/14/2024 10:58:00 AM
- NGM Strongly Positioned for Growth • GlobeNewswire Inc. • 02/10/2024 01:00:16 AM
- Form SC 13G - Statement of acquisition of beneficial ownership by individuals • Edgar (US Regulatory) • 02/08/2024 03:03:08 PM
Freedom Holdings Corporate Update; Announces Management Has Signed Letter of Intent • FHLD • Jul 3, 2024 9:00 AM
EWRC's 21 Moves Gaming Studios Moves to SONY Pictures Studios and Green Lights Development of a Third Upcoming Game • EWRC • Jul 2, 2024 8:00 AM
BNCM and DELEX Healthcare Group Announce Strategic Merger to Drive Expansion and Growth • BNCM • Jul 2, 2024 7:19 AM
NUBURU Announces Upcoming TV Interview Featuring CEO Brian Knaley on Fox Business, Bloomberg TV, and Newsmax TV as Sponsored Programming • BURU • Jul 1, 2024 1:57 PM
Mass Megawatts Announces $220,500 Debt Cancellation Agreement to Improve Financing and Sales of a New Product to be Announced on July 11 • MMMW • Jun 28, 2024 7:30 AM
VAYK Exited Caribbean Investments for $320,000 Profit • VAYK • Jun 27, 2024 9:00 AM

