Register for free to join our community of investors and share your ideas. You will also get access to streaming quotes, interactive charts, trades, portfolio, live options flow and more tools.
Styl - nice pick, congrats! If you like FECOF you might like SSOF. It's a hot oil service play. The company has released some good news and the stock has responded, reaching 3-yr highs last week even though the last news was a month or two ago.
South China Sea!!!
FECOF. Up 50% today and. 350% in 2 weeks!!! Fec resources= fecof
You've all heard about the crisis in the South China Sea between the philipines and China..... china actually rammed an exploratory boat on the reed bank 6 years ago and stopped a world class discovery in Sc72 from happening. Since then china and ph are in talks to finally make this happen. It's all over google news outlets. Search it. Pres Xi of China meets PH Duterte to sign a framework contract to go drill sc72 together. Maybe a few weeks away more or less. Sc72 is estimated at 8tcf to 20tcf ( wetherford research. And us energy dept. research)which is gigantic and primed to replace the world class malampaya oil/gas field next to it. Malampaya was a 2.7tcf and according to a few reports , malampaya has produced about 90 billion net profits and about 180 billion net profits by the time it's done in 10 years.
I'm here to bring attention to a micro cap huuuuuige oil play. Fecof has a 6.8% position of forum energy, and forum energy controls 70% of the sc72 contract. Pxp energy owns a large 72% position in forum energy, as well as being fecof' parent company.. pxp is a large 600 million market cap company trading on the pse, philipines. But fecof is a Canadian company in the pinks roughly a 15 million market cap.
When the reed bank deal with china was announced as probable, the stock of pxp went from 2.80 to 14 pesos in anticipation. When comparing pxp's equity in forum shares, it's clear that fecofs 6.8% in forum is at a huge discount and besides that when the deal is done and the contract announced, this 15 million dollar market cap company fecof will be sitting on a possible 4 billion dollar value or more in its lifetime net profits. It's safe to guess this stock can easily reach 50 cents in a year with forward announcements and a contract. There are 100 of us on the fecof board and are holding this stock up very strong for a long term gain but we need new attention . We won't sell this 4 cent stock until a contract is announced soon and we get 50 cents minimum. Please come to out board where we have the research and valuations mapped out.
Best Wishes to ALL for a Happy, Healthy and Prosperous New Year!!!
• DiscoverGold
COT - Commitments of Traders in Crude Oil Futures Market Reports
* December 30, 2016

http://www.cotpricecharts.com/commitmentscurrent/index.php
• DiscoverGold
Click on "In reply to", for previous Reports
Happy Thanksgiving to All and their Families!
• DiscoverGold
Peek Into Crude Oil Future Through Futures
* October 22, 2016
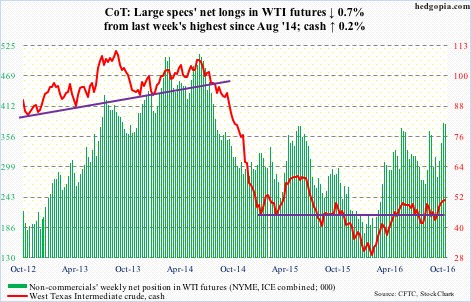
The following are futures positions of non-commercials as of October 18, 2016.
Crude oil: This time of the year, it is normal for U.S. crude inventory to build. Refineries go into maintenance, producing less fuel products.
In the week through October 14, refinery utilization did indeed drop five-tenths of a point, to 85 percent – the lowest since April 26, 2013.
Distillate stocks fell too, by 1.2 million barrels to 155.6 million barrels – a seven-week low.
But gasoline stocks rose, by 2.5 million barrels to 228 million barrels – a five-week high.
The surprise of all, crude stocks fell by 5.2 million barrels to 468.7 million barrels. This was the lowest since January 22 this year. Crude stocks have dropped by 26.5 million barrels in the last seven weeks, and refinery utilization by 8.5 percentage points in the last six.
Perhaps contributing to the large weekly drop in crude stocks was crude imports, which fell a whopping 954,000 barrels per day to 6.9 million b/d – the lowest since June 19, 2015.
Production rose a tad, by 14,000 b/d to 8.5 mb/d. Production peaked at 9.61 mb/d in the June 5th week last year.
Traders on Wednesday decided to focus on the drop in crude stocks/imports not the increase in gasoline stocks. Spot West Texas Intermediate crude rallied 2.4 percent in that session, past the June 9th high of $51.67/barrel. XLE, the SPDR energy ETF, tagged along, up 1.4 percent, but substantially off session highs.
Since February lows, spot WTI has been making higher lows, and would have been an interesting development should it convincingly push past the June 9th high for higher highs. The problem is, it has fatigue written all over, with a daily bearish MACD crossover.
Currently net long 378.5k, down 2.8k.
http://www.hedgopia.com/cot-peek-into-future-through-futures-66/
• DiscoverGold
Click on "In reply to", for Authors past commentaries
COT - Commitments of Traders in Crude Oil Futures Market Reports
* October 21, 2016

http://www.cotpricecharts.com/commitmentscurrent/index.php
• DiscoverGold
Click on "In reply to", for previous Reports
Peek Into Crude Oil Future Through Futures
* October 8, 2016
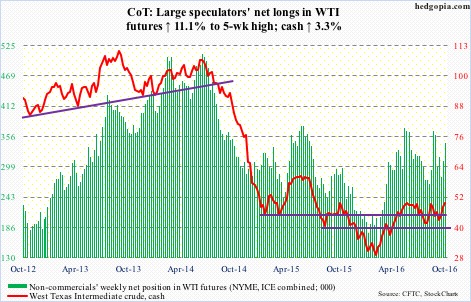
The following are futures positions of non-commercials as of October 4, 2016.
Crude oil: Spot West Texas Intermediate crude managed to break out of the declining trend line drawn from May last year. The June 9th high of $51.67/barrel has now taken on greater significance. Until that high gets taken out, crude remains range bound, with the August 3rd low of $39.19 on the bottom end.
This week, the EIA data helped trader sentiment as well.
In the week ended September 30, U.S. crude stocks fell by three million barrels to 499.7 million barrels – the lowest since January 22 this year.
Distillate stocks dropped, too, by 2.4 million barrels to 160.7 million barrels.
Crude imports fell by 125,000 barrels per day to 7.7 million b/d.
Ditto with crude production, which declined by 30,000 b/d to 8.47 mb/d. Production peaked at 9.61 mb/d in the June 5th week last year.
Refinery utilization, however, fell from 90.1 to 88.3 percent – a 23-week low.
And gasoline stocks rose by 222,000 barrels to 227.4 million barrels.
Spot WTI remains overbought on the daily chart. It has been trading along a rising trend line from February lows, so the recent breakout could prove to be important, should it manage to take out the June 9th high. On the other hand, price likely retreats near term. The February trend line gets tested around $45.
Currently net long 343.9k, up 34.5k.
http://www.hedgopia.com/cot-peek-into-future-through-futures-64/
• DiscoverGold
Click on "In reply to", for Authors past commentaries
COT - Commitments of Traders in Crude Oil Futures Market Reports
* October 7, 2016

http://www.cotpricecharts.com/commitmentscurrent/index.php
• DiscoverGold
Click on "In reply to", for previous Reports
Peek Into Crude Oil Future Through Futures
* October 1, 2016
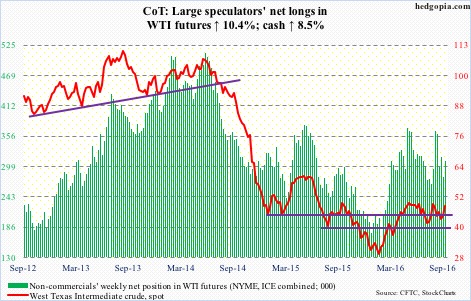
The following are futures positions of non-commercials as of September 27, 2016.
Crude oil: OPEC commits itself to cutting output to between 32.5 million barrels per day and 33 mb/d. In August, the cartel produced 33.24 mb/d. The last time the 14-member group, with a little over one-third market share globally, cut production was during the financial crisis in 2008. Shows how much the producers, including Saudi Arabia, are hurting.
In the grand scheme of things, fundamentally this is not that big of a cut, given the prevailing oil glut. Also on Wednesday, but before the OPEC decision, the International Energy Agency said it did not see the oil market rebalancing until late 2017.
That said, OPEC’s decision speaks of the producing nations’ intent – that they are willing to compromise. Saudi Arabia in particular, which produced a record 10.673 million barrels per day in July, is capitulating. There are no details yet on how the cuts will be implemented – a potential source of discord later. Iran in particular seems to be targeting pre-sanction market share not just four mb/d.
When it is all said and done, this may prove to be a life line for U.S. shale oil, which then means glut persists, precisely what OPEC is trying to avoid. Time will tell.
Be that as it may, it was enough of a catalyst for traders to push up spot West Texas Intermediate crude 5.3 percent on Wednesday – past the August 19th declining trend line – and then another 2.5 percent in the next two sessions. The 50-day moving average has been recaptured.
A bigger hurdle lies around $48/barrel, which approximates the declining trend line drawn from the May 2015 high of $62.58. The spot ended the week right on that resistance.
On a related note, mid-September short interest on XLE, the SPDR energy ETF, surged 38 percent period-over-period. These shorts probably got squeezed, leading to the 5.7-percent surge on Wednesday through Friday. The ETF closed the week at $70.61 – right at resistance, which goes back to March 2011.
Trader sentiment on Wednesday was also helped by the EIA data.
In the week ended September 23, U.S. crude stocks fell by 1.9 million barrels to 502.7 million barrels – the lowest since February 5 this year.
Distillate stocks dropped by the same amount to 163.1 million barrels. The prior week was the highest since January 8 this year.
Gasoline stocks, however, rose by two million barrels to 227.2 million barrels. The prior week was the lowest since December 25 last year.
Crude imports fell by 474,000 b/d to 7.8 mb/d.
Crude production declined 15,000 b/d to 8.5 mb/d. Production peaked at 9.61 mb/d in the June 5th week last year.
Refinery utilization stood at 90.1 percent, down from 92 percent. This was a 17-week low.
Currently net long 309.4k, up 29.3k.
http://www.hedgopia.com/cot-peek-into-future-through-futures-63/
• DiscoverGold
Click on "In reply to", for Authors past commentaries
COT - Commitments of Traders in Crude Oil Futures Market Reports
* September 30, 2016

http://www.cotpricecharts.com/commitmentscurrent/index.php
• DiscoverGold
Click on "In reply to", for previous Reports
Peek Into Crude Oil Future Through Futures
* September 24, 2016
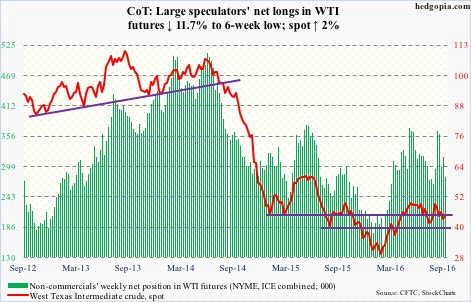
The following are futures positions of non-commercials as of September 20, 2016.
Crude oil: Saudi Arabia produced a record 10.673 million barrels per day in July, up from 10.550 mb/d in June. Its crude exports rose to 7.622 mb/d from 7.456 mb/d in June. Next week, OPEC meets in Algiers. Its 14 members are pumping more than 33 million barrels per day. Inaction means oil glut only gets worse.
In the U.S., in the week ended September 16th, crude stocks fell by 6.2 million barrels to 504.6 million barrels – the lowest since February 26th this year.
Gasoline stocks dropped by 3.2 million barrels to 225.2 million barrels. This was the lowest since December 25th last year.
Distillate stocks, however, rose by 2.2 million barrels to 165 million barrels – the highest since January 8th this year.
Crude production increased by 19,000 b/d to 8.51 mb/d – a four-week high. Production peaked at 9.61 mb/d in the June 5th week last year.
Crude imports stood at 8.3 mb/d, up 247,000 b/d.
Refinery utilization fell nine-tenths of a point to 92 percent – a 13-week low.
Spot West Texas Intermediate crude on Tuesday once again tested support at $43-$43.50, which held. This was followed by recapturing of the 50-day moving average, which was again lost on Friday. The spot would have met the declining trend line drawn from the June 9th high of $51.67/barrel around $48, but retreated before reaching there, with the intra-day high on Friday of $46.55. The pattern of lower highs since that peak continues.
Currently net long 280.2k, down 37.3k.
http://www.hedgopia.com/cot-peek-into-future-through-futures-62/
• DiscoverGold
Click on "In reply to", for Authors past commentaries.
COT - Commitments of Traders in Crude Oil Futures Market Reports
* September 23, 2016

http://www.cotpricecharts.com/commitmentscurrent/index.php
• DiscoverGold
Click on "In reply to", for previous Reports.
COT - Commitments of Traders in Crude Oil Futures Market Reports
* September 16, 2016

http://www.cotpricecharts.com/commitmentscurrent/index.php
• DiscoverGold
Click on "In reply to", for previous Reports.
Peek Into Crude Oil Future Through Futures
* September 10, 2016
The following are futures positions of non-commercials as of September 6, 2016.
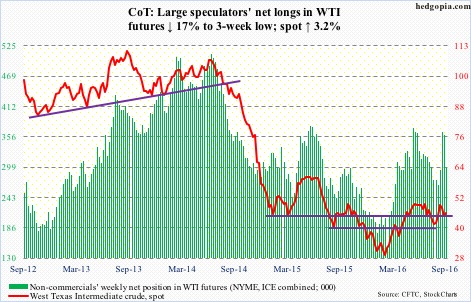
Crude oil: Support at $43-$43.50 on spot West Texas Intermediate crude was defended last week. It feebly built on that this week.
News quoting a National Iranian Oil Co. official that Iran can raise daily production to four million barrels in two to three months from the current 3.8 million barrels was passed over. Traders in particular focused on the EIA data.
In the week ended September 2nd, crude stocks fell 14.5 million barrels to 511.4 million barrels. This was the lowest since February 19th this year.
Gasoline stocks dropped by 4.2 million barrels to 227.8 million barrels – the lowest since December 25th last year.
Crude production declined by 30,000 barrels per day to 8.46 million b/d. Production peaked at 9.61 mb/d in the June 5th week last year.
Crude imports fell by 1.8 mb/d to 7.07 mb/d – the lowest since November 13th last year.
Refinery utilization rose nine-tenths of a point to 93.7 percent – the highest since November 27th last year.
The only negative data point was distillate inventory, which rose by 3.4 million barrels to 158.1 million barrels.
Spot WTI rallied 3.2 percent for the week. The EIA data was probably influenced by Hermine, so oil in all likelihood may find it difficult to maintain recent momentum.
Currently net long 298.3k, down 61k.
http://www.hedgopia.com/cot-peek-into-future-through-futures-60/
• DiscoverGold
Click on "In reply to", for Authors past commentaries.
COT - Commitments of Traders in Crude Oil Futures Market Reports
* September 9, 2016

http://www.cotpricecharts.com/commitmentscurrent/index.php
• DiscoverGold
Click on "In reply to", for previous Reports.
Peek Into Crude Oil Future Through Futures
* September 3, 2016
The following are futures positions of non-commercials as of August 30, 2016. Change is week-over-week.
Crude oil: The failure two weeks ago to break out of a potentially bullish reverse head-and-shoulders formation is proving costly for spot West Texas Intermediate crude. After last week’s three-percent drop, it dropped another 6.7 percent this week.
Momentum was already down. Come Wednesday, the spot suffered a daily bearish MACD cross, also losing the declining 50-day moving average. The 200-day – flattish – is 7.9 percent away. Wednesday’s EIA data was not much help.
In the week ended August 26th, crude stocks rose by 2.3 million barrels to 525.9 million barrels – a nine-week high.
Distillate stocks increased by 1.5 million barrels to 154.8 million barrels – a 16-week high.
Crude imports were up 275,000 barrels per day to 8.9 million b/d – the highest since September 14, 2012.
Gasoline stocks, however, fell by 691,000 barrels to 232 million barrels. This was the lowest since January 1st this year.
Refinery utilization rose three-tenths of a point to 92.8 percent.
Last but not the least, crude production fell by 60,000 b/d to 8.49 mb/d. Production peaked at 9.61 mb/d in the June 5th week last year.
Off the August 19th high of $49.36, the spot is now down five points. Support at $43-$43.50 has taken on a new significance. It was defended on Thursday and Friday.
Currently net long 359.3k, down 6.1k.

http://www.hedgopia.com/cot-peek-into-future-through-futures-59/
• DiscoverGold
Click on "In reply to", for Authors past commentaries.
COT - Commitments of Traders in Crude Oil Futures Market Reports
* September 2, 2016

http://www.cotpricecharts.com/commitmentscurrent/index.php
• DiscoverGold
Click on "In reply to", for previous Reports.
Peek Into Crude Oil Future Through Futures
* August 27, 2016
The following are futures positions of non-commercials as of August 23, 2016. Change is week-over-week.
Crude oil: Easy come, easy go? Too soon to reach that conclusion, but a lot is riding on OPEC’s informal meeting slated for late September. Mere talk of possible announcement of production freeze has done wonders to crude oil, with spot West Texas Intermediate crude rallying 26 percent in a little over two weeks before coming under pressure this week. Oil bulls need results not just rumors for these gains to sustain.
Especially considering that at last Friday’s intra-day high spot WTI was a hair’s breadth away from the neckline of a potentially bullish reverse head-and-shoulders formation. Longs decided to lock in gains.
The EIA data for the week ended August 19th provided a good excuse.
Stocks rose. Crude inventory rose by 2.5 million barrels to 523.6 million barrels, gasoline inventory by 36,000 barrels to 232.7 million barrels, and distillate inventory by 122,000 barrels to 153.3 million barrels.
Crude imports increased 449,000 barrels per day to 8.6 million b/d.
Refinery utilization dropped one percentage point to 92.5 percent.
Crude production, however, fell slightly, by 49,000 b/d to 8.5 mb/d. Production peaked at 9.61 mb/d in the June 5th week last year.
Immediately ahead, it will be interesting to see if WTI longs can defend the 50-day moving average, which is two points lower.
Currently net long 365.4k, up 71.4k.

http://www.hedgopia.com/cot-peek-into-future-through-futures-58/
• DiscoverGold
Click on "In reply to", for Authors past commentaries.
COT - Commitments of Traders in Crude Oil Futures Market Reports
* August 26, 2016

http://www.cotpricecharts.com/commitmentscurrent/index.php
• DiscoverGold
Click on "In reply to", for previous Reports.
Headline Risk in the Oil Market Becomes a Formidable Challenge to the Shorts
By MPTrader
* August 23, 2016
Headline risk has returned with a vengeance in the Oil market.
For the better part of August, various comments by Oil producers in general, and Saudi Arabia in particular, about a production ceiling, or even a cut, at the upcoming September OPEC Meeting have underpinned the price advance from $39.19 (Aug 03) to $48.75 (Aug 19).
This morning’s headline risk reared its head again, with a Reuters story indicating that Iran is sending signals to OPEC that it also will join other Members in an effort to boost prices.
In reaction to the story, Oil immediately pivoted to the upside into a 3.6% spike from $46.60 to $48.30.
The sharp upside reversal has the right look of the end of a pullback from $48.75 to $46.49, and the start of a new upleg within the still-dominant advance from the Aug low at $39.19.
If accurate, then this upleg should propel Oil to retest key resistance at $50.00 to the June high at $51.57-- in route to $58.00-$60.00 thereafter.

https://www.mptrader.com/middayminute/
• DiscoverGold
Click on "In reply to", for Authors past commentaries.
Peek Into Crude Oil Future Through Futures
* August 20, 2016
The following are futures positions of non-commercials as of August 16, 2016. Change is week-over-week.
Crude oil: The EIA data for the week ended August 12th, released Wednesday, for the most part favored oil bulls. Spot West Texas Intermediate crude was already up 4.7 percent in the first two sessions. On Wednesday, buyers showed up near the 50-day moving average. By the time the week was over, it was up 10.4 percent.
The daily chart is now extended; on a weekly basis, there is room for more rally. It is a matter of which timeframe wins out.
The June 9th high of $51.67/barrel is 5.2 percent away.
The trend in gasoline continues to be good. Stocks dropped by 2.7 million barrels to 232.7 million barrels – down 26 million barrels from February 12th this year.
Crude stocks decreased 2.5 million barrels to 521.1 million barrels. Inventory is now down 22.3 million barrels from the April 29th high of 543.4 million barrels, which was the highest since the all-time high 545.2 million barrels in October 1929.
Crude imports fell, too, by 211,000 to 8.2 million barrels per day – a four-week low.
Refinery utilization rose 1.3 percentage points to 93.5 percent, which was the highest since the November 27th week last year.
Crude production, on the other hand, rose by 152,000 b/d to 8.6 mb/d. This was a seven-week high. Production peaked at 9.61 mb/d in the June 5th week last year.
Distillate stocks rose by 1.9 million barrels to 153.1 million barrels.
Currently net long 294k, up 27k.

http://www.hedgopia.com/cot-peek-into-future-through-futures-57/
• DiscoverGold.
Click on "In reply to", for Authors past commentaries.
COT - Commitments of Traders in Crude Oil Futures Market Reports
* August 19, 2016

http://www.cotpricecharts.com/commitmentscurrent/index.php
• DiscoverGold.
Click on "In reply to", for previous Reports.
Crude Oil: Bullish Bottom
By Carl Swenlin
* August 14, 2016
In the last week a bullish reverse head and shoulders pattern has emerged on the crude oil chart. Also, the PMO generated a crossover BUY signal as it crossed up through its signal line, increasing, in my opinion, the odds that price will penetrate the neckline.
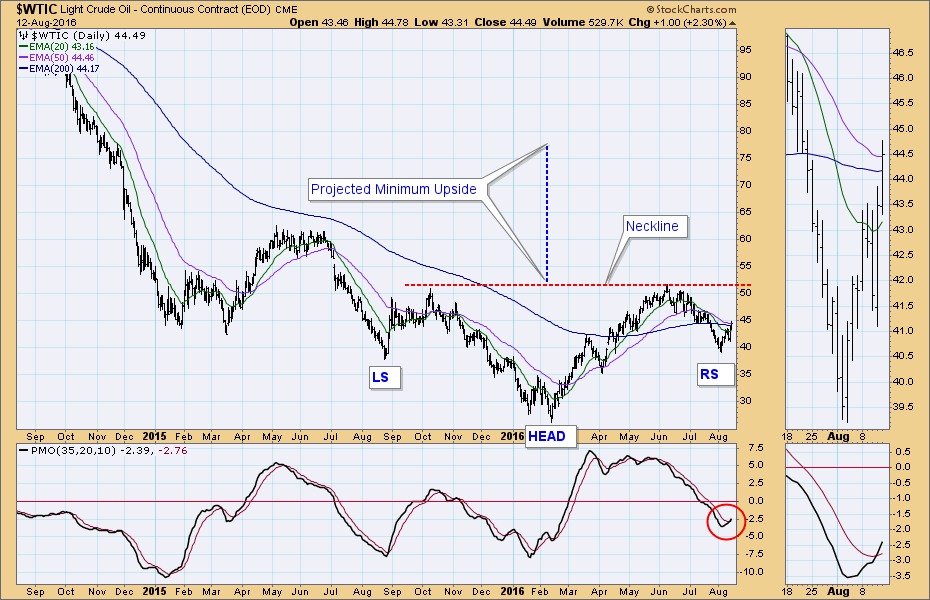
If the neckline is penetrated, the minimum upside target is equal to the distance between the head and the neckline. In this case that is about 77.50, but I think that is a little too ambitious based upon other considerations. On the chart below we can see an horizontal resistance line drawn across the 2015 top at around 62.00. Just above that is a zone of resistance beginning at about 70.00.
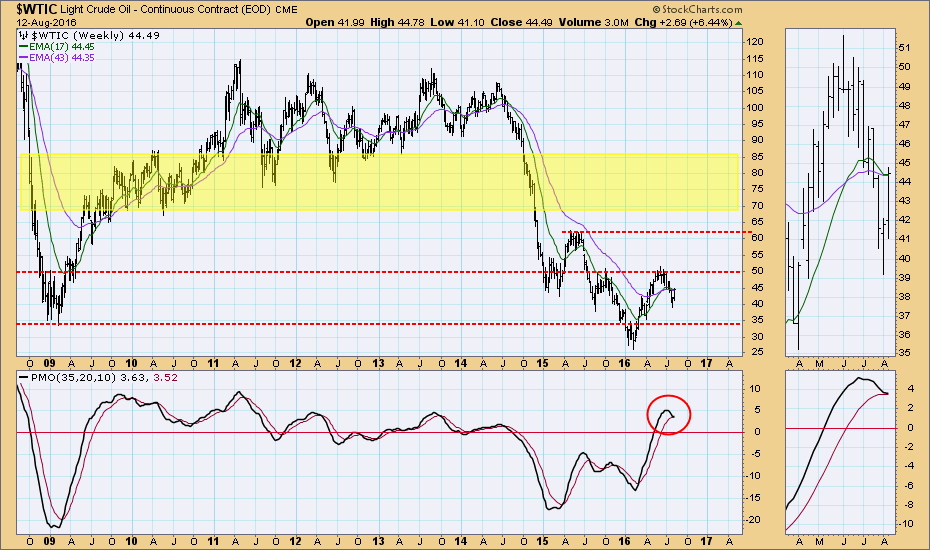
As for positive evidence, the weekly PMO appears ready to bottom right on the signal line. Also, the weekly EMAs are signaling for higher prices, with the 17EMA bottoming just above the 43EMA.
Looking at the price highs earlier in the decade, one might conclude that an upside target above 100.00 might be attainable; however, the supply/demand equation has changed radically since those good old days. Something unexpected would need to happen to overcome this fundamental barrier.
CONCLUSION: A bullish reverse head and shoulders pattern has formed on the crude oil chart. Other positive technicals make me think that the pattern will probably execute, with price breaking above the neckline. However, I don't think that price will make the minimum upside target of 77.50 because of fundamental conditions and overhead resistance.
Technical analysis is a windsock, not a crystal ball.
• DiscoverGold.
Click on "In reply to", for Authors past commentaries.
Peek Into Crude Oil Future Through Futures
* August 13, 2016
The following are futures positions of non-commercials as of August 9, 2016. Change is week-over-week.
Crude oil: Saudi Arabia pumped a record 10.7 million barrels per day in July, and Iran has pushed up production to 3.9 mb/d. In July, OPEC’s crude production rose by 46,000 b/d m/m to 33.1 mb/d. OPEC, along with Russia, is seeing an increase in production. Mexico and the U.S. are going the other way.
In the week ended last Friday, U.S. crude production dropped by another 15,000 b/d to 8.4 mb/d – a five-week low. Production is down meaningfully since peaking at 9.61 mb/d in the June 5th week last year.
Stocks of both gasoline and distillates dropped – the former by 2.8 million barrels to 235.4 million barrels and the latter by two million barrels to 151.2 million barrels. Gasoline stocks have been drawn down by 23.3 million barrels since February 12th this year.
Crude imports dropped, too, by 334,000 b/d to 8.4 mb/d, but the prior week was the highest since October 19, 2012.
Refinery utilization fell by 1.1 percentage points to 92.2 percent – a seven-week low.
Crude stocks jumped 1.1 million barrels to 523.6 million barrels. Inventory is now up 4.1 million barrels in the past three weeks – although down 19.8 million barrels from the April 29th high of 543.4 million barrels, which was the highest since the all-time high 545.2 million barrels in October 1929.
Last week produced a hammer candle on spot West Texas Intermediate crude. This week, it struggled to build on it … until Saudi oil minister’s Thursday remarks about possible action to stabilize prices in OPEC’s informal meeting in late September. The jawboning worked. Spot WTI rallied six percent in that session, breaking out of $42.50-$43.50 resistance, and rallied another 2.3 percent on Friday. Will it stick?
Currently net long 266.9k, down 8.4k.

http://www.hedgopia.com/cot-peek-into-future-through-futures-56/
• DiscoverGold.
Click on "In reply to", for Authors past commentaries.
COT - Commitments of Traders in Crude Oil Futures Market Reports
* August 12, 2016

http://www.cotpricecharts.com/commitmentscurrent/index.php
• DiscoverGold.
Click on "In reply to", for previous Reports.
COT - Commitments of Traders in Crude Oil Futures Market Reports
* August 5, 2016

http://www.cotpricecharts.com/commitmentscurrent/index.php
• DiscoverGold.
Click on "In reply to", for previous Reports.
Peek Into Crude Oil Future Through Futures
* July 30, 2016
The following are futures positions of non-commercials as of July 26, 2016. Change is week-over-week.
Crude oil: The $42.50-$43/barrel support zone on spot West Texas Intermediate crude was lost. It collapsed 21.5 percent from the high seven weeks ago before finding support at its 200-day moving average. The spot remains oversold on a daily chart. That said, there is a ton of resistance overhead.
From the fundamental perspective, this week was not much help.
In the July 22nd week, crude stocks rose by 1.7 million barrels to 521.1 million barrels. This was the first week-over-week increase in 10 weeks. Stocks are now down 22.3 million barrels from the April 29th high of 543.4 million barrels, which was the highest since the all-time high 545.2 million barrels in October 1929.
Gasoline stocks increased 452,000 barrels to 241.5 million barrels, to a 12-week high.
Distillate stocks fell 780,000 barrels to 152 million barrels, to a three-week low.
Crude stocks jumped 303,000 barrels per day to 8.4 million b/d, matching the high five weeks ago. This was the highest since December 2012.
Crude production rose 21,000 b/d to 8.5 mb/d. This was the third straight weekly increase since production bottomed at 8.43 mb/d. Production is still down big since peaking at 9.61 mb/d in the June 5th week last year.
Refinery utilization fell eight-tenths of a point to 92.4 percent.
Currently net long 274.6k, down 24.7k.

http://www.hedgopia.com/cot-peek-into-future-through-futures-54/
• DiscoverGold.
Click on "In reply to", for Authors past commentaries.
Peek Into Crude Oil Future Through Futures
* July 23, 2016
The following are futures positions of non-commercials as of July 19, 2016. Change is week-over-week.
Crude oil: U.S. crude stocks continued to decline – down 2.3 million barrels to 519.5 million barrels in the July 15th week. They are now down 23.9 million barrels from the April 29th high of 543.4 million barrels, which was the highest since the all-time high 545.2 million barrels in October 1929.
Distillate inventory fell as well – by 214,000 barrels to 152.8 million barrels.
Refinery utilization rose nine-tenths of a point to 93.2 percent – the highest since November 27th last year.
Gasoline stocks, however, increased 911,000 barrels to 241 million barrels – an 11-week high.
Production rose as well – by 9,000 barrels per day to 8.49 million b/d. This was the second straight week-over-week increase after production dropped to 8.43 mb/d two weeks ago. Production peaked at 9.61 mb/d in the June 5th week last year.
Crude imports rose by 293,000 b/d to 8.13 mb/d.
During the five sessions prior to Friday, spot West Texas Intermediate crude traded around the declining 10-day moving average before pulling away yesterday. Daily conditions are oversold, but the weekly chart has downside risk still, with support at $42.50-$43. The spot just had a bearish MACD cross-under.
Currently net long 299.3k, down 10.5k.

http://www.hedgopia.com/cot-peek-into-future-through-futures-53/
• DiscoverGold.
Click on "In reply to", for Authors past commentaries.
COT - Commitments of Traders in Crude Oil Futures Market Reports
* July 22, 2016

http://www.cotpricecharts.com/commitmentscurrent/index.php
• DiscoverGold.
Click on "In reply to", for previous Reports.
Peek Into Crude Oil Future Through Futures
* July 16, 2016
The following are futures positions of non-commercials as of July 12, 2016. Change is week-over-week.
Crude oil: OPEC produced nearly 32.9 million barrels per day in June, up 260,000 b/d from May. Between January and May, production averaged just under 32.6 mb/d. Is OPEC winning the market-share war it initiated in 2014?
In the U.S., for instance, crude production peaked at 9.61 mb/d in the June 5th week last year, and has since dropped by more than a million b/d. In the week ended July 8th, production rose 57,000 b/d to 8.5 million b/d.
In the said week, crude imports dropped 522,000 b/d to 7.8 mb/d.
Crude stocks fell as well, by 2.6 million barrels to 521.8 million barrels. They are now down 21.6 million barrels from the April 29th high of 543.4 million barrels, which was the highest since the all-time high 545.2 million barrels in October 1929.
Gasoline and distillate stocks, however, rose – by 1.2 million barrels and 4.1 million barrels to 240.1 million barrels and 153 million barrels, respectively.
Refinery utilization decreased two-tenths of a point to 92.3 percent.
Bulls must be hoping spot West Texas Intermediate crude is able to stabilize around here. On a daily basis, conditions are oversold. That said, on the weekly chart, there is downside risk still, with support at $42.50-$43.
Currently net long 309.7k, down 8.8k.

http://www.hedgopia.com/cot-peek-into-future-through-futures-52/
• DiscoverGold.
Click on "In reply to", for Authors past commentaries.
COT - Commitments of Traders in Crude Oil Futures Market Reports
* July 15, 2016

http://www.cotpricecharts.com/commitmentscurrent/index.php
• DiscoverGold.
Click on "In reply to", for previous Reports.
Peek Into Crude Oil Future Through Futures
* July 9, 2016
The following are futures positions of non-commercials as of July 5, 2016. Change is week-over-week.
Crude oil: The seven weeks of sideways action after a nearly doubling of the price in four months was resolved this week – by breaking to the downside. Spot West Texas Intermediate crude lost 8.4 percent for the week, losing $46/barrel a support as well as the 50-day moving average.
Continuation of good news on the stocks front did not help. Technicals prevailed.
In the week ended July 1st, crude stocks fell by 2.2 million barrels to 524.4 million barrels. They are now down 19 million barrels from the April 29th high of 543.4 million barrels, which was the highest since the all-time high 545.2 million barrels in October 1929.
Gasoline stocks declined 122,000 barrels to 238.9 million barrels. And distillate stocks contracted 1.6 million barrels to 148.9 million barrels – the lowest in seven months.
U.S. production continues to drop, down another 194,000 barrels per day to 8.4 million b/d. Production peaked at 9.61 mb/d in the June 5th week last year.
Crude imports, however, rose 808,000 barrels to 8.4 mb/d. Plus, refinery utilization fell five-tenths a point to 92.5 percent; the prior week was a 29-week high.
On the weekly chart, there is plenty of downside risk still, with support at $42.50-$43, followed by the 200-day moving average ($41.11).
Currently net long 318.5k, down 752.

http://www.hedgopia.com/cot-peek-into-future-through-futures-51/
• DiscoverGold.
Click on "In reply to", for Authors past commentaries.
COT - Commitments of Traders in Crude Oil Futures Market Reports
* July 8, 2016

http://www.cotpricecharts.com/commitmentscurrent/index.php
• DiscoverGold.
Click on "In reply to", for previous Reports.
Peek Into Crude Oil Future Through Futures
* June 11, 2016
The following are futures positions of non-commercials as of June 7, 2016. Change is week-over-week.
Crude oil: Saudi Arabia Sunday cut its oil prices for July deliveries to Europe. The move comes after OPEC last week failed to reach a deal on production ceiling. The price drop must have surprised many as demand tends to grow in the second half.
The Saudis are probably responding to Iran’s resumption this February of crude exports to the EU. It is a market share issue. Markets pretty much ignored this, but liked what they saw in U.S. crude stockpile.
For the week to June 3rd, U.S. crude inventory dropped by another 3.2 million barrels to 532.5 million barrels. Inventory is now down 10.9 million barrels from the April 29th high of 543.4 million barrels, which was the highest since the all-time high 545.2 million barrels in October 1929.
Crude imports dropped, too – by 134,000 barrels per day to 7.7 million b/d.
Plus, refinery utilization rose to a nine-week high of 90.9 percent.
Other details were not as good.
Gasoline and distillate inventory both rose – the former by one million barrels to 239.6 million barrels and the latter by 1.8 million barrels to 151.4 million barrels. Both are down from recent highs – gasoline from the February 12th high of 258.7 million barrels and distillates from the January 8th high of 165.6 million barrels.
Crude production rose by 10,000 b/d to 8.75 mb/d. This was the first weekly increase in 13 weeks. Production peaked at 9.61 mb/d in the June 5th week last year.
By Wednesday, spot West Texas Intermediate crude had rallied another 5.4 percent, and then dropped hard the next couple of sessions, ending the week flat.
Amidst heavy overbought conditions, the weekly chart produced a shooting star. Daily shorter-term moving averages are now flat to slightly down. Crude wants to go lower.
Currently net long 329.9k, down 33.4k.

http://www.hedgopia.com/cot-peek-into-future-through-futures-47/
• DiscoverGold.
Click on "In reply to", for Authors past commentaries.
COT - Commitments of Traders in Crude Oil Futures Market Reports
* June 10, 2016

http://www.cotpricecharts.com/commitmentscurrent/index.php
• DiscoverGold.
Click on "In reply to", for previous Reports.
Peek Into Crude Oil Future Through Futures
* June 4, 2016
The following are futures positions of non-commercials as of May 31, 2016. Change is week-over-week.
Crude oil: There you go!
After all the pre-meeting talk/rumors of an impending deal, OPEC on Thursday failed to agree on a new production ceiling.
With no deal, and crude oil having rallied big into the meeting – nearly 93 percent between the February 11th low and the May 26th high – the odds of a pullback have grown. The question is of magnitude and duration.
Needless to say, spot West Texas Intermediate crude remains overbought. There is plenty of unwinding left on a weekly chart. That said, daily momentum is yet to break, with the 10-day moving average flattish and the 20-day still pointing up.
The path of least resistance remains down.
On Thursday, post-OPEC disappointment, crude was under pressure, but the weakness was bought, reacting to the U.S. weekly data.
For the week ended May 27th, inventory was down across the board.
Crude stockpile dropped by another 1.4 million barrels to 535.7 million barrels. Inventory is now down 7.7 million barrels from the April 29th high of 543.4 million barrels, which was the highest since the all-time high 545.2 million barrels in October 1929.
Gasoline stocks fell by 1.5 million barrels to 238.6 million barrels. Inventory is now down by 20 million barrels from the February 12th high of 258.7 million barrels.
Along the same lines, distillate inventory fell by 1.3 million barrels to 149.6 million barrels – now down 15.9 million barrels from the January 8th high of 165.6 million barrels.
Crude production, too, fell, by another 32,000 barrels per day to 8.74 million b/d. This was the 12th straight weekly drop and eighth sub-nine mb/d. Production peaked at 9.61 mb/d in the June 5th week last year.
Refinery utilization rose one-tenth of a point to 89.8 percent.
On the negative side, crude imports increased by 524,000 b/d to 7.84 mb/d – a six-week high.
Currently net long 363.3k, down 1.8k.

http://www.hedgopia.com/cot-peek-into-future-through-futures-46/
• DiscoverGold.
Click on "In reply to", for Authors past commentaries.
COT - Commitments of Traders in Crude Oil Futures Market Reports
* June 3, 2016

http://www.cotpricecharts.com/commitmentscurrent/index.php
• DiscoverGold.
Click on "In reply to", for previous Reports.
Clive Maund: OIL UPDATE - HAS THE ADVANCE FINALLY RUN OUT OF STEAM?...
* May 30, 2016
It still looks like oil is topping out here at about the $50 level after its substantial recovery uptrend from its February low. While we cannot be sure until it breaks down from its uptrend, the chances of its doing so soon look high for various reasons. One is that the current intermediate uptrend has been going on for a long time now and has resulted in a persistent overbought condition. Another is that it is quite some way above its 200-day moving average, which although it has turned up, is still only rising gently. Another is that it has arrived at resistance at the upper boundary of a trading range that developed last Fall. Still another is that its latest COT looks bearish, with Commercial short and Large Spec long positions being at their highest for about a year. Finally, the broad market looks ready to roll over, after its rally up to resistance of recent days, and if it does it is likely to take oil down with it, probably against the background of a continued rise in the dollar.
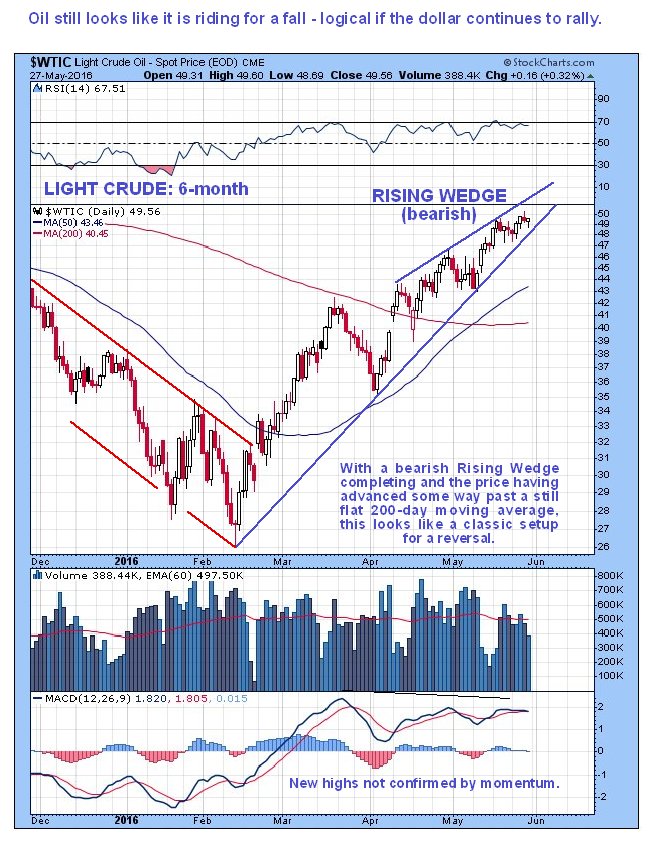
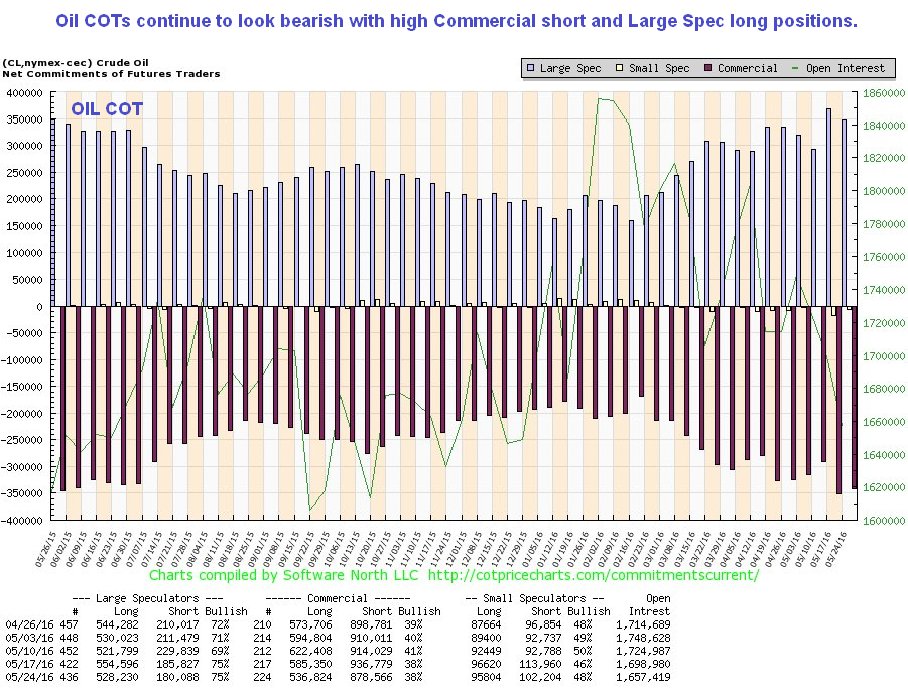
The 1-year chart shows that the advance has brought Light Crude up to a zone of significant resistance where it appears to be stalling out. This is a good point for it to turn down again, probably in tandem with the broad market…
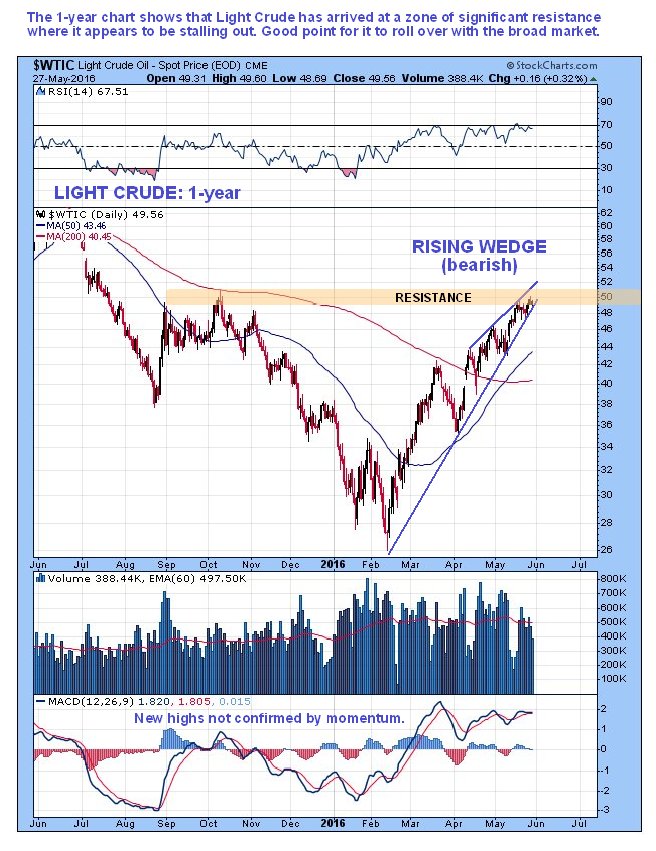
In the light of what we are observing on these charts, the 22nd May article in ZeroHedge entitled Something Stunning is Taking Place off the Coast of Singapore makes very interesting reading. The conclusion is that with the contango narrowing, the gigantic offshore glut will come ashore and the oil price won’t just drop, it will crash.
http://www.clivemaund.com/article.php?art_id=3819
• DiscoverGold.
Click on "In reply to", for Authors past commentaries.
Peek Into Crude Oil Future Through Futures
* May 28, 2016
The following are futures positions of non-commercials as of May 24, 2016. Change is week-over-week.
Crude oil: OPEC meets on June 2nd (Thursday). Crude oil has rallied strongly into the meeting. The likes of Angola, Nigeria, and Venezuela have suffered a lot from the drop in oil. But they don’t carry much weight within the cartel.
It is probably unrealistic to expect Saudi Arabia to deviate from its market-share goals. As is to expect Iran to agree to a production cutback. In fact, the latter on Sunday did say it had no plan to halt a rise in production and exports. Its crude exports, excluding gas condensates, are two million barrels per day currently and would reach 2.2 mb/d by the end of summer.
Markets currently are focused on the positives.
For the week ended May 20th, U.S. crude stockpile dropped by 4.2 million barrels to 537.1 million barrels. Inventory is now down 6.3 million barrels from the April 29th high of 543.4 million barrels, which was the highest since the all-time high 545.2 million barrels in October 1929.
Crude imports fell, too, down 362,000 barrels per day to 7.3 million b/d.
Crude production fell by another 24,000 b/d, to 8.77 mb/d. This was the 11th straight weekly drop and seventh sub-nine mb/d. Production peaked at 9.61 mb/d in the June 5th week last year.
Also declining was distillate inventory, down 1.3 million barrels to 150.9 million barrels. This was a sixth straight weekly drop.
Gasoline stocks, however, were up two million barrels to 240.1 million barrels. Also, refinery utilization decreased eight-tenths of a percent to 89.7 percent.
For the week, spot West Texas Intermediate crude was up another 2.2 percent – its seventh positive week in the past eight. Extended, yes, but momentum is intact, with the crude rallying along its upward-sloping 10-day moving average. It needs to drop north of five percent to go test its 20-day moving average.
Currently net long 365.1k, down 6k.

http://www.hedgopia.com/cot-peek-into-future-through-futures-45/
• DiscoverGold.
Click on "In reply to", for Authors past commentaries.
COT - Commitments of Traders in Crude Oil Futures Market Reports
* May 27, 2016

http://www.cotpricecharts.com/commitmentscurrent/index.php
• DiscoverGold.
Click on "In reply to", for previous Reports.
Peek Into Crude Oil Future Through Futures
* May 21, 2016
The following are futures positions of non-commercials as of May 17, 2016. Change is week-over-week.
Crude oil: The weekly EIA report was mixed to slightly better.
For the week ended May 13th, crude stocks rose 1.3 million barrels to 541.3 million barrels, less than four million barrels from the all-time high 545.2 million barrels in October 1929. Plus, crude imports increased 22,000 barrels per day to 7.7 million b/d – a four-week high.
On the positive side, refinery utilization rose 1.4 percentage points to 90.5 percent – a six-week high.
Crude production continued to slide, this time by 11,000 b/d to 8.8 mb/d. This was the sixth straight sub-nine mb/d. Production peaked at 9.61 mb/d in the June 5th week last year.
And stocks of both gasoline and distillates fell – the former by 2.5 million barrels to 238.1 million barrels and the latter by 3.2 million barrels to 152.2 million barrels.
Spot West Texas Intermediate crude continued to rally – up another 2.9 percent for the week, and its sixth positive week in the past seven. Momentum, no matter how overbought, is intact, with shorter-term moving averages pointing up. Ditto with the 50-day, with the 200-day flat to slightly rising. That said, some signs of potential weakness are showing up on a daily chart.
Currently net long 371.2k, up 76.2k.

http://www.hedgopia.com/cot-peek-into-future-through-futures-44/
• DiscoverGold.
Click on "In reply to", for Authors past commentaries.
Crude Oil Fund (USO) - Daily & 60 min Charts
* May 20, 2016
Daily
http://stockcharts.com/public/1107832/chartbook/308234315;
60 min
http://stockcharts.com/public/1107832/chartbook/308234316;
• DiscoverGold.
COT - Commitments of Traders in Crude Oil Futures Market Reports
* May 20, 2016

http://www.cotpricecharts.com/commitmentscurrent/index.php
• DiscoverGold.
Click on "In reply to", for previous Reports.
Peek Into Crude Oil Future Through Futures
* May 14, 2016
The following are futures positions of non-commercials as of May 10, 2016. Change is week-over-week.
Crude oil: Global oil markets are heading towards an equilibrium, says the International Energy Agency.
OPEC is not seeing a decline in production, non-OPEC is.
OPEC member Iran’s crude oil production apparently jumped to 3.6 million barrels per day, back to pre-2012 sanction levels. And it is seeking to win back market share. On Tuesday, it cut crude prices versus Saudi Arabia and Iraq, setting the June official selling price for Iranian heavy crude at $1.60 a barrel below the Oman/Dubai average.
At least in the U.S., production is declining. For the week ended May 6th, production fell 23,000 b/d to 8.8 mb/d. This was the fifth consecutive sub-nine mb/d. Production peaked at 9.61 mb/d in the June 5th week last year.
Help also came from crude imports, which dropped 5,000 b/d to 7.7 mb/d.
Stocks were down as well. For the first time in five weeks, crude inventory fell – by 3.4 million barrels to 540 million barrels. The preceding week’s total was a mere 1.8 million barrels from the all-time high 545.2 million barrels in October 1929.
Gasoline and distillate stocks fell as well – the former by 1.2 million barrels to 240.6 million barrels, and the latter by 1.6 million barrels to 155.3 million barrels.
The only downer was refinery utilization which fell six-tenths of a percentage point to 89.1 percent.
Spot West Texas Intermediate crude continued to rally – up 5.3 percent for the week. Kudos to oil bulls who for the third week running defended $43.50 support.
Currently net long 295k, down 24k.

http://www.hedgopia.com/cot-peek-into-future-through-futures-43/
• DiscoverGold.
Click on "In reply to", for Authors past commentaries.
COT - Commitments of Traders in Crude Oil Futures Market Reports
* May 13, 2016

http://www.cotpricecharts.com/commitmentscurrent/index.php
• DiscoverGold.
Click on "In reply to", for previous Reports.
Almanac Trader: Crude’s rally running on seasonal fumes
* May 9, 2016
Over the past 31 years (solid green line), crude oil has generally enjoyed a solid seasonal rally from late-January or February until the end of September. This rally was the result of refiners ramping up production of gasoline in anticipation of the summer driving season in the U.S. The rally would propel crude oil briskly higher until about May or so and then actual driving demand would usually pull crude higher during the summer months at a slower pace. The annual high would be reached when refiners struggled to meet gasoline demand while trying to build heating oil inventories in late summer and early fall.

However, in the more recent 11- and 5-year timeframes (orange & red lines respectively) the pattern has shifted. The U.S. auto fleet is becoming increasingly more fuel efficient and crude oil supplies have been more than ample which has resulted in bloated inventories and a briefer seasonally favorable period. Over the past 11 years, crude oil price on average as peaked in June or July and over the last 5 years the average peak has been in early May. Based upon the 5-Year Seasonal Pattern, the bulk of crude’s gains are likely over. Crude is not likely to collapse like in recent years. Instead a trading range from $38 to $46 per barrel is more likely. At least until demand catches up with excess supply or the U.S. dollar weakens further.
http://jeffhirsch.tumblr.com/post/144114180538/crudes-rally-running-on-seasonal-fumes
• DiscoverGold.
Peek Into Crude Oil Future Through Futures
* May 7, 2016
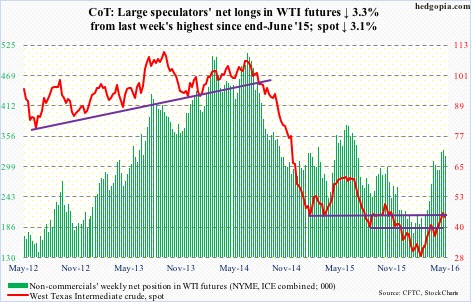
The following are futures positions of non-commercials as of May 3, 2016. Change is week-over-week.
Crude oil: Wildfire in Canada’s oil-sands district helped crude-oil prices. So did tensions between rival factions in Libya. Although not enough to stop spot West Texas Intermediate crude from dropping 2.9 percent – its first negative week in five.
The long-legged doji last Friday proved prescient.
That said, bulls should take heart from the fact that broken-resistance-turned support at $43.50 is intact. With weekly conditions as overbought as they are, one wonders how long that support holds.
Fundamentally, for the week ended April 29th, U.S. crude inventory continued to rise, up another 2.8 million barrels to 543.4 million barrels. In the past 17 weeks, stocks have gone up by 61.1 million barrels, and are inching ever closer to the all-time high 545.2 million barrels in October 1929.
Gasoline stocks, too, rose – for the second week running – by 536,000 barrels to 241.8 million barrels. And last but not the least, crud imports rose 110,000 barrels per day to 7.7 million b/d.
On the positive side, crude production continued to slide, this time dropping 113,000 b/d to 8.8 mb/d. This was the fourth consecutive sub-nine mb/d. Production peaked at 9.61 mb/d in the June 5th week last year.
As well, distillate stocks fell by another 1.3 million barrels to 157 million barrels. In the past three weeks, stocks have declined by 6.5 million barrels. And, refinery utilization rose 1.6 percentage points to 89.7.
Currently net long 318.9k, down 10.9k.
http://www.hedgopia.com/cot-peek-into-future-through-futures-42/
• DiscoverGold.
Click on "In reply to", for Authors past commentaries.
COT - Commitments of Traders in Crude Oil Futures Market Reports
* May 6, 2016

http://www.cotpricecharts.com/commitmentscurrent/index.php
• DiscoverGold.
Click on "In reply to", for previous Reports.
Crude Oil Fund (USO) - Daily & 60 min Charts
* May 3, 2016
Daily
http://stockcharts.com/public/1107832/chartbook/308234315;
60 min
http://stockcharts.com/public/1107832/chartbook/308234316;
• DiscoverGold.
|
Followers
|
36
|
Posters
|
|
|
Posts (Today)
|
0
|
Posts (Total)
|
1958
|
|
Created
|
11/03/09
|
Type
|
Free
|
| Moderator 4Godnwv | |||
| Assistants DiscoverGold | |||

![]()
| Volume | |
| Day Range: | |
| Bid Price | |
| Ask Price | |
| Last Trade Time: |
