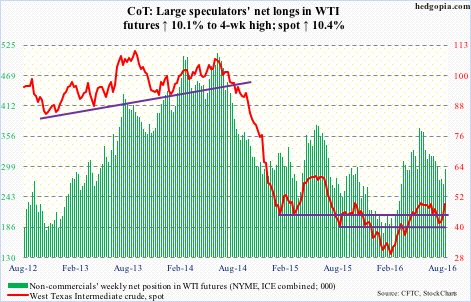
The following are futures positions of non-commercials as of August 16, 2016. Change is week-over-week.
Crude oil: The EIA data for the week ended August 12th, released Wednesday, for the most part favored oil bulls. Spot West Texas Intermediate crude was already up 4.7 percent in the first two sessions. On Wednesday, buyers showed up near the 50-day moving average. By the time the week was over, it was up 10.4 percent.
The daily chart is now extended; on a weekly basis, there is room for more rally. It is a matter of which timeframe wins out.
The June 9th high of $51.67/barrel is 5.2 percent away.
The trend in gasoline continues to be good. Stocks dropped by 2.7 million barrels to 232.7 million barrels – down 26 million barrels from February 12th this year.
Crude stocks decreased 2.5 million barrels to 521.1 million barrels. Inventory is now down 22.3 million barrels from the April 29th high of 543.4 million barrels, which was the highest since the all-time high 545.2 million barrels in October 1929.
Crude imports fell, too, by 211,000 to 8.2 million barrels per day – a four-week low.
Refinery utilization rose 1.3 percentage points to 93.5 percent, which was the highest since the November 27th week last year.
Crude production, on the other hand, rose by 152,000 b/d to 8.6 mb/d. This was a seven-week high. Production peaked at 9.61 mb/d in the June 5th week last year.
Distillate stocks rose by 1.9 million barrels to 153.1 million barrels.
Click on "In reply to", for Authors past commentaries.
Information posted to this board is not meant to suggest any specific action, but to point out the technical signs that can help our readers make their own specific decisions. Your Due Dilegence is a must! • DiscoverGold
Register for free to join our community of investors and share your ideas. You will also get access to streaming quotes, interactive charts, trades, portfolio, live options flow and more tools.


 News
News  Market Data
  Discover