The following are futures positions of non-commercials as of August 30, 2016. Change is week-over-week.
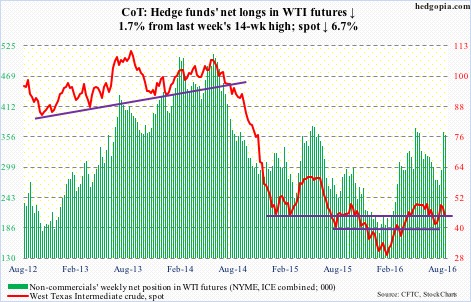
Crude oil: The failure two weeks ago to break out of a potentially bullish reverse head-and-shoulders formation is proving costly for spot West Texas Intermediate crude. After last week’s three-percent drop, it dropped another 6.7 percent this week.
Momentum was already down. Come Wednesday, the spot suffered a daily bearish MACD cross, also losing the declining 50-day moving average. The 200-day – flattish – is 7.9 percent away. Wednesday’s EIA data was not much help.
In the week ended August 26th, crude stocks rose by 2.3 million barrels to 525.9 million barrels – a nine-week high.
Distillate stocks increased by 1.5 million barrels to 154.8 million barrels – a 16-week high.
Crude imports were up 275,000 barrels per day to 8.9 million b/d – the highest since September 14, 2012.
Gasoline stocks, however, fell by 691,000 barrels to 232 million barrels. This was the lowest since January 1st this year.
Refinery utilization rose three-tenths of a point to 92.8 percent.
Last but not the least, crude production fell by 60,000 b/d to 8.49 mb/d. Production peaked at 9.61 mb/d in the June 5th week last year.
Off the August 19th high of $49.36, the spot is now down five points. Support at $43-$43.50 has taken on a new significance. It was defended on Thursday and Friday.
Click on "In reply to", for Authors past commentaries.
Information posted to this board is not meant to suggest any specific action, but to point out the technical signs that can help our readers make their own specific decisions. Your Due Dilegence is a must! • DiscoverGold
Register for free to join our community of investors and share your ideas. You will also get access to streaming quotes, interactive charts, trades, portfolio, live options flow and more tools.


 News
News  Market Data
  Discover