The following are futures positions of non-commercials as of October 4, 2016.
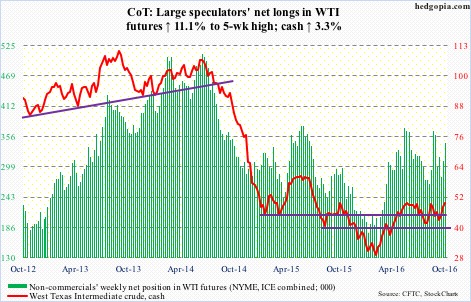
Crude oil: Spot West Texas Intermediate crude managed to break out of the declining trend line drawn from May last year. The June 9th high of $51.67/barrel has now taken on greater significance. Until that high gets taken out, crude remains range bound, with the August 3rd low of $39.19 on the bottom end.
This week, the EIA data helped trader sentiment as well.
In the week ended September 30, U.S. crude stocks fell by three million barrels to 499.7 million barrels – the lowest since January 22 this year.
Distillate stocks dropped, too, by 2.4 million barrels to 160.7 million barrels.
Crude imports fell by 125,000 barrels per day to 7.7 million b/d.
Ditto with crude production, which declined by 30,000 b/d to 8.47 mb/d. Production peaked at 9.61 mb/d in the June 5th week last year.
Refinery utilization, however, fell from 90.1 to 88.3 percent – a 23-week low.
And gasoline stocks rose by 222,000 barrels to 227.4 million barrels.
Spot WTI remains overbought on the daily chart. It has been trading along a rising trend line from February lows, so the recent breakout could prove to be important, should it manage to take out the June 9th high. On the other hand, price likely retreats near term. The February trend line gets tested around $45.
Click on "In reply to", for Authors past commentaries
Information posted to this board is not meant to suggest any specific action, but to point out the technical signs that can help our readers make their own specific decisions. Your Due Dilegence is a must! • DiscoverGold
Register for free to join our community of investors and share your ideas. You will also get access to streaming quotes, interactive charts, trades, portfolio, live options flow and more tools.


 News
News  Market Data
  Discover