Register for free to join our community of investors and share your ideas. You will also get access to streaming quotes, interactive charts, trades, portfolio, live options flow and more tools.
months until markets bottom out...I expected last 2 weeks to be down down down to November levels...that's why I don't trade I can't foretell the future and I can't see the cycles coming until after the fact...only thing I see is a reversal for RUT to the 200 MA...maybe next week a little pullback so I can exit TZA and wait for another re-entry and test my thoughts of shorting TNA at the same time...worth the $$$ for this little experiment...
What time period are you talking about?
TNA fell more than TZA went up, so wouldn't shorting TNA be wiser??? I understand all the decay...I look at it playing hop bets in craps vs just playing place bets...I made my mistake buying TZA too early, shoulda waited until Dec...but I was also expecting a cliff like in 2018...this sideways movement is weird...I could go half and half and see which one prevails...lol...
You absolutely don't want to short TNA if you want to be short, go long TZA. There is an effect that goes by many names, such as creep, decay, etc. Me expericence tells me holding a 3x in the direction the funds were intended and there is a gain, I can expect an increase in gain in a 3x fund vs holding the same in a 1x fund. I have seen this over and over.
The issue is chop. Imagine prices being in channel moving up and down 15% over and over. So if a $1000 investment dropped -15% to 850, then gained 15%, the balance would only be $977.50. $22.50 was lost on the cycle.
For an equivalent investment of $3000 in a 1x fund moving in a 5% channel, the fund would drop to $2850 and move back to 2992.5. The lost would only be $7.5.
But as the up cycles become larger than the down cycles, the 3x funds start to shine.
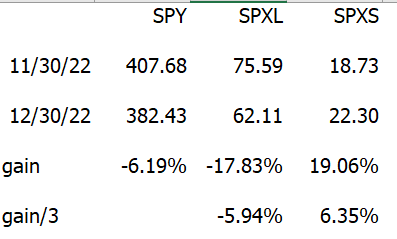
Here the data for SPY, SPXL and SPXS for Dec. Since the month was a down month, the SPXS was the best fund to invest in and save 2/3 of your capital to boot.
I bot TZA too soon...I miss judged my timing...shoulda waited for December but I am anticipating markets falling more so no reason to sell I'm not that lucky to trade the cycles...hence the reason to short TNA rather than buy TZA...that way I'm taking advantage of the decay too...hopefully I can time it right and exit TZA when it's higher than TNA then wait for TNA to rebound then short TNA...but only going to do this once to switch my position then i will hold for another month or so maybe longer...
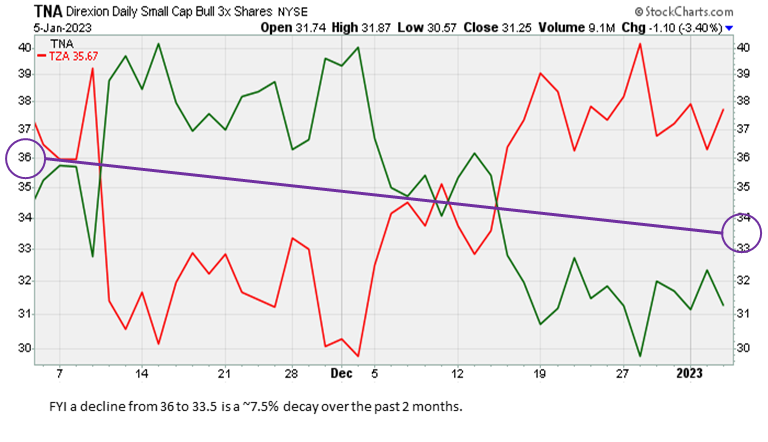
2 months is a long time to be holding a 3x ETF. Below is the estimated decay for your example.
Approximately a 7.5% 'holding cost' is represented by the purple decay line I drew on the ETF pair chart below. The sideways chop the market has been going through the past few weeks would make this decay more noticeable too.
The 1x ETF would remain basically unchanged during sideways chop, but a 2x, and more so a 3x ETF of the same equity would display decay. GLTY
https://stockcharts.com/h-sc/ui?s=TNA&p=D&yr=0&mn=2&dy=0&id=p14976638344
I've held TZA since November 2 @33.5 TNA was at that time prolly 37...so I think it would have been better to sell short TNA...didn't know i could do that with my account but I tested it a few minutes ago and it was giving me clearance...
I have heard of this strategy being used when holding leveraged 2x or 3x ETF's over a longer time period, like 4-6 weeks or longer when decay is more impactful. I have never applied this strategy myself.
I typically do not hold a leveraged ETF for more than 10 days to two weeks, a time period where the decay is not as impactful.
I believe DUMA has talked about this strategy a time or two on his board. GLTY
https://investorshub.advfn.com/boards/read_msg.aspx?message_id=170245769&txt2find=shorting+etf
ahwile back we talked about decay with ETF pairs...finally noticing the TNA/TZA decay...is it beneficial to short TNA vs buying TZA???
Did you sign up for the bootcamp?
Thank you. I have looked at that ETF pair before and found they do not trade frequently enough to chart well for me.
With the coldest December in a generation just concluding, I expect the NatGas withdraw numbers in tomorrow's weekly report to be epic.
https://ir.eia.gov/ngs/ngs.html
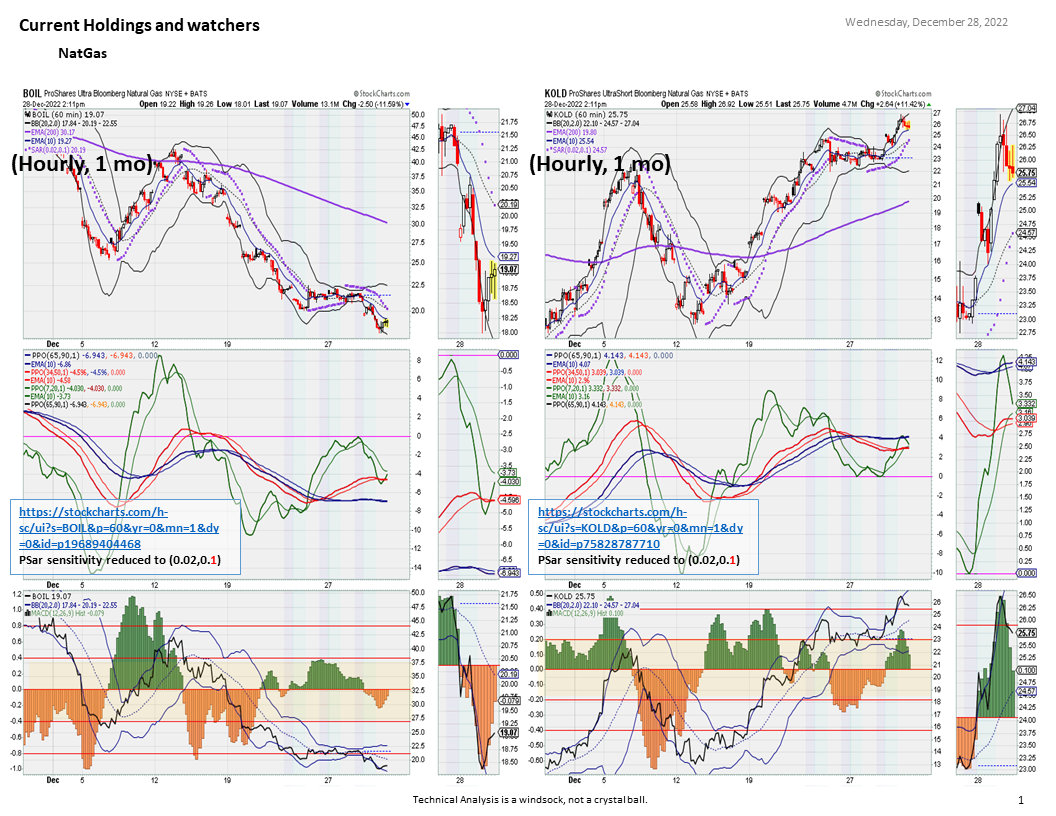
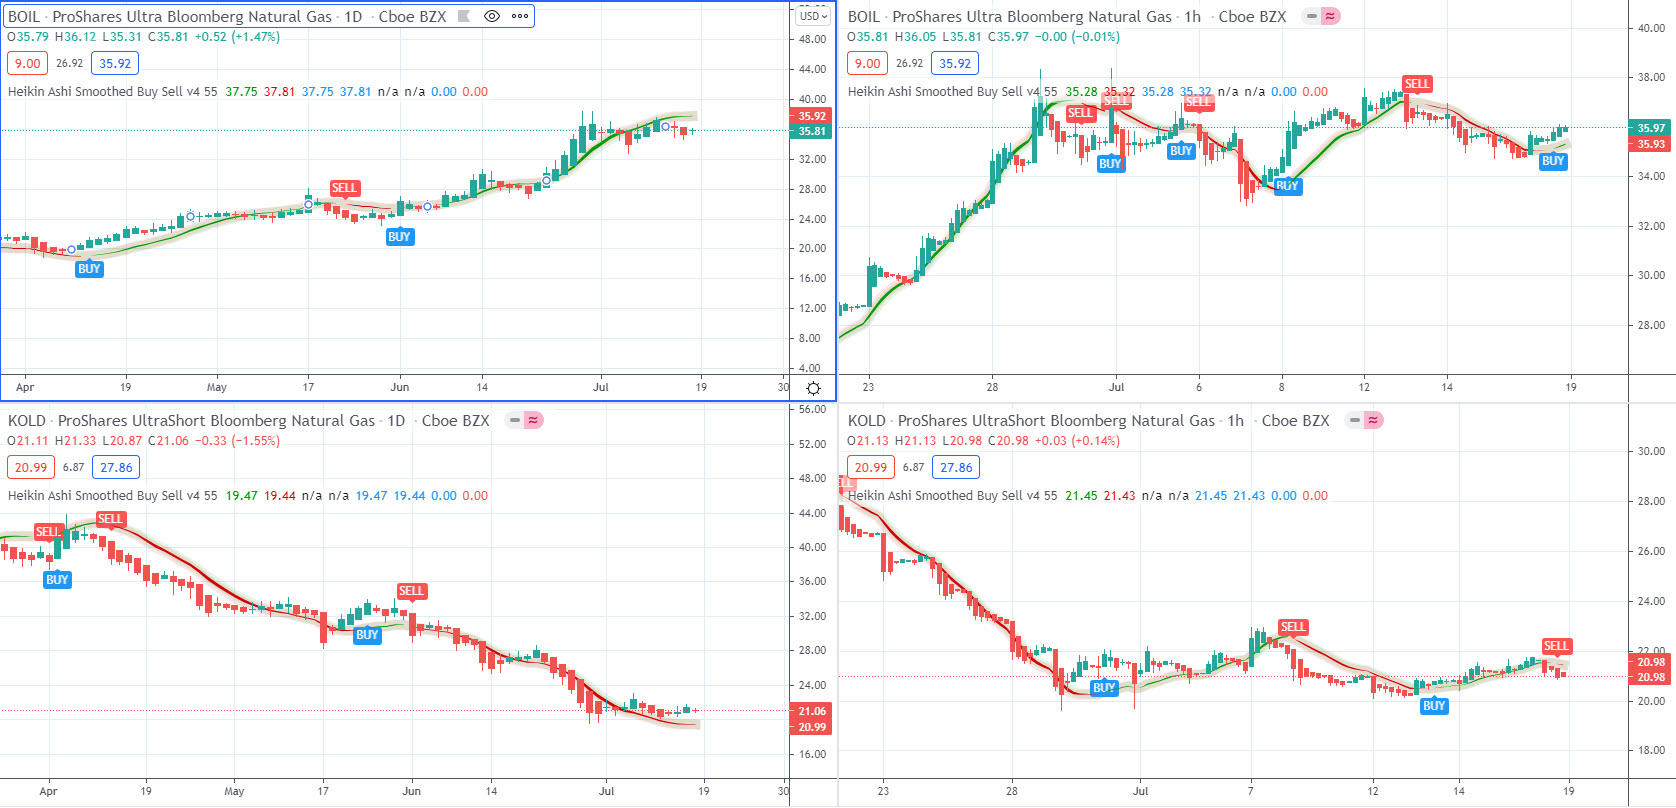
My BOIL/KOLD chart pair (below) may flip from KOLD to BOIL soon. The KOLD run just concluding was a nice Christmas gift. GLTY
https://stockcharts.com/h-sc/ui?s=BOIL&p=60&yr=0&mn=1&dy=0&id=p19689404468
https://stockcharts.com/h-sc/ui?s=KOLD&p=60&yr=0&mn=1&dy=0&id=p75828787710
Merry Christmas and Happy New Year and thanks for the update!
Still believing in the basic thesis
https://investorshub.advfn.com/boards/read_msg.aspx?message_id=169688195
2020 Pandemic Year
2021 Supply Chain Year
2022 Inflation Year
2023 Recession Year
2024 and beyond - the flat recovery years
I am transitioning out of the ETF Optimizer portfolio which I must say I was really happy with in the first part of the year, but I saw it get tossed around in the second half of the year and they really seem to be adjusting their system on the fly trying to figure out the market turns.
I have stayed with Scott and team in their NEB group (mastermind). One of the more interesting themes and ideas brought to my attention is an ETF DBMF. It is a managed futures ETF utilizing a trend following system which in my simple mind keeps shuffling the leaders to the top of the deck of holdings and discards the laggards.
https://www.etftrends.com/managed-futures-channel/invest-in-the-trends-of-a-market-on-the-move-with-dbmf/
The trend following structure of the ETF I think (hope) smooths out the overall performance. The outperformance is there over it's brief history. The fees are low. It has a built-in sector diversification. As an ETF it fits the IRA approach nicely. I did make inquiries into different managed futures hedge funds that have lower initial investment thresholds, but can't beat the IRA at this stage for me. So DBMF works (until it doesn't).
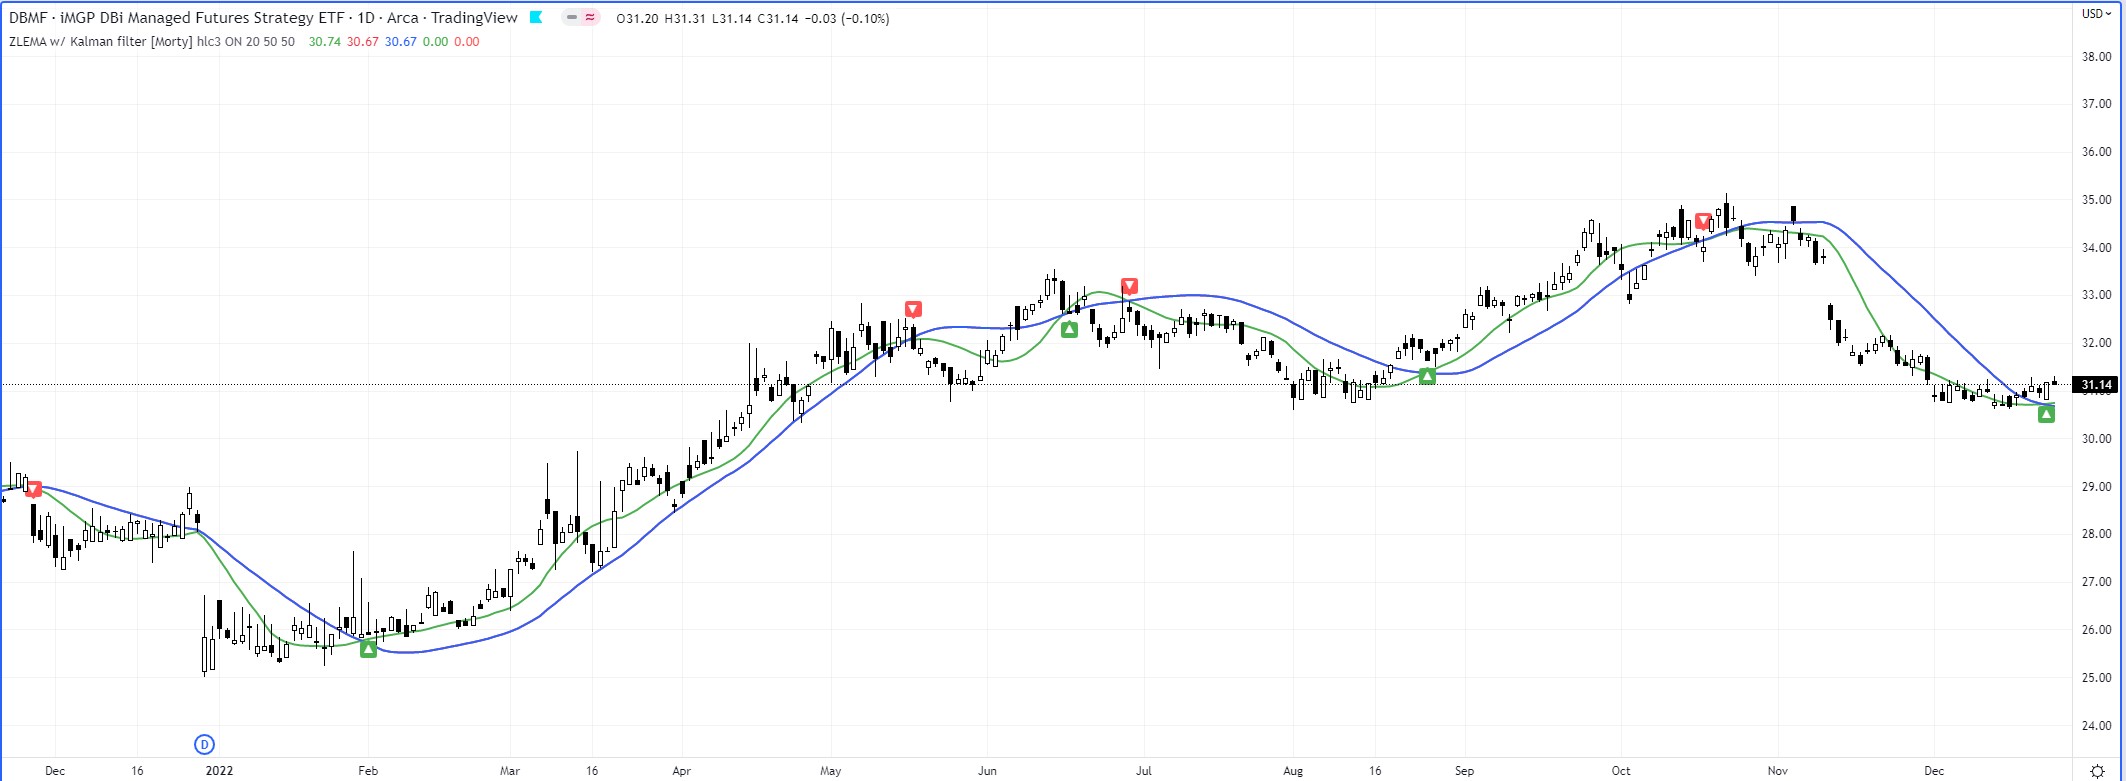
Here is a variation that I have been working with...which is to take DBMF and .apply a simple crossover approach to holding a position in it. In other words, instead of buying at any given point and time and letting the ETF algos manage the market fluctuations use a simple crossover technique to try to avoid the bigger drawdowns and improve the overall performance.
* Simple Kalman Filter 20/50 Crossover system. Indicator available on Trading View (search for "ZELMA w/Kalman Filter [Morty]". The Kalman filter is hailed by Mole from RPQ Unlimited which he uses in his Gravitas system. The Kalman filter moving averages produce faster signals that SMA or EMA on their own IMHO.
** For my simple crossover approach I used the highest price on the day following the Buy signal to buy and the lowest price on the day following a Sell signal to sell to keep it less than optimized.
So using all of 2022 data, DBMF from the first trading day of the year stands at +20.74%. By using the crossover method described above yields a performance of +25.49%. Just one isolated year out of a very short history but I like the ETF on it's own to build a substantial position. There were 3 Buy and Sell turns in 2022. So very little "action" which is nice but not buy-and-hold either. A fourth Buy signal just happened last Thursday.
Other than this late activity in the last couple of months I've been staying pretty safe on the sideline and developing a strong sense that that is not the place to be either.

A prosperous 2023 to us all!
I don't know and I don't care to analyze history.
I don't know and I don't care if the economy is stronger or weaker.
I don't know and I don't care to analyze time periods between cycles.
All I care about is what the market and sector charts are saying to me today.
To do this, I break down the market into the 11 SPDR sectors and add 3 overall market indicators. Jaws and Duma call these 'the big three'. I create a bullish percent or breadth indicator for each sector and each of the three market indicators. The 3 Big Three market indicators are the S&P 500, the Nasdaq 100, and the Russell 2000. So 14 total.
The 11 sectors are - https://www.sectorspdr.com/sectorspdr/
https://seekingalpha.com/article/4475586-stock-market-sectors?gclid=Cj0KCQiAqOucBhDrARIsAPCQL1Z5TEh5r4l-pb4hB0YhiVZbq2goztclmAJuY-UBZGtlfZQUs2Xa9zcaAqXiEALw_wcB&internal_promotion=true&utm_campaign=15199871039&utm_medium=cpc&utm_source=google&utm_term=130394020238%5Eaud-1393135134182%3Adsa-402690192841%5E%5E559673290317%5E%5E%5Eg
The 3 Big Three market indicators are the S&P, the Nasdaq, and the Russell 2000.
Here is the definition of a breadth indicator - https://www.investopedia.com/terms/b/breadthindicator.asp#:~:text=Breadth%20indicators%20are%20mathematical%20formulas,a%20stock%20index's%20price%20movements.
https://stockcharts.com/search/?q=%22Bullish%20Percent%20Indices%22§ion=symbols
https://stockcharts.com/search/?section=symbol&q=itbm
Here are my 3 overall market, and 11 sector bullish percent/breadth indicators.
https://stockcharts.com/h-sc/ui?s=%24BPSPX&p=D&yr=1&mn=1&dy=0&id=p52587820339
https://stockcharts.com/h-sc/ui?s=%21ITBMRASPX&p=D&yr=1&mn=1&dy=0&id=p19618477856
https://stockcharts.com/h-sc/ui?s=%24BPCOMPQ&p=D&yr=1&mn=1&dy=0&id=p56057290514
https://stockcharts.com/h-sc/ui?s=%21ITBMRANAS&p=D&yr=1&mn=1&dy=0&id=p80217190236
No Bullish Percent chart for the Russell 2000 available on Stockcharts, so I only use the Breadth Momentum chart.
https://stockcharts.com/h-sc/ui?s=%21ITBMRASML&p=D&yr=1&mn=1&dy=0&id=p61588152245
https://stockcharts.com/h-sc/ui?s=%24BPINFO&p=D&yr=0&mn=6&dy=0&id=p39960005813
https://stockcharts.com/h-sc/ui?s=%24BPHEAL&p=D&yr=0&mn=6&dy=0&id=p11765251175
https://stockcharts.com/h-sc/ui?s=%24BPDISC&p=D&yr=0&mn=6&dy=0&id=p09464854005
https://stockcharts.com/h-sc/ui?s=%24BPCOMM&p=D&yr=0&mn=6&dy=0&id=p72913245449
https://stockcharts.com/h-sc/ui?s=%24BPFINA&p=D&yr=0&mn=6&dy=0&id=p32862865985
https://stockcharts.com/h-sc/ui?s=%24BPINDY&p=D&yr=0&mn=6&dy=0&id=p58894081979
https://stockcharts.com/h-sc/ui?s=%24BPSTAP&p=D&yr=0&mn=6&dy=0&id=p08104063330
https://stockcharts.com/h-sc/ui?s=%24BPUTIL&p=D&yr=0&mn=6&dy=0&id=p17036187596
https://stockcharts.com/h-sc/ui?s=%24BPMATE&p=D&yr=0&mn=6&dy=0&id=p68685424654
https://stockcharts.com/h-sc/ui?s=%24BPREAL&p=D&yr=0&mn=6&dy=0&id=p84760610708
https://stockcharts.com/h-sc/ui?s=%24BPENER&p=D&yr=1&mn=1&dy=0&id=p82354804841
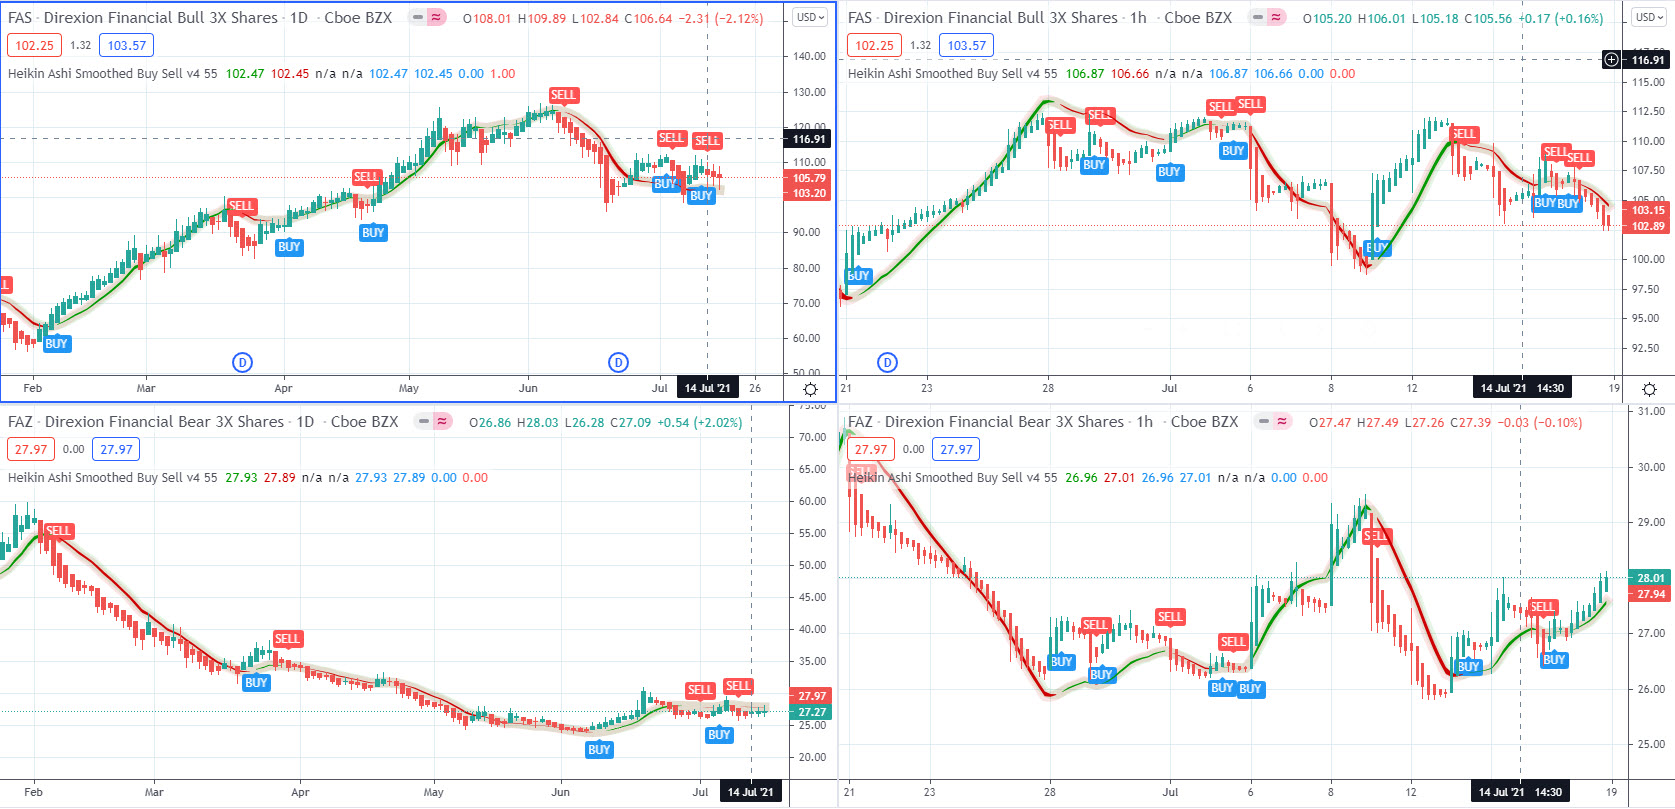
When the bullish percent breadth indicator chart moves from trending down to trending up (the PSar flips), take a position in the corresponding ETF, timing the entry and exit using the individual ETF chart.
Likewise, when the indicator moves from trending up to trending down (again, the PSar flips), take a position in the corresponding inverse ETF. Be aware, not all 11 SPDR sectors have a corresponding inverse ETF.
The ETF's I use for the 3 overall markets are -
https://stockcharts.com/h-sc/ui?s=SPXL&p=60&yr=0&mn=1&dy=0&id=p26753928687
https://stockcharts.com/h-sc/ui?s=SPXS&p=60&yr=0&mn=1&dy=0&id=p26753928687
https://stockcharts.com/h-sc/ui?s=TQQQ&p=60&yr=0&mn=1&dy=0&id=p26753928687
https://stockcharts.com/h-sc/ui?s=SQQQ&p=60&yr=0&mn=1&dy=0&id=p26753928687
https://stockcharts.com/h-sc/ui?s=TNA&p=60&yr=0&mn=1&dy=0&id=p26753928687
https://stockcharts.com/h-sc/ui?s=TZA&p=60&yr=0&mn=1&dy=0&id=p26753928687
The ETF's I use for the 11 SPDR sectors are -
https://stockcharts.com/h-sc/ui?s=TECL&p=60&yr=0&mn=1&dy=0&id=p26753928687
https://stockcharts.com/h-sc/ui?s=TECS&p=60&yr=0&mn=1&dy=0&id=p26753928687
https://stockcharts.com/h-sc/ui?s=CURE&p=60&yr=0&mn=1&dy=0&id=p26753928687
https://stockcharts.com/h-sc/ui?s=WANT&p=60&yr=0&mn=1&dy=0&id=p26753928687
https://stockcharts.com/h-sc/ui?s=XLC&p=60&yr=0&mn=1&dy=0&id=p26753928687
https://stockcharts.com/h-sc/ui?s=FAS&p=60&yr=0&mn=1&dy=0&id=p26753928687
https://stockcharts.com/h-sc/ui?s=FAZ&p=60&yr=0&mn=1&dy=0&id=p26753928687
https://stockcharts.com/h-sc/ui?s=DUSL&p=60&yr=0&mn=1&dy=0&id=p26753928687
https://stockcharts.com/h-sc/ui?s=VDC&p=60&yr=0&mn=1&dy=0&id=p26753928687
https://stockcharts.com/h-sc/ui?s=UTSL&p=60&yr=0&mn=1&dy=0&id=p26753928687
https://stockcharts.com/h-sc/ui?s=UYM&p=60&yr=0&mn=1&dy=0&id=p26753928687
https://stockcharts.com/h-sc/ui?s=DRN&p=60&yr=0&mn=1&dy=0&id=p26753928687
https://stockcharts.com/h-sc/ui?s=DRV&p=60&yr=0&mn=1&dy=0&id=p26753928687
https://stockcharts.com/h-sc/ui?s=NRGU&p=60&yr=0&mn=1&dy=0&id=p26753928687
https://stockcharts.com/h-sc/ui?s=NRGD&p=60&yr=0&mn=1&dy=0&id=p26753928687
I do screw around with a few individual stocks, and other ETF's, NatGas being one. Gold is another -
https://stockcharts.com/h-sc/ui?s=%24BPGDM&p=D&yr=0&mn=6&dy=0&id=p20416401671
https://stockcharts.com/h-sc/ui?s=GDXU&p=60&yr=0&mn=1&dy=0&id=p26753928687
https://stockcharts.com/h-sc/ui?s=GDXD&p=60&yr=0&mn=1&dy=0&id=p26753928687
Merry Christmas!
Thought you would find this interesting -
I believe being on the short side of Bitcoin is the correct position. It appears Europe is leading the world markets down. -
https://www.zerohedge.com/markets/europe-implodes-its-leaders-plan-radical-intervention-including-price-setting-suspending?utm_source=&utm_medium=email&utm_campaign=900
https://www.zerohedge.com/markets/eurasian-alliance-plans-moscow-world-standard-destroy-lbmas-monopoly-precious-metals?utm_source=&utm_medium=email&utm_campaign=900
https://www.zerohedge.com/markets/sweden-austria-start-bailing-out-energy-companies-triggering-europes-minsky-moment?utm_source=&utm_medium=email&utm_campaign=900
...and it appears Bitcoin remains correlated near 1 for 1 with the Nasdaq.
https://stockcharts.com/h-sc/ui?s=%24BTCUSD&p=D&yr=1&mn=0&dy=25&id=p74983544514

BITI (a new ETF) is a way to short Bitcoin. GLTY
https://stockcharts.com/h-sc/ui?s=BITI&p=D&yr=0&mn=4&dy=0&id=p22691814406
I am glad you have something working well for you. Currently, I hold only short positions. Short Nasdaq (SQQQ), short Biotech (LABD), short tech-semiconductors (SOXS), and short gold (GDXD). GLTY
https://stockcharts.com/h-sc/ui?s=SQQQ&p=D&yr=0&mn=4&dy=0&id=p60822541611
https://stockcharts.com/h-sc/ui?s=LABD&p=D&yr=0&mn=4&dy=0&id=p80045521925
https://stockcharts.com/h-sc/ui?s=SOXS&p=D&yr=0&mn=4&dy=0&id=p39206626552
https://stockcharts.com/h-sc/ui?s=GDXD&p=D&yr=0&mn=4&dy=0&id=p18879811466
Watching for an entry point in KOLD to present itself (next week?)
https://stockcharts.com/h-sc/ui?s=KOLD&p=D&yr=0&mn=4&dy=0&id=p79037986930
...and also watching for an entry point into all things crypto to present itself too. This includes the miners. It might be quite a while before it bottoms though.
https://stockcharts.com/h-sc/ui?s=%24BTCUSD&p=D&yr=1&mn=0&dy=25&id=p74983544514
Here is a read for you. I found it informative and timely. GLTY
There have been only three 2.5 sigma bubbles in the last 100 Years...1929, 2000 and now!
https://www.gmo.com/americas/research-library/entering-the-superbubbles-final-act/
...the three near-perfect markets with crazy investor behavior and 2.5+ sigma overvaluation have always been followed by big market declines of 50%. The papers said nothing about fundamentals except to expect some deterioration. Now here we are, having experienced the first leg down of the bubble bursting and a substantial bear market rally, and we find the fundamentals are far worse than expected.
The whole world is now fixated on the growth-reducing implications of inflation, rates, and wartime issues such as the energy squeeze. In addition, there are several less obvious short-term problems. Meanwhile, the long-term problems of demographics, resources, and climate are only getting worse and now are beginning to bite even in the short run.
That is a good article. As does the author, I too have been using the 30% and 70% levels for $BPxxx charts.
I have also been playing with $BPxxx's in this chart style. Its a work in progress for me...
https://stockcharts.com/h-sc/ui?s=%24BPCOMPQ&p=D&yr=1&mn=1&dy=0&id=p69051637902
https://stockcharts.com/h-sc/ui?s=%24BPSPX&p=D&yr=1&mn=1&dy=0&id=p69051637902
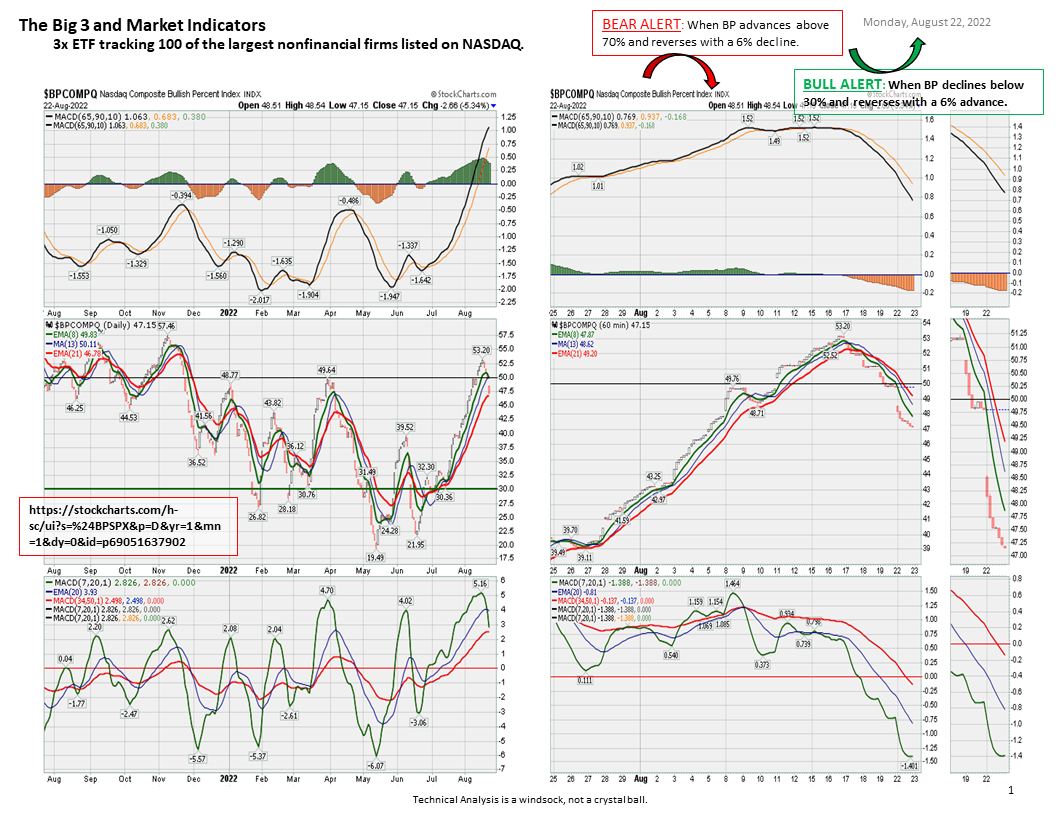
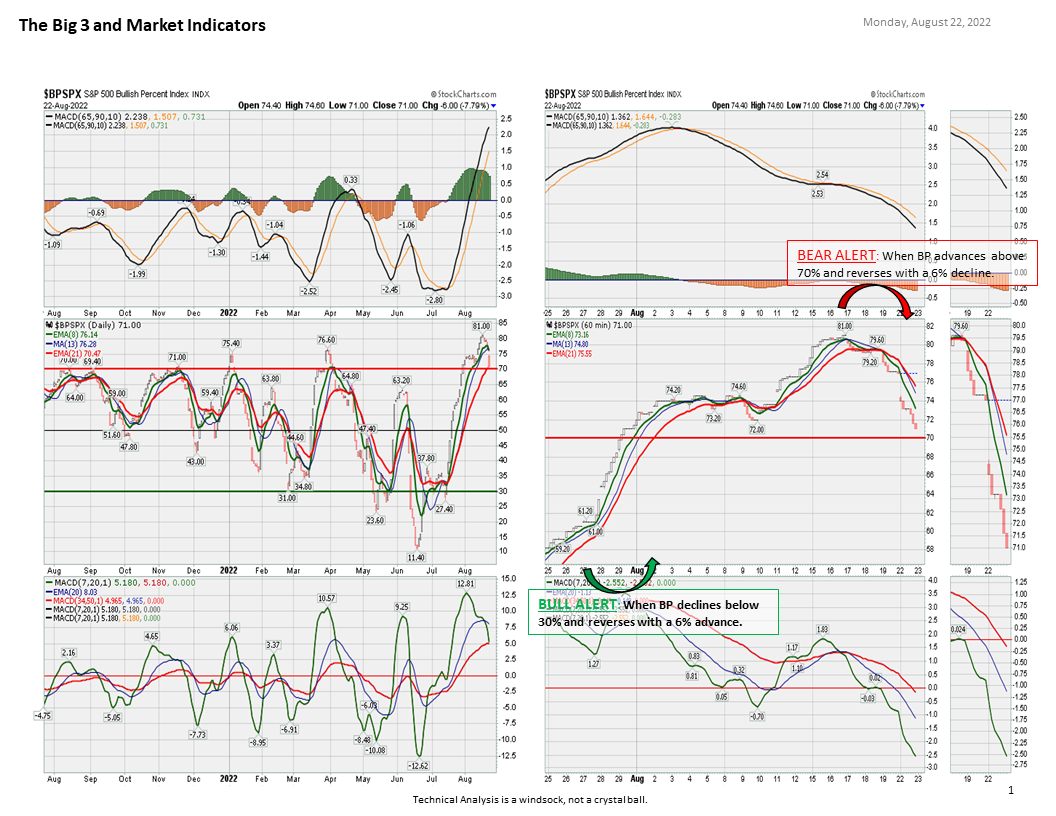
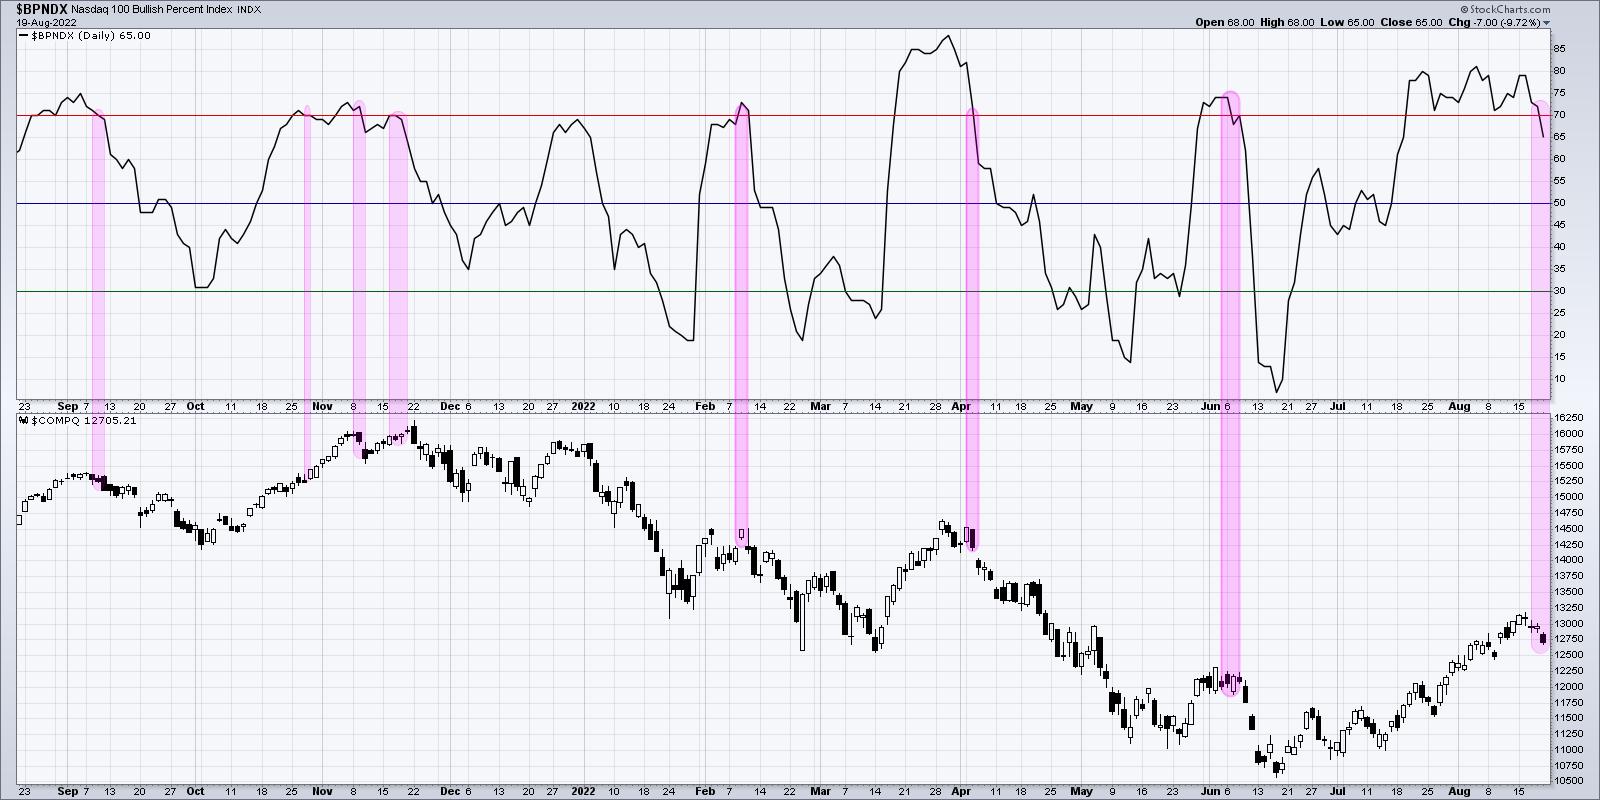
Here is an interesting chart and article.
https://stockcharts.com/articles/mindfulinvestor/2022/08/im-calling-the-top-in-the-sp-5-370.html?mc_cid=6c122889b7&mc_eid=b6c072464f
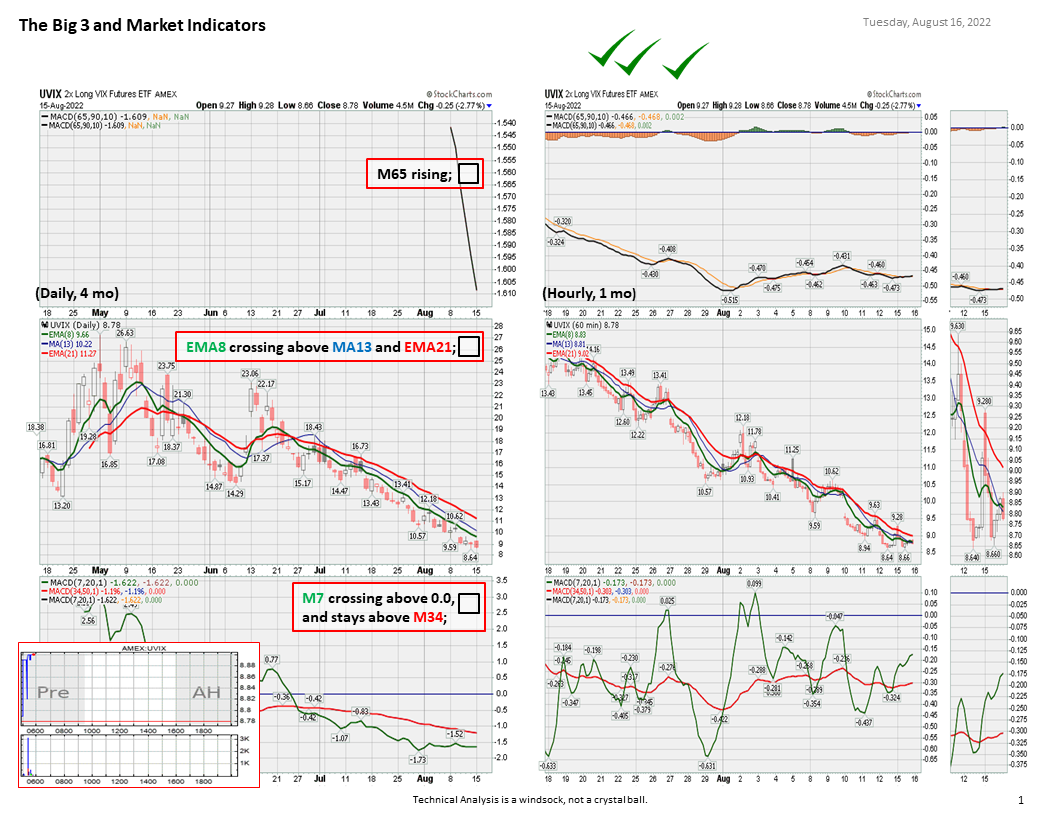
...and yes, they did close down UVIX a while ago, but it's back!
https://www.reuters.com/article/usa-etf-volatility/four-years-after-volmageddon-new-volatility-etfs-to-hit-market-idUSKCN2LP224
https://www.volatilityshares.com/uvix/
Here is an idea for you.
When the current bear market rally starts to get toppy, UVIX will turn up. As low as it is currently, this could be a nice 2x return. GLTY
https://www.volatilityshares.com/uvix/
https://stockcharts.com/h-sc/ui?s=UVIX&p=D&yr=0&mn=4&dy=0&id=p45126262881
https://stockcharts.com/h-sc/ui?s=UVIX&p=60&yr=0&mn=1&dy=1&id=p36294538296
https://ih.advfn.com/p.php?pid=staticchart&s=UVIX&p=0&t=17&width=288&height=147&vol=1&delay=1&min_pre=270&min_after=270
That is one heck of a collection of charts! I guess higher highs and a break of the nearly 40-year downtrend line is in the offing. We have a long slog ahead I think.
2020 - Pandemic year
2021 - Supply chain year
2022 - Inflation year
2023 - Recession year
2024 - ? Recovery years
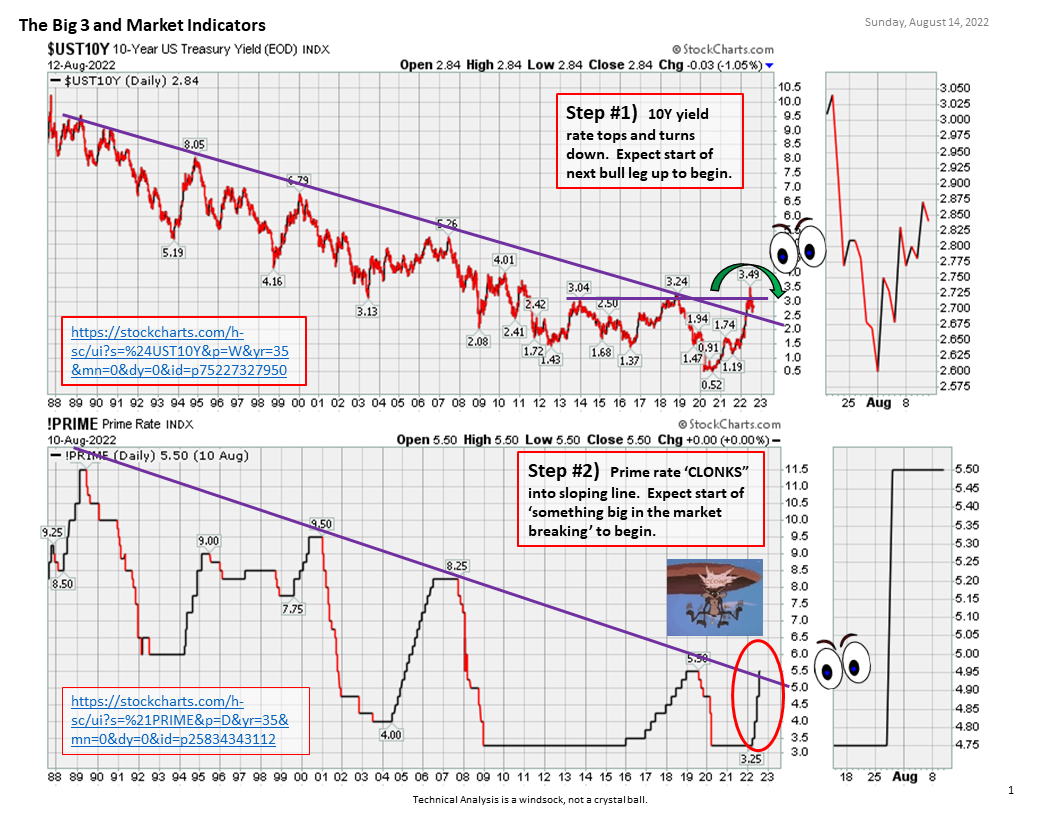
The coming Wile E Coyote 'Clonk' event explained. I'm guessing late 2022 or early 2023 when the Fed stops raising interest rates, actually starts lowering them again, and begins printing money again.
https://www.zerohedge.com/economics/its-game-over-fed-expect-monetary-rug-pull-soon?utm_source=&utm_medium=email&utm_campaign=851
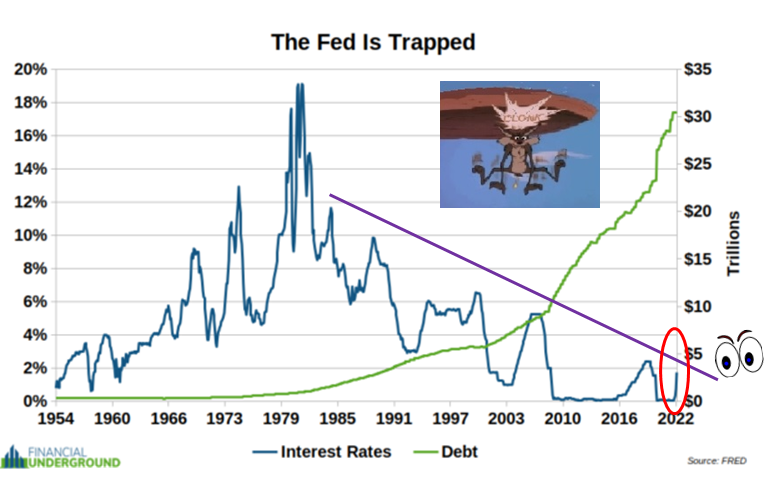
Link to below chart - GLTY
https://stockcharts.com/h-sc/ui?s=%24%24FEDRATE&p=D&yr=40&mn=0&dy=0&id=p75169583242
https://stockcharts.com/h-sc/ui?s=%21PRIME&p=D&yr=40&mn=0&dy=0&id=p25834343112
I appreciate your comments on Bitcoin versus Ethereum. I am watching this too, but for now, I still like riding the Bitcoin miners rather than the coin itself. Bitcoin turned positive over the weekend -
Because of this, looking to get back into a miner today. Likely CORZ this time rather than back into MARA.
https://cryptonewsbtc.org/2022/03/30/core-scientific-stock-how-corz-became-the-king-of-bitcoin/
I noticed Gold seens positioned for a run. Watching for the boxes to get checked this week before I jump into GDXU. NatGas turning down over the weekend. KOLD moving up this morning. Will this be the beginning of 'the big KOLD move'? This week might be telling. GLTY
Still sideways but good strength overnight as it opened in the far east. Could be a change of direction. It certainly brings things up to an important level of resistance that it has to get past to be worth jumping into. I prefer ETH at this point. A lot of interest with 'The Merge'. I think it is a potential catalyst until it happens supposedly at the end of the quarter...then maybe sell the news. ETH is definitely outperforming BTC since the June lows.

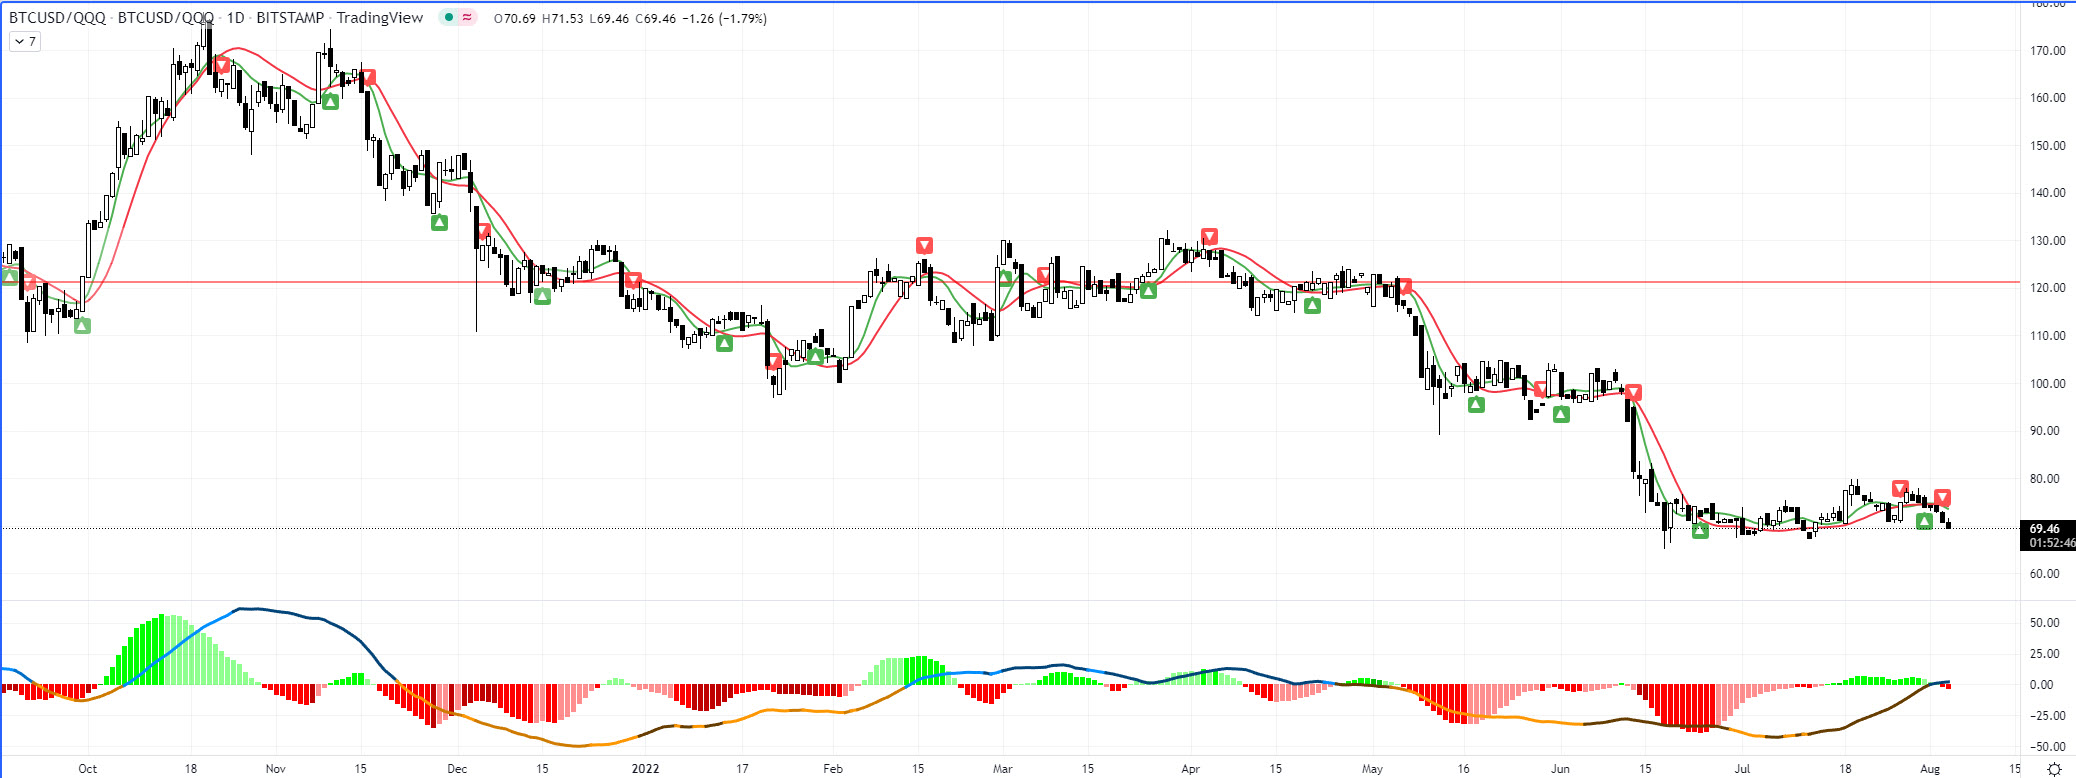
The BTC to QQQ correlation is measured on a scale from -1.0 to 1.0. 1.0 indicates highly correlated (moving together). -1.0 indicates moving in opposite directions.
I added the Stockcharts measure of correlation in the lower pane of the below charts. The first one daily, the other 1 hour. It is a dynamic measure and moves around a lot in shorter time frames.
https://stockcharts.com/h-sc/ui?s=%24BTCUSD&p=D&yr=0&mn=4&dy=0&id=p42854664997
https://stockcharts.com/h-sc/ui?s=%24BTCUSD&p=60&yr=0&mn=0&dy=10&id=p07958710551
GLTY

NOTE - I have learned to take the comments from 'the boys' more as suggestions rather than absolutes. I believe they are both very skilled technicians, but for me, sometimes a bit too complex in their tool selection, and a bit too creative in their analysis. I have however learned much from them by observing.
Not sure about the correlation. In general both are down. But BTC is not behaving well. I did get out of my positions mainly in ETH last Friday hoping to catch a good correction. I had to travel yesterday and couldn't watch anything. When I heard that the nasdaq and technology had a monster day I thought for sure crypto would have followed suit. But it went the other way which I was amazed at. I know the RPQ boys are still expecting down but I thought it was closely following tech.
Chart below is BTC/QQQ
oiil price is dripping, weather is cooling off gradually,
KOLD could blow up any time soon
Approaching the 'green' zone!
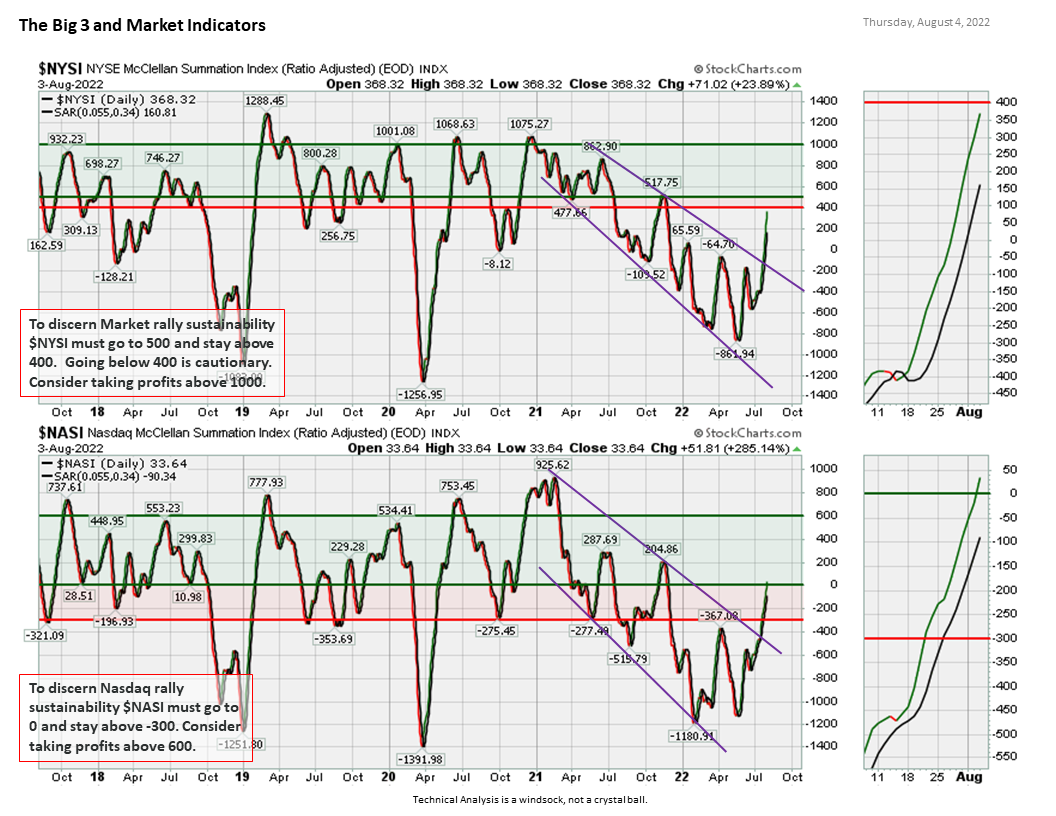
I stumbled onto the below market indicators a while back, and use them as trend indicators. The trend is your friend.
...and for the past 6-8 months, crypto has been somewhat correlated with the Nasdaq. GLTY
https://decrypt.co/105140/bitcoin-rises-while-u-s-stocks-equities-continue-to-fall
https://stockcharts.com/h-sc/ui?s=%24NYSI&p=D&yr=5&mn=0&dy=0&id=p98089974058
https://stockcharts.com/h-sc/ui?s=%24NASI&p=D&yr=5&mn=0&dy=0&id=p66572016916
The heat wave is dissipating, meaning less consumption of NatGas. If tomorrow's storage report shows a larger injection into storage, rather than consumption to run power for air conditioners, then I believe it is safe to say the industry is beginning to build inventory for this coming heating season.
https://ir.eia.gov/ngs/ngs.html
If demand dissipates, and supply increases, NatGas prices will drift lower for the next few weeks.
Ride the KOLD wave until it's time to ride the BOIL wave again. Classic swing trading. GLTY
BTCUSD is making a series of higher highs and higher lows (...and some altcoins too!). Next resistance level is ~ $30k. Bitcoin miners will likely shadow this move up come Monday.
The correlation of Bitcoin with the Nasdaq continues.
FYI I recently changed from 1 hr to 2 hr time frame for my faster-moving chart. The 1 hour was too whippy. GLTY
https://stockcharts.com/h-sc/ui?s=%24BTCUSD&p=120&yr=0&mn=1&dy=1&id=p57368801361

https://stockcharts.com/h-sc/ui?s=MARA&p=60&yr=0&mn=1&dy=1&id=p57368801361
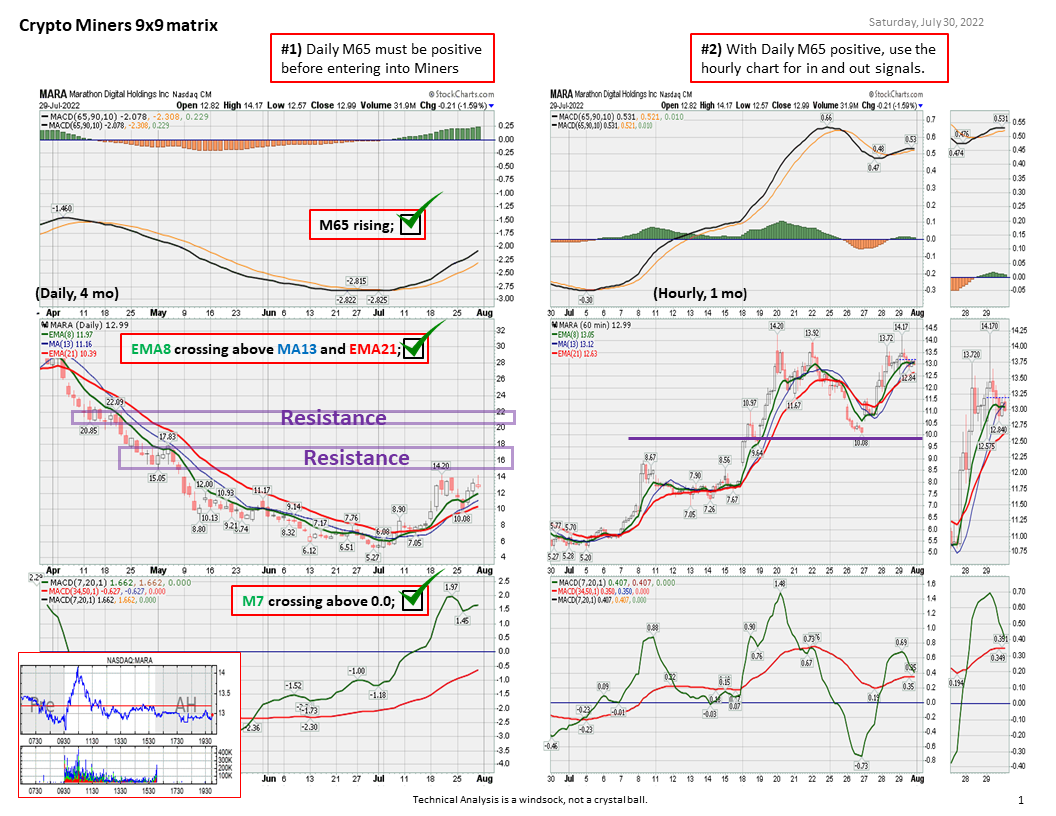
I agree. I started a position this morning. The 4 hr crossed on Wednesday and the daily is looking to price-cross today and line cross next week. I have a slight feeling that it will bounce along the bottom for a bit but probably not worth trying to draw too fine a line. KOLD and BOIL 1 Day and 4 Hr charts for each below
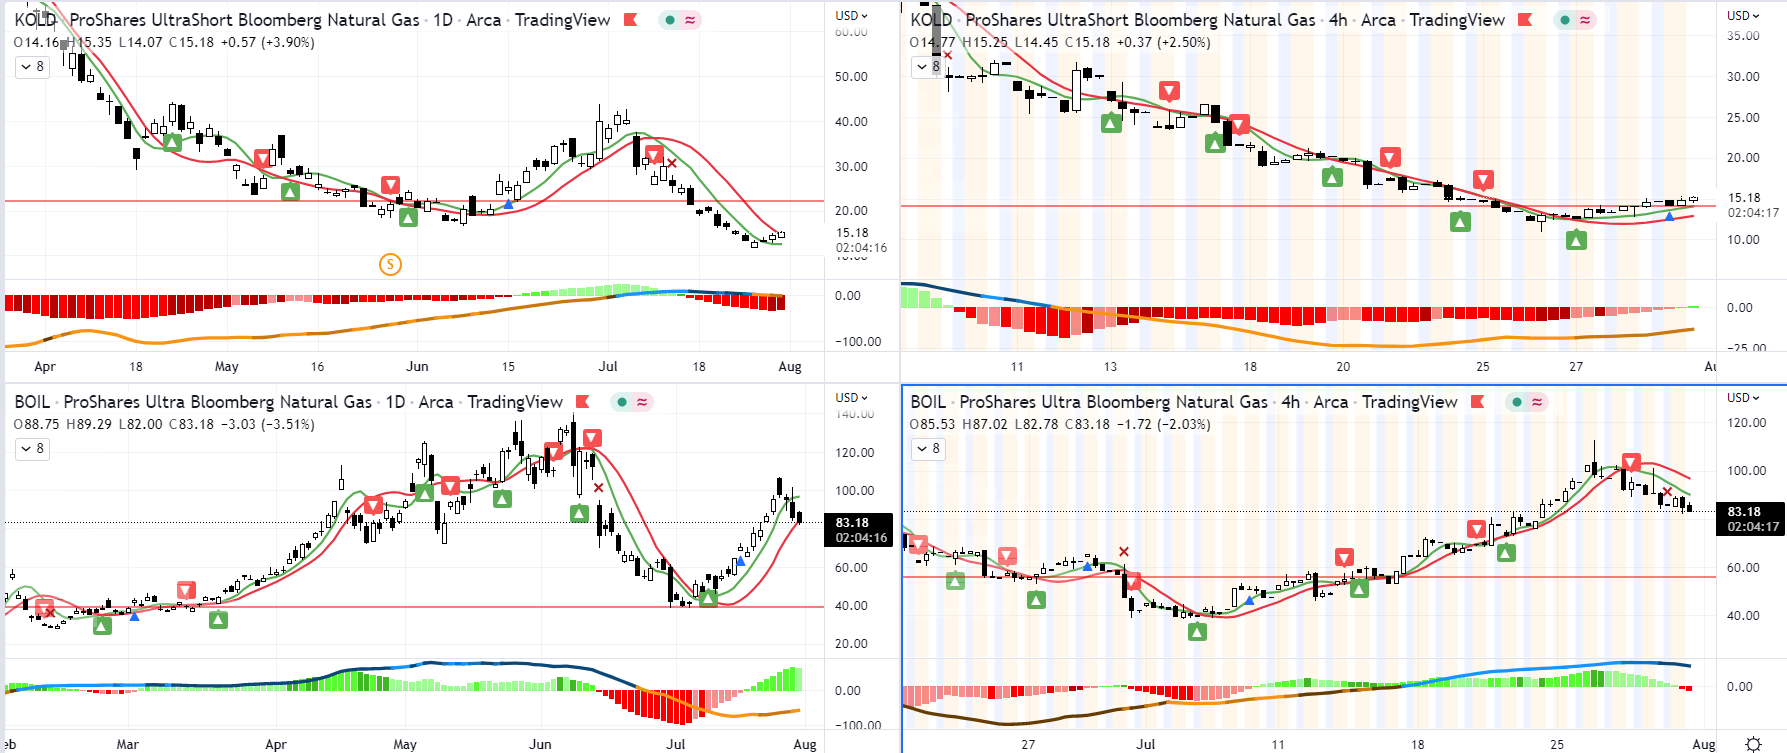
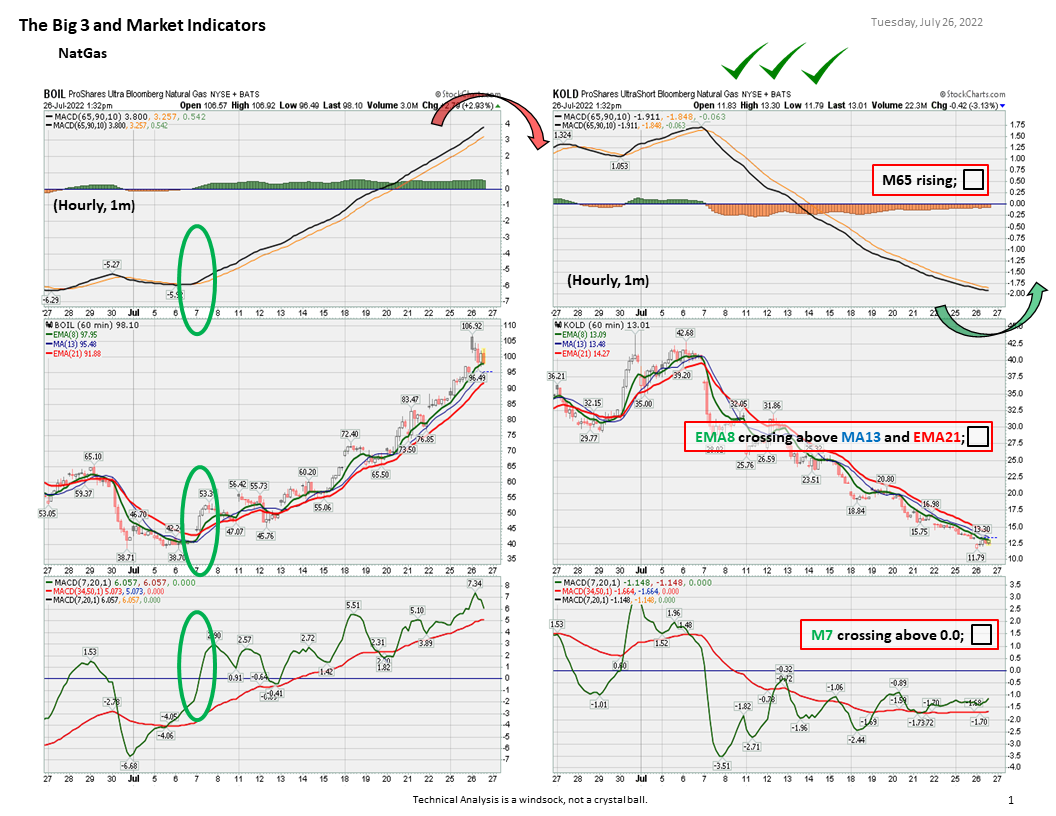
KOLD update - All three boxes checked today! I look for KOLD to be strong all of Aug and into Sept, then strength moves back into BOIL in Sept. While I look for this cycle to happen, need to follow the charts and do what they tell you. GLTY
https://stockcharts.com/h-sc/ui?s=KOLD&p=60&yr=0&mn=1&dy=1&id=p46291642178
https://stockcharts.com/h-sc/ui?s=BOIL&p=60&yr=0&mn=1&dy=1&id=p46291642178
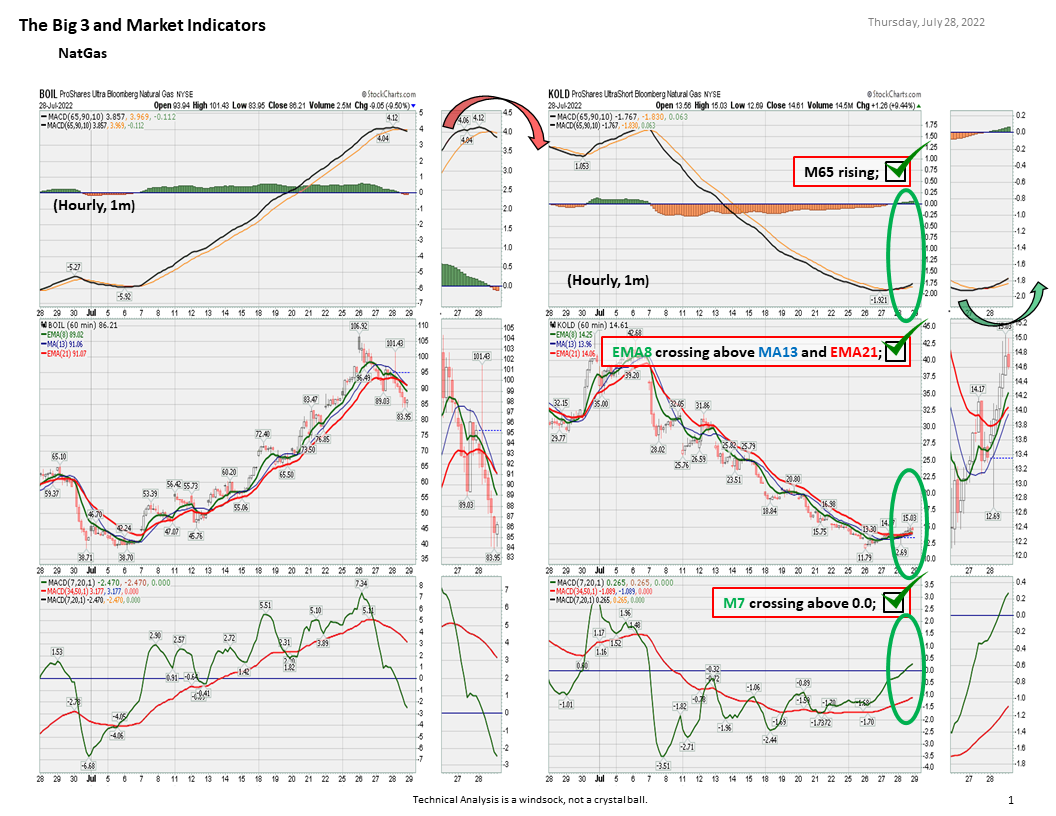
NatGas - This is interesting. This morning's weekly report showed the lowest inventory injection number in years, this is due to the huge consumption the past week caused by hot weather. One would think this very low inventory injection report should have been a very bullish report, sending Natgas higher, however, the market gave it a big yawn today.
https://ir.eia.gov/ngs/ngs.html
With the futures and options contracts rolling over to the next forward month yesterday, I believe the market is now looking to the fall 'shoulder' season where demand will greatly decrease as the summer weather cools, but the winter heating season has not yet started. NatGas demand should slow greatly in the next few weeks, weekly inventory injection reports will be much larger as the industry repairs for the coming winter heating season, and the price should drop accordingly.
It should now be time for KOLD to shine for a few weeks, until the winter heating season begins. The 1 hour chart appears to be poised to complete the rollover from favoring BOIL to favoring KOLD this week (today?) as anticipated. GLTY
https://www.fxempire.com/forecasts/article/natural-gas-price-forecast-natural-gas-markets-continue-to-look-a-bit-exhausted-1079144
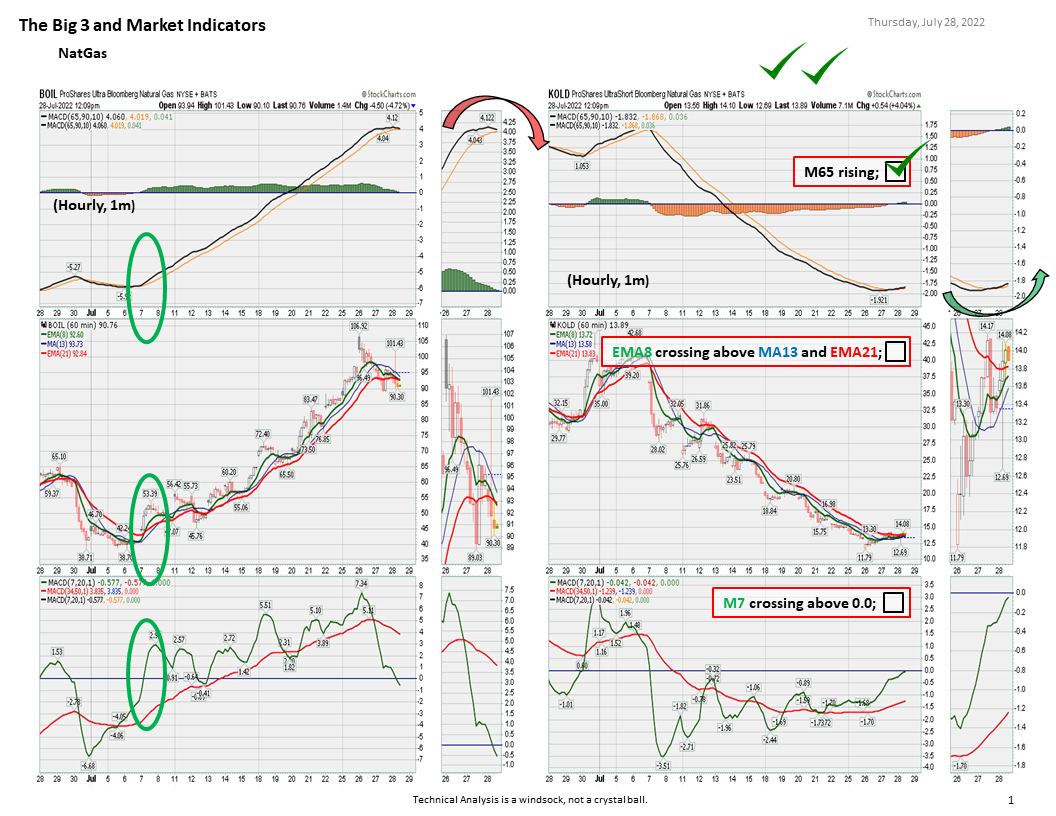
I will look deeper into your chart format this weekend. Looks like I have something to learn from you again. TY! Bitcoin (and the related miners) is moving up in lockstep with Nasdaq this week. Confirmation Bitcoin and Nasdaq are still correlated. I believe we are seeing the beginning of a bear market rally this week, not the bottom.
Other than the Bitcoin I am HODLing (my goal is to be holding 1 Bitcoin by year's end), MARA is my only exposure to Crypto at the moment. GLTY
https://stockcharts.com/h-sc/ui?s=MARA&p=D&yr=0&mn=4&dy=0&id=p56923960389
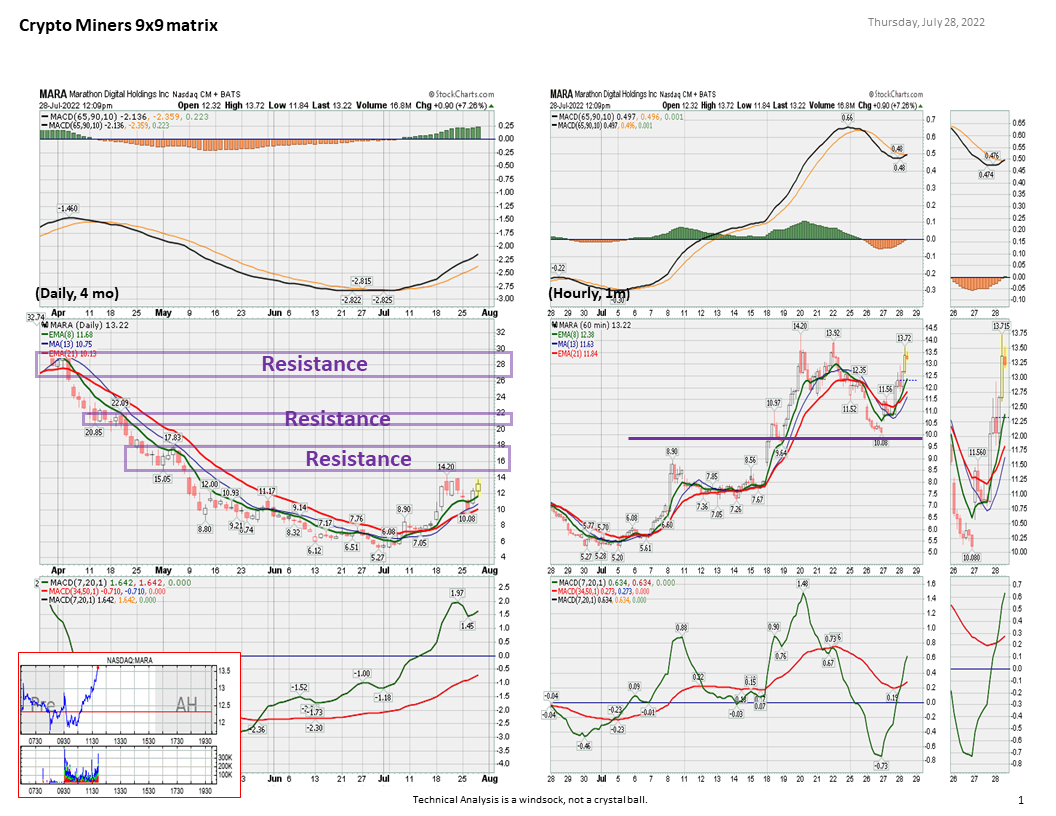
I have been sitting in ETH and watching the world go by for quite a while. I have enjoyed the run up from the June lows. I am in agreement with the boys that another leg down is coming, and I have been watching this chart in particular. I exited my position yesterday morning watching this rollover. I especially like the Kalman filter crossovers on the price chart. But I especially like the volume supported linear regression trend at the bottom. I will be looking for the next crossover of the Kalman filter lines (green up arrow) with a rising VSLT and histogram flip on the xero line of the 4 hour chart.

I am watching for NatGas to peak today or tomorrow. Options roll-over is tomorrow.
https://www.fxempire.com/forecasts/article/natural-gas-price-forecast-natural-gas-markets-spike-1076089
|
Followers
|
8
|
Posters
|
|
|
Posts (Today)
|
0
|
Posts (Total)
|
2188
|
|
Created
|
05/04/14
|
Type
|
Free
|
| Moderator stiv | |||
| Assistants stiv No-Quarter | |||
| ETFdb Screener | https://etfdb.com/screener/ |
| ETF Channel | https://www.etfchannel.com/ |
| Ichimoku Trading Strategy | https://tradingstrategyguides.com/best-ichimoku-strategy/ |
| ETF Strategy | https://www.etfstrategy.com/ |
| FX Empire | https://www.fxempire.com/ |
| Celsisu Energy | http://www.celsiusenergy.net/ |
| finviz Futures | https://finviz.com/futures.ashx |





| Volume | |
| Day Range: | |
| Bid Price | |
| Ask Price | |
| Last Trade Time: |
