 News
News  Market Data
  Discover

Support: 888-992-3836
Copyright © 2023 InvestorsHub Inc.


Register for free to join our community of investors and share your ideas. You will also get access to streaming quotes, interactive charts, trades, portfolio, live options flow and more tools.
Red Close From Corn Market
By: Barchart | March 21, 2023
The corn futures market ended Tuesday’s session 2 3/4 to 4 1/4 cents in the red. For May that was 8 1/4 cents off the day’s high. The Dollar Index was lower again on Tuesday, going into the widely anticipated FOMC decision tomorrow.
The Commitment of Traders data for the week ending March 14 was released today, and showed spec traders had added 48.8k shorts and closed 26.4k longs during the week. That flipped the group net short for the first time since August of 2020. CFTC showed commercial hedgers were adding longs during the week, which reduced their net short by 66k to 165,518 contracts as of 3/14.
USDA announced another private export sale to China this morning, for 136 MT of old crop corn.
The Ukrainian Ag Ministry reported the spring planting season has begun, earlier than normal, with 26k HA of spring wheat already planted. Ukraine’s Farm Ministry forecasts a 9 MMT lighter grain harvest of 44.3 MMT for 2023. Of that, 25.6 MMT is forecasted to be corn production.
Read Full Story »»»
 DiscoverGold
Soybean Futures Drop Double Digits
By: Barchart | March 21, 2023
The nearby soy market ended the Tuesday session 13 to 19 cents lower. May beans printed a wide 32 cent range on the day, but closed near the low. Meal futures faded back from their midday gains and closed Tuesday $0.70 to $2.10/ton in the red across the front months. Soy oil prices were 2.5% to 3% weaker at the bell.
The latest CoT release showed soybean spec traders were 127,661 contracts net long in soybeans as of 3/14. That was a weekly drop of 29.7k contracts via long liquidation. The commercial soybean traders added new longs for the week, which reduced the group’s net short by 23k contracts to 196.7k. Managed money was also confirmed selling the products. For soymeal, long liquidation reduced their net long by 21k contracts to 134k. For soy oil it was net new selling, and flipped the managed money group net short by 1,189 contracts.
USDA’s Ag Attache figures the 23/24 Chinese soybean imports will reach 97.5 MMT, a 1 MMT increase yr/yr. Their crush is also anticipated to increase by 1 MMT to 95 MMT. The Attache estimates Indonesia’s 23/24 palm oil production at 46 MMT, a 3% increase yr/yr.
Read Full Story »»»
DiscoverGold
Tuesday Losses For Wheat Market
By: Barchart | March 21, 2023
Wheats extended the downside again on Tuesday by another 1-2% across the winter wheat markets. MGE wheat futures were down 5 3/4 to 6 1/2 cents on Tuesday.
CFTC provided positions data as of the 3/14 settlement this afternoon. They showed SRW spec traders had reduced their net short by 5.4k contracts that week via net new buying. The funds were still 95k contracts net short. The KC wheat specs were extending their net short by 2.3k contracts through the week, to 12,732 as of 3/14. Managed money firms were 4,447 contracts net short in spring wheat, which was a 1,418 contract stronger net short through the week.
The Ukrainian Ag Ministry reported the spring planting season has begun, earlier than normal, with 26k HA of spring wheat already planted. Ukraine’s Farm Ministry forecasts a 9 MMT lighter grain harvest of 44.3 MMT for 2023. Of that, 16.6 MMT is forecasted to be wheat production.
Russian grain production is forecasted 19% lower for 23/24, with 82.6 MMT of wheat output – per UkrAgroConsult.
Read Full Story »»»
DiscoverGold
Cotton Closes In Black On Tuesday
By: Barchart | March 21, 2023
Cotton futures ended off their highs on Tuesday, but still went home in the black with help from a weaker US dollar. May cotton settled 131 points under its session high, but held on to a 63 point gain for the day. The other nearbys were up by 75 to 100 points at the bell.
CFTC reported Commitment of Traders data as of the 3/14 settle, showing that managed money had added 8,800 new shorts through the week. That extended the groups net short to 13,653 contracts. The commercial hedgers were both adding new longs and closing short hedges for a net 8,027 contract weaker net short. That had the group 24,678 contracts net short as of the 3/14.
NOAA’s 7-day QPF has more rainfall for the North MS/Al/GA. From Eastern OK through TN, NOAA sees 2 to 4” of rainfall this week. The soil moisture WMO from USDA’s Crop Explorer already has the region in 90-100% excessive soil moisture as cotton planting is just around the corner.
The 3/20 Cotlook A Index was 125 points lower to 92.30 cents. The week’s AWP for cotton is 68.58 cents/lb. ICE certified stocks were 1,661 bales as of 3/17.
Read Full Story »»»
DiscoverGold
Agriculture Master Report
By: Bill Moore | March 21, 2023
MAY BEANS
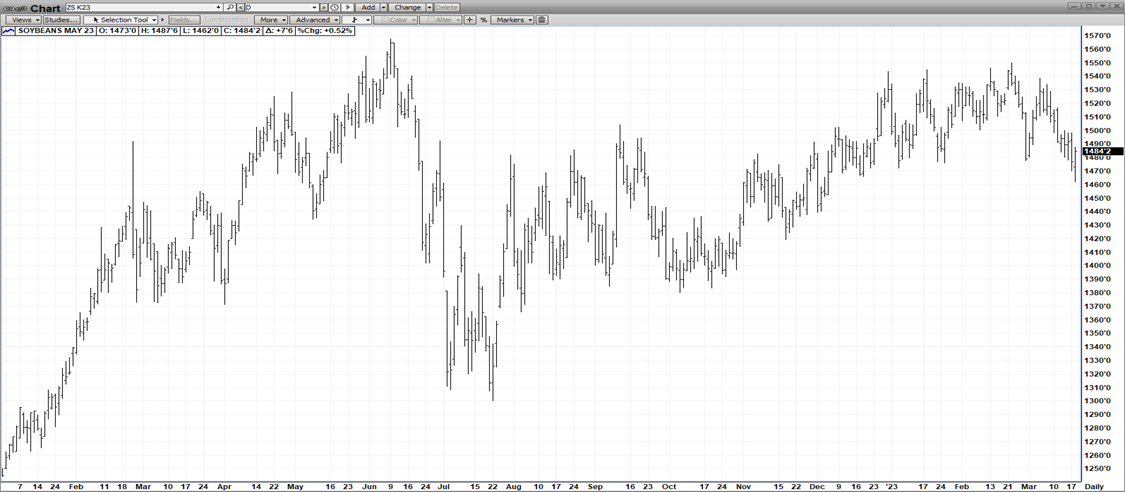
Once again, bearish Macro events have pressured beans – however, losses have been mitigated by positive supply/demand fundamentals! The Banking Crisis from last week which saw two banks – Silicon Valley Bank & Signature Bank – close – forced a knee jerk down in all commodities but positive exports & the ongoing extreme drought in Argentina softened the loss as today, May Beans have recovered to just $.65 off its February highs! The losses in Argentine bean production have now surpassed the surplus from the Brazilian record crop meaning still tighter supplies into the US growing season! Exports have picked up as China has slowly re-opened – & the US Dollar has dropped in the last 6 months! US needs to be OK!
MAY CORN
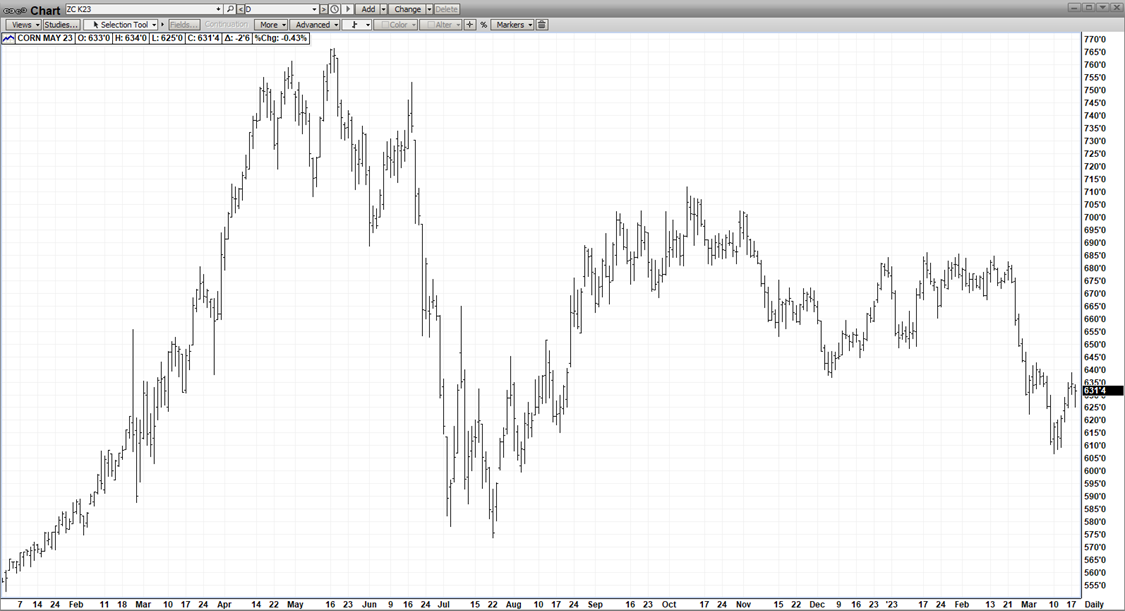
China is back! In a big way! In a nearly unprecedented buying spree, they bought US corn last week 4 consecutive days in a row – 613,000, 667,000, 641,000 & 192,000 for an aggregate of 2.2 MMT! We felt this was coming – what with the recent 70 cent break in May Corn futures & the precipitous fall of the US Dollar in the past 4 months, but of course needed actual confirmation which we got in spades last week! With the ongoing decades worse Argentine drought & improving exports, the supplies are snug – putting a lot of pressure on the upcoming US growing season! Plus, Corn futures did not make new lows when the banking chaos hit a week ago – an impressive sign of Bullish Divergence! The mere fact that May Corn is still hanging in the low-to-mid 6’s – despite paltry exports until last week – speaks to the 6-7 year low global stocks – which could be even lower once the “dust settles” from the South American weather woes!
MAY WHT

May Wht has been buffeted about by 3 major factors – but staying range bound in the past 2 weeks – the inundation onto the global mkt of cheap Russian exports, the on-again/off-again status of the Russian-Ukraine Grain Corridor Deal & the banking crisis from last week! All three can be considered headwinds for the mkt but it hasn’t made new lows of any significance – meaning the current price level has discounted many of the bearish factors! The mkt will look to guidance from its Sister Mkts – Corn & Beans – & the upcoming planting & Qtly Stocks due Friday 3-31-23 at 11am – going forward!
APL CAT

Looks like a top in the cattle after a magnificent “Bull Run”? Not so fast! Even with slumping beef & cash mkts & the bearish bank crisis, supplies are still very tight – as validated by Fridays Cattle-on-Feed Report– showing 93% placements & 95% on-feed! Plus, the mkt is trading discount to cash during a period of declining supply! Also, exports have been very impressive with China importing 190,000 MT of beef in Feb – up 24.2% from last year! Finally, the futures action was one of consolidation even with the 2 US bank failings! And Spring Barbeque Demand is right around the corner! The “supply bull” has corrected a bit but still appears to be “alive & well”!
APL HOGS
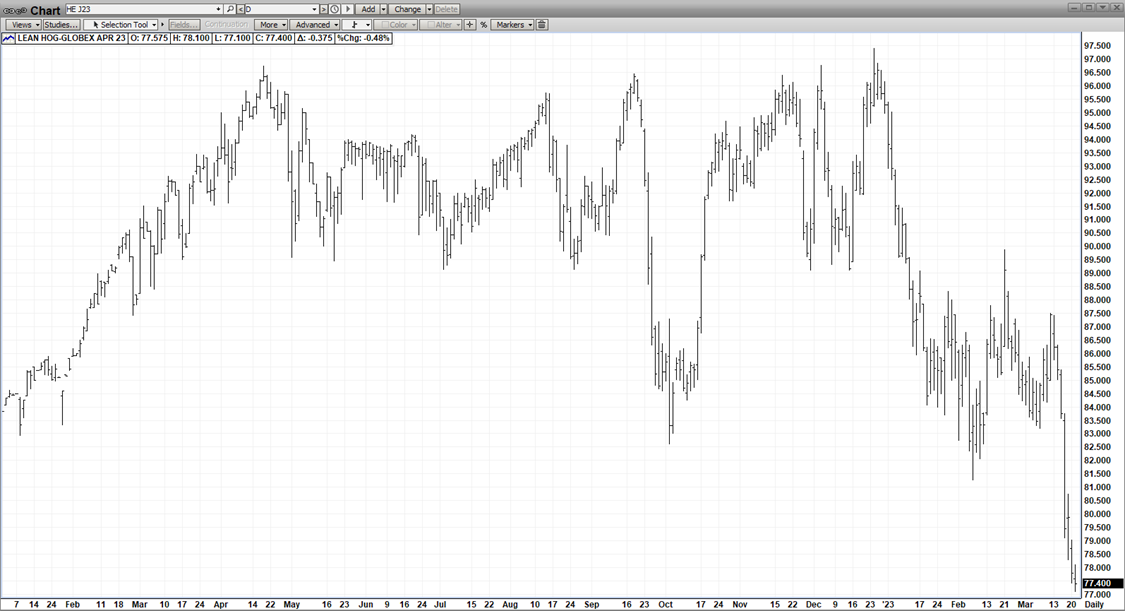
The carnage continues unabated as Apl Hogs have dropped $10 (87 – 77) in just 7 trading days! It appeared for a long time the early Feb lows would hold but when they didn’t, the “flood gates” opened! The funds staged a mass exodus – exacerbated by the banking chaos – and the supply-laden hog mkt’s “path of least resistance” was down! But now – is enough enough! We feel the mkt’s precipitous drop will certainly attract some demand – as we approach the Spring Barbeque Season! And the mkt is grossly oversold & holds an extreme discount to cash! Look for some bullish divergence ( holding or rallying on bad news) to confirm a seasonal low!
Read Full Story »»»
DiscoverGold
Lumber Watches The Economy While We Watch Lumber Prices
By: Barchart | March 21, 2023
In my last lumber article on Barchart on February 27, May random-length lumber futures were at the $406 per 1,000 board feet level. The physical lumber futures for May delivery was at a premium above $530 per 1,000 board feet. In that article, I wrote, “Interest rates are critical for lumber prices. In February 2023, the trend in rates is higher, putting pressure on lumber as we head into the spring construction season, with mortgage rates at the highest level in many years.”
Last week, crude oil and copper futures prices plunged as the markets faced a banking crisis in the U.S. and Europe. Despite Credit Suisse’s travails, the ECB hiked rates by 50 basis points. However, lumber edged higher, which could be a sign for other commodity markets. If lumber found a bottom, it could mean copper and oil prices fell to levels that are compelling buying opportunities.
Lumber prices do not react to the latest crisis
On February 27, 2023, nearby May random-length lumber futures prices were at the $406 level, with the new physical contract for May delivery at around $530 per 1,000 board feet.

The chart shows at $444, the May random-length contract has moved over 9% high.

The new physical contract for May delivery at $537.50 was slightly higher on March 21, 2023, than the late February level.
The recent issues in the banking sector have impacted many markets, but lumber has not declined. The ECB raised interest rates by 50 basis points last week, and all signs point to another at least 25 basis point hike by the U.S. Federal Reserve at this week’s meeting. On February 27, nearby April NYMEX crude oil and May COMEX copper futures settled at $75.68 per barrel and $4.0110 per pound, respectively. While lumber prices increased, crude oil was 9.2% lower at $68.70, and copper edged lower to $3.9895 on March 21.
Lumber tends to move first and lead- Liquidity is the likely reason
Lumber is a highly illiquid futures market. The total number of open long and short positions in the soon-to-disappear random-length lumber futures market was 1,499 contracts as of March 20, with daily volume below the 500-contract level. Open interest in the May physical contract was lower at 1,039 contracts, with daily volume below 120 contracts.
The low volume and open interest compared to crude oil, copper, and other futures markets lead to excessive price variance as bids to buy disappear when the price declines and offers to sell evaporate during rallies.
Over the past years, lumber has often signaled the path of least resistance for other commodity futures markets because of the low liquidity that leads to sudden changes in its price path. Lumber is untradeable, but has been a barometer for other industrial raw material markets. Lumber’s recent strength in the face of bank failures and tight credit markets could be an omen for copper, crude oil, and other commodity prices.
Lumber’s seasonal tendencies- Mortgage rates do not support new home construction
Lumber is a seasonal commodity that tends to reach lower as the winter approaches and recovers during the spring.

The long-term chart shows four peaks in the lumber futures market:
• In March 1993, nearby lumber futures rose to $493.50 per 1,000 board feet.
• The 2018 $659 high occurred in May.
• The 2021 record $1,711.20 high was in May.
• The 2022 lower peak at $1,477.40 high was in March.
The spring is the start of the construction season, and the recent strength could be a seasonal factor in the lumber futures arena. However, mortgage rates at the 7% level or higher do not support new home construction this spring. In late 2021, a conventional 30-Year fixed-rate mortgage was below 3%. The difference of over $1,300 per month in interest on a $400,000 loan has disqualified many potential new home buyers, weighing on wood demand.
Watching and not trading lumber
I have traded commodities since the early 1980s but have never bought or sold one lumber contract. The illiquidity makes lumber a roach motel, allowing market participants to enter risk positions with significant price slippage, but exiting when the market moves contrary to expectations is another story. Hedgers have avoided lumber futures because of liquidity issues.
While the new physical contract is smaller and allows for more flexibility for hedgers, it has yet to attain the critical mass in open interest and volume the Chicago Mercantile Exchange had hoped. Time will tell if it survives.
While I do not trade lumber, I watch the price like a hawk because it is a barometer that often signals price action in other industrial markets.
Critical levels to watch in the May contracts for the coming weeks
Technical resistance for the expiring random-length futures market for May delivery stands at the February 1 $541.50 high, with support at the February 24 $386.20 low and the January 6 $369.30 bottom. Support and resistance on the May physical lumber contract are $478.50 and $648.50 per 1,000 board feet. A move above or below those levels would be a technical break for the wood market.
Over the past weeks, the inaction in the lumber market could be a lull before a return to lower levels because of high interest rates and a weakening economy. However, if lumber heads higher, it could signal that inflation remains a clear and present danger and may lead other raw material markets that have declined to rebound.
Read Full Story »»»
DiscoverGold
Today's Futures Heat Map • Weakest: Soybean Oil, Wheat, Platinum, Gold
By: Barchart | March 21, 2023
• Today's Futures Heat Map
Strongest: Crude Oil, Natural Gas, Russell 2000 E-Mini, Sugar
Weakest: Soybean Oil, Wheat, Platinum, Gold

Read Full Story »»»
DiscoverGold
Waiting on the Fed. The Corn & Ethanol Report
By: Daniel Flynn | March 21, 2023
We kickoff the day with Redbook YoY at 7:55 A.M., Existing Home Sales and Existing Home Sales MoM at 9:00 A.M., 52-Week Bill Auction at 10:30 A.M., 20-Year Bond Auction at 12:00 P.M., API Energy Stocks at 3:30 P.M., and Day 1 of the Fed Meeting.
On the Corn Front there was no new export announcement yesterday. Sara Schafer with AGWEB is conducting a poll on cost to raise corn per acre. “Inflation is real,” says Chris Baron, a national financial for AG View Solutions and a Iowa farmer. Based on data his farmer clients in more than 20 states and Canada, the average cost of production for corn is up $120 per acre from last year. The results with 280 responses had 14% saying less than $50 increase, 15% said $51 to $80 increase, 24%^ increased $81 to $120, 19% increased $121 to $150 or more while 17% said their cost of production was lower. The Black Sea Corridor remains open with a 60 day extension, and Export Inspections were at 47 mil. Bu. were on the high end of expectations. In the overnight electronic session the May corn is currently trading at 637 ¼ which is 4 ¼ cents higher. The trading range has been 637 ¾ to 630 ¾.
On the Ethanol Front a Nebraska bill aims to boost availability of E15 by introducing new requirements for fuel retailers and creating a grant program to support necessary upgrades at fuel retail locations. The Bill, titled the Adopt the E15 Access Standard Act or LB 562, was introduced on Jan 17 and addressed during a Feb 7 legislative hearing. Higher ethanol blends are all the rage in corn growing states. There were no trades or open interest in ethanol futures.
Read Full Story »»»
DiscoverGold
Gutsy Guarantee. The Energy Report
By: Phil Flynn | March 21, 2023
Yahoo! We got through more than 24 hours without a bank failure and that put an upward tilt to oil that has been divorced from supply and demand fundamentals! Fears that Republic Bank was on the brink have gone away as other bankers work on plans to shore up the bank along with a $30 billion dollar cash infusion causing the shares to rise by over 20% this morning. It appears that UBS got the buy of the century by stepping in to take over the assets of Credit Suisse and now will become the world largest wealth manger on the globe. Now there is talk that the US Treasury is looking at the possibility of offering a guarantee to all depositors of any amount in a US bank for a limited time which could solve the banking crisis of confidence in the short run but raises the possibility of moral hazed problems in the future. Eat. drink and be merry because the Reaper is a little further away.
So, will a guarantee stop the run on the banks? It should. Almost everybody believes that this crisis in the banking sector is because of the withdrawal of deposits and not mainly because of any capitalization issues with any bank. The FDIC and the treasury are looking at the legality of the ability for them to use their funds to make this guarantee without the approval of Congress.
Behind the scenes we believe that the problems in the banking sector in large part had been exasperated by the Federal Reserve’s attempts at micromanaging the economy. I believe that part of the problem with these banks is not just the historically fast interest rate increases but also the way Fed speakers in between meetings would scold the market when it did not act the way they wanted it to. It seemed like when risk assets were rising, the Federal Reserve would tell us that the market had it wrong and that they were serious about raising interest rates. No Kidding.
The Federal Reserve probably should have kept quiet because they had already signaled previously what their mission was. Yet the markets have a better way of looking ahead and they’re a bit smarter than the Feds. Sometimes, even if the markets have it wrong, it might have allowed some people in positions and interest rates to maneuver a bit before we saw the full impact of the Fed interest rate increases. But that means the Fed needs to focus less on the markets and more on their job. The fiscal and fed policy that was designed to reduce inflation and in the in part lower oil prices, might have the opposite effect in the long run.
The break in the oil prices is going to cause a reduction in investment in oil production and that is going to make the long-term structural shortage in the oil market worse as we move forward. It isn’t just me that is saying this, but the CEO of Trafigura Jeremy Weir is warning that current oil prices are not encouraging production. He also believes that there is not going to be too much downside for oil from this level.
The Intergovernmental Panel on Climate Change is once again warning about the end of the world unless we spend billions and trillions of dollars on climate change or as I like to call them the intergovernmental panel that cried wolf once again to justify massive spending on climate change. The panel is using scare tactics that the sky is falling. I guess we’re supposed to ignore all the other scare tactics that they’ve used over the last 25 years that have failed to come true. The panel says that deep, rapid, and sustained cuts to greenhouse gas emissions are urgently needed to keep climate change within livable limits.
What they fail to point out is that normal climates mean longer growing seasons and the ability to grow more food. They also don’t point out that more people die from severe cold weather than warm weather. The ties between hurricanes and climate change have been disproven time and time again and so much for the drought in California now they’re being flooded with water. The global climate has been changing up and down since time began. This is normal.
The reality is that the demand for oil, unless the global economy falls apart, is going hit an all-time high this year. The Energy Information Administration reported yesterday the US petroleum exports out of the United States hit a record high. Exports for petroleum product exports, up 7% from 2021, according to our Petroleum Supply Monthly. U.S. petroleum product exports averaged 5.97 million barrels per day (b/d) in 2022 (405,000 b/d more than in 2021) driven by an increase of 18% (193,000 b/d) in distillate fuel oil.
U.S. distillate fuel oil exports in 2022 averaged 1.26 million b/d, which remained below pre-pandemic volumes. In 2019, exports averaged 1.31 million b/d. Although U.S. distillate exports to Europe noticeably increased, the United States sent most of its distillate fuel oil exports to Latin America. U.S. exports of motor gasoline also increased in 2022, and unlike distillate exports, exceeded 2019 volumes, coming in at their highest annual average on record. Mexico has historically received the most U.S. gasoline exports, which was still the case last year.
Besides that, the copper market held up pretty good which is probably a strong signal for oil. Trafigura says they expect to see a new record high copper price and expects that within the next year it could break $12,000 a ton.
Even during the turmoil, the crack spreads for products have held up pretty good signaling very tight supplies. Chinese oil imports are also near record highs. Expectations are that we’re going to see a significant drawdown in petroleum supplies in this week’s report which should give us a boost. On top of that, spring is going to cause a surge in demand for gasoline in the summer driving season that is getting closer every day.
Natural gas is still struggling. A late cold snap is giving us some support and we’re expecting to see a pretty good drawdown in inventories next week. Yet the market is still struggling with concerns about the global economy.
Read Full Story »»»
DiscoverGold
Mixed Monday In Soy Market
By: Barchart | March 20, 2023
Nearby soybeans were mixed with weaker old crop at the close. The May contract saw a 25 3/4 cent range on the day, from -13 1/2 to +11 1/4, and ended near the high on a 9 1/2 cent gain. Soybean oil futures were also higher on the day, gaining 35 to 53 points. Meal futures stayed mostly firm after midday, but closed $3.30 to $3.70/ton in the red.
Weekly inspections data had 716,618 MT of soybean exports for the week that ended 3/16. That was up 83k wk/wk and up 160k MT from the same week last year. Accumulated soybean shipments were marked 1.226 MMT ahead of last year’s pace with 44.06 MMT shipped.
Patria Agronegocios estimated that the Brazilian soybean harvest is 63.1% finished. That trails Brazil’s unusually rapid 71.7% pace from last year.
Read Full Story »»»
DiscoverGold
Corn Closes Off Day’s Lows
By: Barchart | March 20, 2023
Corn settled in the red on Monday, but futures were well off their earlier session lows. The front months bounced back from nearly a dime loss, but still closed 1 to 2 1/4 cents lower.
Texas was 40% planted for new crop corn. That is 5% ahead of the 5-yr average pace. Milo planting reached 28% of expected area, matching the 5-yr pace.
USDA reported 1.189 MMT of corn was inspected for export during the week that ended 3/16. That was up from 1.015 MMT the week prior, but was down 308k MT from the same week last year. The season’s export reached 17.523 MMT as of 3/16, still trailing last year’s pace. USDA also reported 94.5k MT of milo exports, bringing the season’s total to 914k MT.
The Black Sea Export Corridor agreement was renewed over the weekend as no party officially backed out. The key to watch however, is that Russia says they only agreed to a 60 day extension - despite the deal having been set to automatically renew for 120 days.
Read Full Story »»»
DiscoverGold
Wheat Continued Lower
By: Barchart | March 20, 2023
The wheat market traded lower again on Monday to start the week. Chicago futures ended the session 9 3/4 to 13 1/2 cents lower. KC wheat futures settled the day down by 6 to 8 cents. MGE spring wheat futures were 7 3/4 to 9 1/2 cents lower across the front months. Monday Oats Futures Prices were 5 to 7 3/4 cents higher at the bell.
USDA’s weekly Crop Progress data showed KS wheat improved 7 points from last week on the Brugler500 scale to 246. In OK conditions were down by 1 point to 267 with 22% of winter wheat in the jointing stage. That is up from 11% last year but close to the 5-yr average. Winter wheat was 22% headed in TX, which is ahead of the 12% average pace. State condition ratings for wheat improved from 247 last week to 265 on the Brugler500 index.
USDA’s weekly Export Inspections report showed 374k MT of wheat was shipped during the week that ended 3/16. That was up from 257k MT last week and from 335k MT during the same week last year.
The Black Sea Export Corridor agreement was renewed over the weekend. Russia indicated that they only intend to honor the corridor for 60 days - despite the deal having been set to automatically renew for 120 days. China’s president Xi Jinping is in Russia meeting with Putin, marking both the first visit to Russia since the invasion and Xi’s first foreign visit since his 3rd term reelection. Some bilateral agreements are expected to be signed on Tuesday.
The Ukrainian Ag Ministry reported the spring planting season has begun, earlier than normal, with 26k HA of spring wheat already planted.
Read Full Story »»»
DiscoverGold
Red Close For Cattle Futures
By: Barchart | March 20, 2023
The first trade day of the week left cattle futures 30 to 87 cents in the red. Feeder cattle futures ended with 2 to 80 cent losses across the front months. Cash trade so far remains mostly unestablished, save for very limited $166 in the WCB. Last week’s activity was mostly near $164. USDA’s weekly Feeder Auction Review had 6k head sold, but only 8% heifers. The CME Feeder Cattle Index for 3/17 was $188.01, up by 14 cents.
USDA’s NASS confirmed 11.645m head of cattle were in 1,000+ head feedlots as of 3/1. That was down 4.5% from last year, matching the trade average guess, and was the lightest inventory since October. February placements came in at 1.734m head, a 7.2% drop. The trade was looking for a 6% yr/yr drop on average. The monthly update showed 1.735m head were marketed in February, which was 5% below last year and slightly fewer than expected.
USDA’s wholesale Boxed Beef prices were mixed on Monday, with Choice down by $2.33 and Select $1.50 higher. That had the Chc/Sel spread to $7.08. USDA estimated Monday’s FI cattle slaughter at 125k head. That matched last week and is 8,000 more than the same Monday last year.
Read Full Story »»»
DiscoverGold
New Lows For Hog Market
By: Barchart | March 20, 2023
The front month lean hog futures closed Monday’s trade with triple digit losses of as much as $2.10. For April, that brought lows not seen since October of 2021, which was before April contracts were trading with significant volume - the true LoC low for April hogs is still $75.72. The deferred months did print new contract lows on the day, which for July was $93.30. USDA’s National Average Base Hog price was quoted $1.15 lower to $76.46. The CME Lean Hog Index was 6 cents higher on 3/16 to $80.01.
Pork cutout futures also dropped triple digits on Monday, going home $0.52 to $2.12 lower. USDA’s National Pork Carcass Cutout value was $81.64 in the PM report, up by 69 cents. The bellies were down another $2.05 to $88.27. The CME Fresh Bacon Index was 25 cents lower for the week that ended 3/17 to $132.39. USDA estimated FI hog slaughter at 477,000 head for Monday. That is down 7,000 from last week but is up by 8,000 above the same Monday last year.
Read Full Story »»»
DiscoverGold
Extended Downside For Cotton Market
By: Barchart | March 20, 2023
Nearby cotton futures pressed the downside on Monday, but were off their early session lows. May cotton saw a 281 point range from -176 to +105. The other front months ended the day 35 to 74 points lower. Stock market futures (SPY) bounced and the dollar ($DXY) weakened on Monday, however the bank liquidity issues heightened concerns about a recession in 2023 – and the corresponding implied loss of textile consumption.
The 3/17 Cotlook A Index was 93.55 cents/lb, UNCH from the prior quote. USDA’s weekly Cotton Market Review showed the 9,240 bales sold this week averaged 77.44 cents/lb. That brought the total spot sales to 486k bales, compared to 1.49 million at this point last year. The week’s AWP for cotton is 68.58 cents/lb. ICE certified stocks were 1,661 bales as of 3/17.
Read Full Story »»»
DiscoverGold
Today's Futures Heat Map • Strongest: Lumber, Cocoa, Copper, Russell 2000 E-Mini
By: Barchart | March 20, 2023
• Today's Futures Heat Map
Strongest: Lumber, Cocoa, Copper, Russell 2000 E-Mini
Weakest: Natural Gas, Lean Hogs, Pork Cutout, Orange Juice

Read Full Story »»»
DiscoverGold
Common Sense. The Corn & Ethanol Report
By: Daniel Flynn | March 20, 2023
We kickoff Spring with Export Inspections at 10:00 A.M., 3-Month & 6-Month Bill Auction at 10:30 A.M., and Milk Production at 2:00 P.M.
On the Corn Front NBC reports Sonoma County train derailment near the Bay, is telling me again, there is a safe way to move product and the pipelines are the answer. We could move gas, oil and hazardous materials via pipeline avoiding toxic derailments. The second train derailment in less than a week proved this point. The railroads took time of what they were carrying. Thank God the derailment in Arizona was only carrying corn syrup. There is a cheaper and safer way to move commodities and if we put a consertive effort we can achieve safer railroads and safer pipelines. It seems pretty easy to transport grains by rail and use pipelines for combustible hazardous gases through the pipelines. The banking news has the market skittish and we have to go back to basic fundamentals. WITH QUESTIONABLE EXPORTS FROM Argentina and the Ukraine corridor the market is bracing whether or not we should be concerned with a global food shortage crisis. We also have concerns about a new disease that kills corn and is spreading across the Midwest and Great Plains. The disease first appeared in the US in 2015with reports of the tar spot, fungal disease in Indiana and Illinois. The disease is spreading quickly and the fungal disease attacks the leaf tissue in corn and could rapidly deteriorate the plant. According to the Crop Protection Network, it is estimated that it caused farmers to lose $3 billion in the United States from 2018 to 2021 and has the potential to become more destructive in states now seeing cases. As the market continues to trade wondering what is the right side of the market is, we should see some action. However, the banking crisis and this weeks Fed meeting are front row and center. And we can’t forget the March 31st Grain Stocks and Prospective Plantings. In the overnight electronic session the May corn is currently trading at 630 ¾ which is 3 ½ cents lower. The trading range has been 633 ½ to 625.
On the Ethanol front the Renewable Fuels Association (RFA) helped retailers win $36 million in the latest round of Higher Blends Infrastructure Incentive Program (HBIIP), and once again the RFA helped dozens of retailers apply for, and win, grant awards that will expand the availability of higher ethanol blends like E15 and E85 flex fuel. This will put further attention on corn and the multi-uses it does not only for feed but for human consumption. There were no trades or open interest in ethanol futures.
Read Full Story »»»
DiscoverGold
No Confidence. The Energy Report
By: Phil Flynn | March 20, 2023
Oil prices are struggling as a crisis of confidence in the global banking system is overshadowing what normally would be very bullish fundamentals. The fear is that fear will lock up the economy, reversing the signs of strong demand and a looming tightness of supply. Oil prices are struggling as a crisis of confidence could cause business to retract on fears of available capital. There is, at the same time, perhaps a pullback in oil production as oil drillers fear the uncertain future.
The emergency sale of Credit Suisse Bank by UBS raised more questions than answers in regards to the low price that UBS paid and the fact that Credit Suisse said that 16 billion Swiss francs ($17.24 billion) of its additional Tier 1 debt will be written down to zero. It is not helpful that the ECB Governing Council member Martins Kazaks said that the ECB is not done increasing interest rates. Yet now reports come that Goldman Sachs expects that the Federal Reserve will pause at its March meeting this week because of stress in the banking system. JP Morgan on the other side sees that the Fed is going to go ahead with their 25-basis point increase on Wednesday. In the UK the Bank of England fully priced in a 25 basis point cut by the end of the year for the first time in four weeks. The Fed meeting this week will be critical especially because the Federal Reserve and their credibility has just taken a huge hit, especially in light of the turmoil in the banking sector. There is also a lack of confidence that the Biden administration has a handle on how to control this unwinding confidence.
On a normal day the market most likely would be focused on demand expectations reports. The Energy Information Administration reported that they expect the global oil demand will average 102.02 million barrels a day for 2023 and that is 2.0 million barrels a day higher than the average in 2022. The International Energy Agency (IEA) expects global oil demand to rise by 3.2 million barrels a day in the first quarter of 2023 to the fourth quarter of 2023. If these demand expectations come true, we are going to face a supply shortage later this year. Of course we don’t know if that’s going happen if the global economy comes off the rails.
I believe that this banking crisis is more a crisis of confidence than any underlying problems with the banks and if that’s the case, then oil is probably a great buy on these dips. On the other hand, if you think the global economy is going to come off the rails and collapse then you need to stand aside.
It’s clear that the Fed has broken things in the global banking system. The tough talk by Fed chairman Jerome Powell prior to the banking crisis unraveling in front of Congress, makes him look out of touch and he really backed himself into a deep corner. The problem is that fear can be greater than reality especially when the Fed has been so wrong on inflation. We are seeing the risk aversion trade as traders flocked to treasury bonds, gold and Bitcoin but running from oil. And if we want to focus on supply and demand for just a little bit, it looks like we’re going to have a substantial drawdown in both crude oil and products this week. We expect the crude supplies will fall by 2.5 million barrels this week we should see another big drop in gasoline inventories of close to 3.0 million barrels and distilling inventories down by 2.5 million barrels.
Amena Bakr is reporting that Kuwait oil company declares a state of emergency due to an oil spill in the West of the country. So far they say production is not affected according to the statement coming out of Kuwait.
Reuters is reporting that Russia is China’s top crude supplier for the period January and February. Their volumes have been up a whopping 23.8%. One of the good things about the global financial crisis is that the price cap that Europe put in place will not be challenged anytime soon until the banking crisis goes away.
Oil products are also getting support from the ongoing strike in France. Shipments of refined product from Total Energies has stopped and the strike is going to further tighten global supplies of diesel and gasoline. The market is not paying as much attention to it as they normally would be because of the ongoing financial meltdown due to the banking crisis of confidence.
The market is still going to be very nervous trading. You can’t really look at the fundamentals but have to look at fear and technical charts. Long term players should be using the weakness to put on long term bullish option strategies because our sense is that when the dust settles from this banking crisis, we’re going to have a shortage of oil and gas.
Spring may be coming but nobody told the natural gas market. Natural gas is getting a boost on weather driven demand as the heaters go on as temperatures fall. Look for natural gas to be range bound a bit but they do have an upward bias as LNG exports start to pick up.
Read Full Story »»»
DiscoverGold
Indices Futures were blood red overnight… recovery in progress.
Soybeans SOYB ETF Target Hit!
By: Barchart | March 19, 2023
ONE44 Analytics where the analysis is concise and to the point
Our goal is to not only give you actionable information, but to help you understand why we think this is happening based on pure price analysis with Fibonacci retracements, that we believe are the underlying structure of all markets and Gann squares.
SOYB ETF
We are now updating the article we posted below last week on the SOYB ETF as it is about to reach our target area.
The break from the 78.6% retracement and major Gann square up at 28.43 is 2 ticks away from the 38.2% and 61.8% retracements mentioned last week at 27.05 and just above the 26.94 major Gann square. This is the area that must hold to keep the short term trend positive and doing so can send it right back up to test the highs again and the 28.43 major Gann square.
A failure to hold 26.94 turns the short term trend negative and you can look for the next major Gann square below at 25.51.
Last week,
(SOYB) (ZSK23)
Using the two methods mentioned above, we can see that the market has been stopped up at the 28.43 major Gann square and 3 times it has hit a 78.6% retracement, this happened on 1/12/23, 2/13/23 and most recently right at the 28.43 major Gann square on 3/6/23.
When using the major Gann squares the target on a move away from one is to go to the next and this is the 26.94 target, In this area are two important Fibonacci retracements at 27.05, they are 38.2% back to the 7/21/22 low and 61.8% back to the 9/8/22 low. This is also the Intermediate trend swing point, above it, the target is the 30.05 major Gann square. This will also be the target once it clears the 28.43 major Gann square, even if it doesn't hit the 26.94 target below.

Read Full Story »»»
DiscoverGold
Crude Oil Weekly Forecast
By: Barchart | March 19, 2023
Weekly Forecast (March 20 – 24, 2023)
Uptrend scenario
An uptrend will start as soon, as the market rises above resistance level 72,92, which will be followed by moving up to resistance level 77,56.
Downtrend scenario
The downtrend may be expected to continue, while market is trading below resistance level 72,92, which will be followed by reaching support level 61.

Monthly Forecast, February – March 2023
Uptrend scenario
An uptrend will start as soon, as the market rises above resistance level 82,89, which will be followed by moving up to resistance level 88,65.
Downtrend scenario
The downtrend may be expected to continue, while market is trading below resistance level 82,89, which will be followed by reaching support level 72,64 – 70,86 and if it keeps on moving down below that level, we may expect the market to reach support level 66,00.

Read Full Story »»»
DiscoverGold
Soybean Weekly Forecast
By: Barchart | March 19, 2023
Weekly Forecast (March 20 – 24, 2023)
Uptrend scenario
An uptrend will start as soon, as the market rises above resistance level 1478, which will be followed by moving up to resistance level 1500.
Downtrend scenario
The downtrend may be expected to continue, while market is trading below resistance level 1478, which will be followed by reaching support level 1439,2.

Monthly Forecast, February – March 2023
Uptrend scenario
The uptrend continuation is not expected this month.
Downtrend scenario
An downtrend will start as soon, as the market drops below support level 1508, which will be followed by moving down to support level 1462, 1433 and 1400..

Read Full Story »»»
DiscoverGold
Corn Weekly Forecast
By: Barchart | March 19, 2023
Weekly Forecast (March 20 – 24, 2023)
Uptrend scenario
An uptrend will start as soon, as the market rises above resistance level 642,6 – 648,2, which will be followed by moving up to resistance level 667.
Downtrend scenario
The downtrend may be expected to continue, while market is trading below resistance level 642,6 – 648,2, which will be followed by reaching support level 606,6.

Monthly Forecast, February – March 2023
Uptrend scenario
An uptrend will start as soon, as the market rises above resistance level 688,6, which will be followed by moving up to resistance level 704,6.
Downtrend scenario
The downtrend may be expected to continue, while market is trading below resistance level 688,6, which will be followed by reaching support level 669,2, 661,2 and 648,2.

Read Full Story »»»
DiscoverGold
Wheat Weekly Forecast
By: Barchart | March 19, 2023
Weekly Forecast (March 20 – 24, 2023)
Uptrend scenario
An uptrend will start as soon, as the market rises above resistance level 720,6, which will be followed by moving up to resistance level 751,6.
Downtrend scenario
The downtrend may be expected to continue, while market is trading below resistance level 720,6, which will be followed by reaching support level 661.

Monthly Forecast, February – March 2023
Uptrend scenario
The uptrend may be expected to continue, while market is trading above support level 723, which will be followed by reaching resistance level 947,2.
Downtrend scenario
An downtrend is not expected this month.

Read Full Story »»»
DiscoverGold
What I'm Watching This Week In The Grain Markets
By: Barchart | March 19, 2023
Last night we watched “Margin Call” for what is probably the 100th time, and to be honest it hit a little differently watching it this time with all that is taking place in global banking sector currently.
For those of you who haven’t seen it, it is basically the story of an investment firm early in the late 2000’s banking crisis that discovers only after the markets start moving against them substantially, they are far too over-leveraged and must unwind their positions in a fire sale to avoid an absolute implosion. This of course, using the benefit is hindsight, is the start of the banking meltdown that resulted in the Great Recession.
Waking up this morning to news that UBS has made an offer to buy Credit Suisse for pennies on the dollar as the embattled investment bank barely hangs on, prompted me even further to look back on what started the banking crisis and what happened in commodities after.
While no two trading years are the same, they do have similarities, so to start my research journey I looked at past commodity supercycles and what their ending’s had looked like. In doing so I quickly learned we aren’t in a supercycle as defined, as a supercycle is a period of surging demand, surging supply and surging prices. While one could argue we had seen a surge in demand post-covid, the global demand curve for agricultural commodities in the months and years ahead is relatively flat.
Supply is most definitely not surging, in fact much of the increase in price was caused by supply loss or supply bottlenecks. We are seeing global supplies potentially stabilizing, but one could argue it is too early to say that as we must confirm the Brazilian safrinha crop and all of Northern Hemisphere production, something we’re at least 5 months away from doing confidently.
Prices have flatlined as of late after a tremendous surge as well, meaning that though we have experienced a pretty significant boom in agricultural commodity values, the argument we have entered a supercycle or will maintain one is moot.
My memory tends to blur together when looking back at the banking crisis that began in 2006 and its subsequent impact on commodity prices. I had started my career in 2005, when grains were on their 10th year of depressed values. In fact, my first day on the job I was instructed to call every farmer on a list (landline numbers only) and offer them $1.85 picked up for their corn.
Looking back of course, worries over the housing market and what that meant for the world economy started far before I remember even having it on my radar. I always feel like it started in 2008, when it fact it started 2 years prior with the collapse of the sub-prime lenders and the subsequent ripple effects caused by their demise. The collapse of these lenders and the worries over where money should be put that could be considered a safe sent investors running to commodities.
Up until recently I was somewhat under the impression that the current economic situation was similar and that the recent move in commodities was like what we had seen in the first decade of the millennium, an illusion I think a lot of us are wrongly living under.
The run up in price in 2008 came from incredible outside market volatility and uncertainty in the face of zero percent interest rates. There were no other safe havens that could provide growth potential with limited risk of loss. Agricultural commodities were also relatively cheap comparatively speaking to other investments at the time, with December corn starting the year in the mid $4.00 range, therefore taking cash and parking it where loss was seen as limited had value.
Speculators and managed money had avoided being significantly long commodities ahead of the housing crisis. It was not a money maker for them, and therefore was not a focus. Of course, their move to get long commodities in 2008 was supported by stories of growing demand, both for ethanol and in exports.
While the recent run up in price here that began in late 2020 was started with the idea inflation was inevitable and exacerbated by La Nina and war impacted supply reductions. This while a surge in demand for global grains that could be likened to the rush for toilet paper we saw in the early days of the pandemic, turned the situation into a price powder keg.
Looking at this year, the fund length has now been exceptionally present in the market for 3 years, with 2023 being the third year in a row of big commodity length—until recently you could say in corn and wheat.
Many want to push the idea that commodities will continue to benefit from outside market interest because they are considered a safe haven. But I will argue they are only truly a safe haven in times of low interest rates. Otherwise at these price levels without a significant supply disruption, they are an investment that will tie up a lot of capital at a time when it’s best to keep cash on hand, this not mentioning their limited potential for return compared to other investments as they remain near multi-year highs.
Of course, everyone loves to talk about 2008 and the subsequent market crash like we didn’t maintain lofty and volatile prices for the next 5 years before supply stabilized versus demand and investors felt comfortable putting their money elsewhere.
Without the luxury of knowing yet whether supply has stabilized versus demand, it is far too early to argue for anything to happen direction-wise in the market, as fundamentals remain incredibly uncertain.
But in the end, when it comes to what’s driving my Sunday Scaries this week, the fact that managed money could be leaving agricultural commodities soon sits at the top of the list. I don’t think we have to go much further back than 2019 to see what trading solid fundamentals without speculator interest looks like, as that year we faced the biggest potential loss in production since 2012 and could only get December corn to trade to $4.73.
I’m not ready to say the ag commodity story is over just yet, but I truly feel like it is something we should be willing to talk about, as the implications could be huge, especially when taking rising borrowing costs into consideration on the farm.
Other things I’m watching this week, the Black Sea Grain Corridor was extended over the weekend. Russia continues to say it is for 60 days, while Ukraine says its for 120 and the UN and Turkey remain somewhat quiet as tiebreakers. Experts say legally without amending the agreement in writing, it is good for 120 days, so I guess we will see as we look out to the end of April whether Russia is serious about 60 days or not.
Chinese President Xi is making a bold move in traveling to Moscow tomorrow. This is something we will want to watch closely as China is trying to broker peace in Ukraine and Xi is likely the only one powerful enough to convince Putin of anything. With the situation between the US and China still on thin ice, especially after recent accusations from the US that China is thinking about providing lethal aid to Russia, this meeting could have a major impact.
We are less than 2 weeks from the planting intentions report, with feet of snow still on the ground in the Northern Plains. Planting needs to get off without a hitch this year, so I’m definitely going to be watching weather as well.
Read Full Story »»»
DiscoverGold
Corn Set To Rebound
By: Barchart | March 18, 2023
And let the games begin on the way to the Final Four. Enid Brewing Company has all your basketball streaming on our 10 TVs with a full food and drink menu for all ages and so come on down! We certainly need something to distract us from all the market noise, which was heightened to extremes this week.
The banking failure starting with SVB last week has spread to several others. The Fed and FDIC announced back stops to protect deposits above the FDIC limits to avoid contagion. Wall Street banks agreed to deposit $30 billion in First Republic Bank for at least 120 days to stabilize what could have been or could be the next to fall.
It was a turbulent week that saw confidence swing wildly with each announcement. Markets rallied on news of government intervention that was quickly followed by oscillating concern that this isolated event could spread and impact other banks. While I feel somewhat confident that the worst is behind us, markets are on edge from the unknowns ahead. The ECB raised interest rates in Europe by 50 basis points despite the concerns. It is now expected that the Fed will raise rates by 25 basis points despite the recent instability to keep ahead of the inflation fight.
February’s CPI was released this week and came in line with expectations at a 0.4 percent increase and 6.0 percent above last year. The recent weakness in energy markets has helped moderate inflation although “shelter” costs continue to push upward. Crude oil plummeted this week trading a high-low range of $12.30 per barrel trading down to levels not seen since December 2021. While I believe this weakness in the energy complex is overdone right ahead of summer, the macro headlines have dominated trader attitudes.
It was this time last year that oil surged over $100 as Russia cut supplies to the West after its invasion of the Ukraine and the sanctions that followed. Price caps on Russian crude are beginning to have the intended effect impacting foreign currency earnings that dropped by $2.7 billion from January to February. Lower oil prices will also have an impact that may require Russia to pump more oil to make up the difference.
As we covered last week, the most anticipation was the renewal of the Black Sea grain export corridor that was set to expire on Saturday, March 18th. As of the time of this writing, no extension had been agreed. Russia made it’s demands for reduced sanctions to aid the export of Russian wheat in exchange for a renewal for Ukrainian exports. Earlier in the week, Russia proposed a 60-day extension that was rejected by Ukraine who asked for a 120-day extension. On Friday, this was rejected by Russia who said they held firm with the 60-day extension.
Wheat prices rallied Friday to the highest level since March 3rd closing above the 20-day moving average. Uncertainty for Black Sea exports were indeed part of the reason, but dry weather in the US winter wheat belt continues to stress conditions the crop emerging from dormancy and approaching first hollow stem.
Good-to-Excellent ratings dropped nine percentage points in Oklahoma this past week dropping back to 30 percent while 44 percent was rated Poor-to-Very Poor. Winter wheat jointing is now 12 percent, which is two percentage points ahead of normal. Kansas and Texas crops remained steady both at only 17 percent G/E, but over 50 percent P/VP. If July KC wheat can make a high above the March 3rd high at $8.39 ½, I believe we will see further continuation higher to at least the 50-day moving average at around $8.50. If wheat demand re-emerges with a cheaper US dollar recently and disruptions to Black Sea exports while seeing continued dryness in the US plains, I think we could be back to $8.80 in short order.
With China taking a much more active role in trying to negotiate a political settlement between Russia and the Ukraine starting with the grain deal, it is somewhat telling to see them purchasing large amounts of US corn this week reaching 2.1 million metric tons. China has also been a strong buyer of Brazilian safrinha corn recently.
President Xi will travel next week to Russia to meet with President Putin. It seems that something could be in the works that could see high stakes negotiations where China plays an important role that Russia will agree to. Ukraine is a large corn exporter generally and to China specifically. With China purchases of US and Brazilian corn ahead of this meeting, it could be an active week ahead for the grain markets especially wheat and corn.
With heavy snowfall this winter in the US Midwest, I anyway believe the selloff in corn was too early to price in ideal planting timing and weather. Argentine soybeans and corn crop forecasts continue to decline. All this leads me to suggest that cattle feeders should cover more of their corn needs here. The March 31st planting intensions report is coming up and will move markets. We will have to see how spring weather and planting pace emerges to gauge directional bias from there.
Friday marked the release of USDA’s monthly Cattle-on-Feed report. March 1st on-feed was as expected at 95.5 percent of last year, but came in at a 6-year low. February placements were lower than expected at 92.8 percent versus the call for 94.0 percent average trade guess. February marketings were lower then expected at 95.1 percent versus 95.6 percent. Overall, I would say this report has a bullish bias despite the lower marketings.
The macro news and uncertainties hit the cattle market hard this week as I forecast in last week’s article. There could be more weakness in feeder cattle futures if economic concerns persist into next week and corn strengthens. Friday was an inside day on feeder cattle charts. Monday’s direction should see movement in that direction on Tuesday. If we break lower, April feeders could trade $3.00 lower.
Fat cattle contracts had a difficult time this week. Cash trade was light and macro forces led to long liquidation. However, higher corn could and should lead to higher live cattle contracts. With slaughter numbers down, I think we could see some firmness return to these bids. A rebound in market confidence will be important to get the cattle complex back on the uptrend.
Read Full Story »»»
DiscoverGold
Grains Report: Wheat, Rice, Corn and Oats, Soybeans
By: Jack Scoville | March 17, 2023
• WHEAT
General Comments: Wheat markets were a little lower yesterday as negotiations with Russia to extend the grain corridor deal with Ukraine are just now getting started. Russia is talking about a short term extension while everyone else wants one for at least 120 days. Reports say that Russian offers continue to hit the world market and world prices. The problem remains demand as world supplies are not so large and US inventories are less. Ideas that big Russian offers and cheaper Russian prices would be a feature for a while in the world market was the driving force for the weaker prices, and price weakness could continue. Ideas are that both Australia and Russia are harvesting record to near record Wheat crops this year. Russia has a large production and is undercutting most world prices in the international market. The demand for US Wheat in international markets has been a disappointment all year and has been hindered by low prices and aggressive offers from Russia.
Overnight News: The southern Great Plains should get isolated to scattered showers. Temperatures should be near to below normal. Northern areas should see isolated to scattered showers. Temperatures will average below normal. The Canadian Prairies should see isolated snow showers. Temperatures should average below normal.
Chart Analysis: Trends in Chicago are mixed.. Support is at 661, 656, and 650 May, with resistance at 709, 712, and 728 May. Trends in Kansas City are mixed to up with objectives of 827, 835, and 866 May. Support is at 804, 773, and 770 May, with resistance at 832, 837, and 853 May. Trends in Minneapolis are mixed to up with objectives of 865 and 888 May. Support is at 840, 831, and 814 March, and resistance is at 860, 869, and 880 May.
• RICE:
General Comments: Rice was mostly a little4 lower yesterday in consolidation trading and trends are still up on the charts. Demand has been good from domestic sources. Export demand has been uneven but was a marketing year high in the most recent weekly export sales report. Demand has been an issue for the market all year. There is not much going on in the domestic market right now although mills are milling for the domestic market in Arkansas and are bidding for some Rice. Markets from Texas to Mississippi are called quiet. Demand in general has been slow to moderate for Rice for exports. Planting is active in Texas and southern Louisiana.
Overnight News: The Delta should get isolated showers. Temperatures should be below normal.
Chart Analysis: Trends are up with no objectives. Support is at 1714, 1695, and 1665 May and resistance is at 1749, 1762, and 1772.
• CORN AND OATS
General Comments: Corn closed higher yesterday and short term trends are up. News that China had bought over 600,000 tons of US Corn for the third day in a row was positive for higher prices. China has now bought about 1.92 million tons of US Corn this week. Oats were lower. US prices are currently very competitive with those from South America as Brazil concentrates on Soybeans exports and not Corn and US demand could improve because of the price differentials. Prices from South America should now remain strong as countries there concentrate on Soybeans exports, so the US has a chance now to see export demand improve. The Brazil Winter crop is harvested and China has been buying the surplus. The Summer crop and the Argentine crop is developing under stressful conditions. Tt has been wet so the Soybeans harvest has been delayed and the Safrinha Corn planting is becoming delayed as well. Brazil sources say that 20% of the Winter crop could be planted outside of the ideal window so yields could be hurt in the end. NOAA is forecasting that La Nina will develop this Summer and replace El Nino. US growing conditions are usually good when this happens.
Overnight News: China bought 191,000 tons of US Corn.
Chart Analysis: Trends in Corn are up with objectives of 637 and 651 May. Support is at 622, 619, and 607 May, and resistance is at 645, 648, and 652 May. Trends in Oats are mixed. Support is at 338, 333, and 328 May, and resistance is at 353, 358, and 361 May.
• SOYBEANS
General Comments: Soybeans were mixed yesterday as the Brazil harvest makes it way to the market but the Argentine harvest gets reduced again. Soybean Meal was lower and Soybean Oil was higher. Reports from Brazil show that basis levels there are under pressure due to the large crop being harvested now. In Argentina, the Buenos Aires Grain Exchange reduced its production estimate to 25 to 27 million tons, from about 40 million at the start of the year. Forecasts from NOAA for very good growing conditions in the Midwest were also a factor. Soybeans export demand is flowing to Brazil now. Argentina is the world’s largest exporter of Soybeans products while the US and Brazil battle for supremacy in Soybeans exports. It remains hot and dry in Argentina and crop conditions are getting worse. Production ideas there are still dropping and the Rosario exchange now estimates production near 27 million tons. Weather is becoming less important now as the harvest is already underway in central and northern Brazil and will spread south soon. Central and northern Brazil have seen harvest operations interrupted with too much rain but the weather is now improving and the harvest pace is increasing. Production potential for the Brazil is called very strong even with potential problems and losses in the south. Argentine production ideas continue to drop with the drought as planting is delayed and the crops already in the ground are stressed.
Overnight News:
Chart Analysis: Trends in Soybeans are mixed to down with objectives of 1458 and 1408 May. Support is at 1478, 1476, and 1472 May, and resistance is at 1500, 1516, and 1538 May. Trends in Soybean Meal are mixed to down with objectives of 462.00 and 446.00 May. Support is at 472.00, 466.00, and 465.00 May, and resistance is at 485.00, 490.00, and 498.00 May. Trends in Soybean Oil are mixed. Support is at 5650, 5540, and 5510 May, with resistance at 5820, 5850, and 5880 May.
Read Full Story »»»
DiscoverGold
Softs Report: Cotton, OJ, Coffee, Sugar, Cocoa
By: Jack Scoville | March 17, 2023
• COTTON
General Comments: Cotton was narrowly mixed to mostly a little lower yesterday, and trends are still turning down. The weekly export sales report showed good demand, and demand ideas are improving. Demand has been ramping up for the last couple of months but fell off. Some ideas that demand could soon increase more as China could start to open its economy in the next couple of weeks. China has also started buying again from Australia after refusing imports from that country for political reasons.
Overnight News: The Delta will get scattered showers and above normal temperatures. The Southeast will see isolated to scattered showers and above normal temperatures. Texas will have mostly dry conditions and near to above normal temperatures. The USDA average price is now 76.84 ct/lb. ICE said that certified stocks are now 1,661 bales, from 1,661 bales yesterday. ICE NY said that 0 notices were posted for delivery against March contracts and that total deliveries for the month are now 5 contracts.
Chart Trends: Trends in Cotton are mixed to down with objectives of 71.70 May. Support is at 77.00, 75.40, and 74.00 May, with resistance of 80.50, 80.90 and 82.50 May.
• FCOJ
General Comments: FCOJ was lower again yesterday in range trading but remains supported overall by very short Orange production estimates for Florida. Historically low estimates of production due in part to the hurricanes and in part to the greening disease that have hurt production, but conditions are significantly better now with scattered showers and moderate temperatures. The weather remains generally good for production around the world for the next crop including production areas in Florida that have been impacted in a big way by the two storms seen previously in the state. Brazil has some rain and conditions are rated good. Brazil continues to export to the EU and is increasing its exports to the US. Mexico is also exporting to the US. The Florida Dept of Citrus reported that inventories are still 38.5% below last year.
Overnight News: Florida should get scattered showers. Temperatures will average above normal. Brazil should get scattered showers and near normal temperatures. ICE NY said that 0 notices were posted for delivery against March futures and that total deliveries for the month are now 0 contracts.
Chart Trends: Trends in FCOJ are mixed. Support is at 234.00, 230.00, and 227.00 May, with resistance at 246.00, 250.00, and 253.00 May.
• COFFEE
General Comments: New York and London closed higher yesterday on reports of reduced offers into the cash market from producers after the recent fall in prices. Trends in New York turned sideways with the price action, but London trends are still mostly down. Differentials are now weakening in Brazil, Honduras, and Colombia as the recent rally has increased offers. Ideas of big production for Brazil continue due primarily to rains falling in Coffee production areas now. Vietnam is estimated to have very good production this year due to a good growing season. There are ideas that production potential for both countries has been overrated. The weather in Brazil is currently very good for production potential but worse conditions seen earlier in the growing cycle hurt the overall production prospects as did bad weather last year. Vietnam is getting less rain now to aid harvest progress but volumes offered have not increased.
Overnight News: ICE certified stocks are unchanged today at 0.788 million bags. The ICO daily average price is now 171.76 ct/lb. Brazil will get scattered showers with near to above normal temperatures. Central America will get scattered showers. Vietnam will see scattered showers. ICE NY said that 5 contracts were tendered for delivery against March futures and that total deliveries for the month are now 643 contracts.
Chart Trends: Trends in New York are mixed. Support is at 175.00, 171.00, and 170.00 May, and resistance is at 181.00, 183.00 and 185.00 May. Trends in London are mixed to down with objectives of 1990 May. Support is at 2080, 2050, and 2020 May, and resistance is at 2120, 2160, and 2190 May.
• SUGAR
General Comments: New York and London closed higher, and the trends are turning mixed in both markets. The world is still short Sugar. Indian production is thought to be 33 million tons this year or less and Thailand mills are closing earlier than expected so the crop there might be less. Brazil production is solid this year. Reports from private analysts suggest that Brazil can have a 13% increase in center-south production. Good production prospects are seen for crops in central and northern areas of Brazil, but the south has seen drier weather. European production is expected to be reduced again this year, with French planted area likely to decline to a 14 year low for Sugarbeets. Some analysts now say that Chinese production could be the lowest in six years due to bad growing conditions.
Overnight News: Brazil will get scattered showers. Temperatures should average near to above normal. India will get mostly dry conditions and near to above normal temperatures.
Chart Trends: Trends in New York are mixed to down with objectives of 2010, 1950, and 1900 May. Support is at 2030, 2010, and 1980 May and resistance is at 2100, 2130, and 2160 May. Trends in London are mixed. Support is at 583.00, 577.00, and 574.00 May and resistance is at 595.00, 603.00, and 609.00 May.
• COCOA
General Comments: New York and London closed higher, and trends are now mixed in both New York and London. Talk is that hot and dry conditions reported in Ivory Coast could curtail mid-crop production, but main crop production ideas are strong. Those ideas changed a little over the previous weekend due to heavy rains reported in Cocoa areas of the country. Ghana has reported a disease in its Cocoa to hurt production potential there. The rest of West Africa appears to be in good condition. Good production is reported for the main crop and traders are worried about the world economy moving forward and how that could affect demand. The weather is good in Southeast Asia.
Overnight News: Isolated showers are forecast for West Africa. Temperatures will be near normal. Malaysia and Indonesia should see scattered showers. Temperatures should average near normal. Brazil will get isolated showers and near to above normal temperatures. ICE certified stocks are higher today at 5.134 million bags. ICE NY said that there were 0 notices were posted for delivery against March contracts and that total deliveries for the month are now 621 contracts.
Chart Trends: Trends in New York are mixed. Support is at 2660, 2610, and 2580 May, with resistance at 2700, 2740, and 2790 May. Trends in London are mixed. Support is at 2030, 2000, and 1980 May, with resistance at 2080, 2110, and 2130 May.
Read Full Story »»»
DiscoverGold
Today's Futures Heat Map • Strongest: Lumber, Silver, Milk, Gold
By: Barchart | March 17, 2023
• Today's Futures Heat Map
Strongest: Lumber, Silver, Milk, Gold
Weakest: Natural Gas, Crude Oil, Russell 2000 E-Mini, Coffee

Read Full Story »»»
DiscoverGold
March Madness Is Upon Us. The Corn & Ethanol Report
By: Daniel Flynn | March 17, 2023
We kickoff St. Patrick’s Day with Industrial Production MoM & YoY, Manufacturing Production MoM & YoY and Capacity Utilization at 8:15 A.M., Michigan Consumer Sentiment Prel, Michigan 5-Year Inflation Expectations Prel, Michigan Consumer Expectations Prel, Michigan Current Conditions Prel, Michigan Inflation Expectations Prel, 4-Week & 8-Week Bill Auction and XCB Leading Index MoM at 9:00 A.M., Baker Hughes Oil & Total Rig Count at 12:00 P.M. and Cattle on Feed at 2:00 P.M.
On the Corn Front as we spoke before, there was a sense exports would pick up as Brazil exports slow as there 2nd harvest time is now. The Ukraine corridor remains open, and for how long? Vladimir is negotiating and playing games with the UN. Argentina is going through a horrific drought the likes have not been seen in 60 years. Some farmers have said they have never seen it this bad. With all the wildcards and shakes & bakes in the market the USDA announced a large sale of corn to China, for the third day in a row. Yesterday’s purchase was 641k tons (25 million bushels) bringing the weekly old crop purchases to 75 million bushels. The market has firmed up as farmers and traders always thought it was just a matter of time when the US export market picks up. We will see if this rally is sustainable and let’s not forget the March 31st Grain Stocks and Prospective Plantings. In the overnight electronic session the May corn is currently trading at 637 which is 4 ¼ cents higher. The trading range has been 638 ¾ to 633.
On the Ethanol Front Senators Amy Klobuchar (D-Minn) and Deb Fischer (R-Neb) introduced on Tuesday legislation that would make higher-ethanol blends available year-round, a top priority among Midwestern lawmakers. The Sale of E15 which is 15% ethanol rather than 10% ethanol, is restricted in the summer months. Last year with gas prices already too high, prices spiraled out of control following Russia’s invasion of the Ukraine, President Biden suspended the restrictions. The Environmental Protection Agency (EPA) announce a proposed rule that would authorize it’s sale year round, but it would not take effect until 2024. Another bureaucratic mess and just another day for the EPA. “Enough is enough- it’s time to remove the burdensome and nonsensical barrier that has blocked consumer access to cheaper, cleaner E15 for too long,” RFA President Geoff Cooper said in a statement. “With the summer driving season right around the corner, we call on Congress to move quickly and adopt the legislation as soon as possible.” It is time to walk the walk and not talk the talk. There were no trades or open interest in ethanol Futures.
Read Full Story »»»
DiscoverGold
Pot O’ Gold. The Energy Report
By: Phil Flynn | March 17, 2023
The directors of First Republic Bank have the luck of Irish behind them as they seemed to have found a pot o’ gold at the end of the rainbow. The biggest U.S. banks stepped in and deposited $30 billion in First Republic bringing calm to the US banking sector because Tis better to spend money like there’s no tomorrow than to spend tonight like there’s no money! Wait I think that’s what caused this mess in the first place. When it comes to spending, most politicians must suffer from a double dose of original sin. The bailout was led by Jamie Diamond who is like a four-leaf clover: hard to find but lucky to have. So, if the financial markets calm, then the oil market may fly higher than the angels in heaven because if you look at demand, we’re sucking diesel now.
Signs of demand are springing up everywhere you look. The Wall Street Journal reported that surging Chinese oil demand is pushing shipping cost sharply higher. That comes as US exports hit a 2 1/2 year high for oil with most of that going to China. The Wall Street Journal points out that Chinese crude oil imports are on track to match or surpass the record level from June of 2020 according to the commodity tracking firm Kpler. The journal says that this has been a boon for tanker owners that rent ships out.
Another strong sign of demand is the fact that Saudi Arabia’s oil export also hit a three-month high in January. That is even after they raised their selling price to Asia. Saudi crude oil exports increase by 221,000 barrels a day to a three-month high of 7.66 million barrels per day.
While demand is going up, we’re seeing global production fall. Global oil production fell to a seven month low according to JodI as reported yesterday. US production is at risk as rig counts have been falling in recent weeks. The recent plunge in price is not installing confidence to invest a lot of money to bring more production on right now. Keep an eye on today’s rig counts to get a little bit of an idea of what could come next.
Away with the fairies! OPEC is not panicking over the sudden drop in oil prices, according to Bloomberg and other sources. OPEC is blaming the crude oil decline on speculative money and the derivatives markets rather than economic fundamentals. OPEC expects the global crude market to tighten significantly later in the year and if the Chinese demand continues the way it is, most people would have to agree with them.
Stall the ball! Biden’s top advisor on oil, Amos Hochstein, says that the US is watching the oil market but they’re not in a hurry to refill the strategic petroleum reserve. Well, he says that the US is committed to refilling the reserve but they’re not in a hurry. Probably a smart thing to say if you’re getting ready to buy. Argus Media reported that President Joe Biden’s administration has delayed by roughly a year the return of more than 8mn bl of crude borrowed from the US Strategic Petroleum Reserve (SPR). The delays were approved as recently as last week, when the US Energy Department revised two “exchange” contracts it negotiated with Shell, delaying the return of 3.6mn bl of crude to the SPR until 2025. The administration last year separately revised four other contracts, delaying the return of nearly 4.5mn bl of crude initially planned to be returned to the SPR from 2022-24. The contract revisions, obtained through the Freedom of Information Act, appear at odds with remarks by US energy secretary Jennifer Granholm, who earlier this year said the administration wants to “accelerate” the return of crude exchanges as part of a three-part strategy to partially refill the SPR. With 371.6mn bl of crude in inventory, the reserve is currently at its lowest level in nearly 40 years. One part of the administration’s strategy to refill the SPR “is to accelerate some of the exchanges that were announced before to get those back in,” Granholm told reporters at the White House on 23 January. Oil companies and traders borrowed more than 27.4mn bl of crude from the SPR between September 2021 and June 2022, most under a program Biden created in hopes of bringing down gasoline prices. Under the initial contracts, companies were required to return most of the crude by 2024, along with an in-kind “premium” set at 2.3-14.6pc of the volume they borrowed. But rather than “accelerate” the return of oil to the SPR, the Energy Department has repeatedly sought to delay the return of crude, according to nearly two dozen contracts and contract modifications obtained by Argus under public records requests. The Energy Department failed to respond to repeated requests for clarification on Granholm’s remarks. Natural gas prices got a little bit of support from yesterday’s weekly natural gas storage report. The EIA showed that working gas in storage was 1.972 BCF as of Friday March the 10th. The historically warm winter has taken supplies from below average to putting supplies 23.7% above the five-year average.
May good luck be with you Wherever you go, and your blessings outnumber the shamrocks that grow. May your days be many, and your troubles be few, May all God’s blessings descend upon you, May peace be within you, May your heart be strong, May you find what you’re seeking wherever you roam. Happy Saint Patrick’s Day.
Read Full Story »»»
DiscoverGold
Maybe we see up from here… the latest drop hurt my plans. Fundamentals remain favorable.
Even with soybean oil's 2% bounce today it still remains >10% lower year-to-date in comparison with meal who's essentially unchanged since Jan 1
By: Susan David | March 16, 2023
• Even with soybean oil's 2% bounce today it still remains >10% lower year-to-date in comparison with meal who's essentially unchanged since Jan 1

Read Full Story »»»
DiscoverGold
Today's Futures Heat Map • Weakest: Lean Hogs, Pork Cutout, Palladium, Soybean Meal
By: Barchart | March 16, 2023
• Today's Futures Heat Map
Strongest: Lumber, Coffee, Natural Gas, Cocoa
Weakest: Lean Hogs, Pork Cutout, Palladium, Soybean Meal

Read Full Story »»»
DiscoverGold
Commodity price changes over the last year...
By: Charlie Bilello | March 16, 2023
• Commodity price changes over the last year...
Sugar: +10%
US CPI: +6.0%
Gold: +1%
Soybeans: -10%
Silver: -11%
Corn: -14%
Copper: -16%
Heating Oil: -16%
Gasoline: -18%
Coffee: -21%
Brent Crude: -24%
Zinc: -25%
WTI Crude: -29%
Wheat: -33%
Cotton: -34%
Natural Gas: -49%
Lumber: -58%
Read Full Story »»»
DiscoverGold
Deliveries on Crude Oil/Bonds & Notes
By: The PRICE Futures Group | March 16, 2023
• Tues, March 21st is Last Trading Day for April Crude Oil.
• Wed, March 22nd is Last Trading Day for Mar Treasury Bonds and Ten Year Notes.
Read Full Story »»»
DiscoverGold
The Corn & Ethanol Report
By: Daniel Flynn | March 16, 2023
We kickoff the day with Export Sales, Housing Starts, Housing Starts MoM, Import Prices MoM & YoY, Philadelphia Fed Manufacturing Index, Philly Fed Business Conditions, Philly Fed CAPEX Index, Philly Fed Employment, Philly Fed New Orders, Philly Fed Prices Paid, Jobless Claims 4-Week Average, Export Prices YoY and Continuing Jobless Claims at 7:30 A.M., EIA Natural Gas Storage at 9:30 A.M., and 4-Week & 8-Week Bill Auction at 10:30 A.M.
On the Corn Front old crop prices rallied 3 to 6 cents as the USDA announced the sale of 667k tons (26 mil. Bu.) of old crop corn to China making a 50 mil. Bu. total in two days. Peter Charalambous and Robinson Perez with ABC News report that a derailed train in Arizona last night was feared to be carrying hazardous materials was actually corn syrup. The area of the train derailment was previously under a tornado warning. Eight freight rail tankers derailed near Topock, Arizona, last night according to BNSF Railway. Despite initial reports from the Mojave County Sheriff’s office that the train was carrying hazardous materials, BNSF confirmed the train was actually carrying corn syrup. According to BNSF, “there were no injuries as a result of the derailment and preliminary reports indicate there were no hazardous materials involved.” We will keep you posted if other headlines develop. In the overnight electronic session the May corn is currently trading at 613 ½ which is 1 ¼ of a cent lower. The trading range has been 613 1,2 to 610 ¾.
On the Ethanol Front production last week increased to 1,014 thousand barrels per day, up from 1,010 the previous week. There was 102 mil. Bu. of corn used in the production process, slightly below the pace
Needed to reach the USDA corn usage forecast. Ethanol inventories surged to 26.4 thousand barrels, the highest level in nearly 1 year. Gasoline demand last week was down 4% from a year ago, with the 4-Week Average unchanged. There were no trades or open interest in ethanol futures.
Read Full Story »»»
DiscoverGold
Anyone Want to Buy a Bank? The Energy Report
By: Phil Flynn | March 16, 2023
Reports that regulators at the U.S. Federal Deposit Insurance Corp (FDIC) have asked banks interested in buying the failed Silicon Valley Bank and Signature Bank or the possibility that and First Republic Bank, the San Francisco-based lender that was cut to junk by S&P Global Ratings and Fitch Ratings, are exploring options including a sale, in what could be the beginning of a fire sale in the banking sector. Yet the real news are fears that these bank problems in the US have gone global and that has raised real implications for the global economy.
Oil prices plunge as a crisis of confidence plays out in the global banking sector and the competency of global central banks around the globe. Credit Suisse shares and credit default swaps plunged to distressed levels before the Swiss National Bank (SNB) after some hectic hours finally pledged some support. So 50 billion Swiss francs ($54 billion) from the Swiss National Bank in what Credit Swiss called “decisive action” to boost its liquidity caused a high comeback in shares that snapped back 40% before pulling back. Someone made a lot of money if you bet on a SNB bailout yesterday.
The question then becomes as to whether $50 billion francs will be enough to stop the global banking crisis or is it just the beginning of another financial crisis. A crisis that could derail the global economy and reduce both demand and investment in the oil and gas sector. Will lenders pull their money out of Credit Swiss? Can the Swiss National Bank handle this on their own? European Central Bank whose head Christine Lagarde previous signaled that it will take a major crisis to not raise the ECB rate by 50 basis points, now has to determine if she backs off of raising rates or stay stubborn to maintain credibility.
In the US, fed fund futures signal that the odds of the Federal Reserve standing pat at the next meeting exceeded 50% for part of the day yesterday. Predictably a lawsuit has been filed to stop Biden’s approval or partial approval of the Willow project
Yet what is clear is that central banks need to learn from history and back off the aggressive rate increases. If they don’t, it could lead to larger problems. It could undo the global financial system. We have complained before that the Federal Reserve and other central banks, after missing the early warning signs of inflation ,are now trying to correct past mistakes by being too aggressive. We have complained that the Federal Reserve members have talked too much and should allow the market to digest their previous moves before trying to jawbone the market in one direction or the other. The micromanaging of their message makes it harder for banks to adjust their position.
The financial sector and the oil and gas sector took the brunt of the pain for the credit Swiss and banking debacles. Not only did it lead to risk managers at big banks around the globe to tell their trading arms to reduce risk causing a liquidation of positions along with increased margins, but it also caused a surge in the value of the dollar which also put further downward pressure on oil and gas. This could become a problem because it could reduce much needed investment in the oil and gas sector when we need it most if the economy doesn’t collapse the investment in the oil and gas sector is not sufficient to meet demand expectations going forward.
The risk is that we will see a pullback in production is real because of the plunge in oil prices. This might be a good time for Biden to step in and buy oil for the Strategic Petroleum Reserve. Not only will it stabilize prices, but it may stop potential liquidity problems for smaller oil and gas companies. It could also save some jobs in the oil and gas sector. The money for the purchase is already there. Besides, it wouldn’t be just oil and gas because green energy companies will also get hit and potentially lose a lot more money if we have a plunging oil price and a contacting economy.
On the geopolitical front it appears that Biden’s policy of trying to make Saudi Arabia a pariah state is pushing Saudi Arabia closer to our enemies. The initiative by China to foster peace talks between Iran and Saudi Arabia seemed to be bearing fruit. The Wall Street Journal is reporting today that Iran is agreeing to stop aiming the Houthi rebels in Yemen is part of a larger peace pact with Saudi Arabia.
In Europe it appears that the price cap on Russian oil will not change. Biden told the EU that according to the Wall Street Journal the US does not support a lower price cap on Russian crude. The reason is that they know that if they lower the price cap, the odds of an oil price showdown with Russia more than likely would lead Russia to cut supply. Saudi Arabian OPEC signaled that they would not accept any price cap on their oil at any time. If you put a price cap on Saudi oil, then don’t expect to be able to buy oil directly from Saudi Arabia either.
Did the oil inventories yesterday matter? Nope, not too much. But if it were not for the global economic turmoil, it would have been very bullish. In fact, today there was also a very bullish report from Joint Organizations Data Initiative(JODI) that said that global oil production has plunged to a seven-month low in January. JODI reported that global crude production fell by 365.000 barrels a day and that was the 3rd consecutive month where global production has fallen.
This comes after the Energy Information Administration yesterday reported that Petroleum demand in the United States increased by 1.9 million barrels a day. Overall total commercial stocks of petroleum fell by 1.9 million barrels last week. The EIA did report that crude supplies in the US increased by 1.5 million barrels a day but that was offset by a large 1.9-million-barrel drop in Cushing, OK supply. They said that U.S. oil production remained flat at 12.2 million barrels a day. They did come back with another big adjustment of 2.6 million barrels a day and the overall crude supply number.
Overall, they said that crude demand increased by 2.1 million barrels a day and inputs into refineries increase by 431,000 barrels a day in US exports increased by 1.7 million barrels per day. The EIA also said that ready to use gasoline stocks fell by 3.2 million barrels a day, but overall stocks fell by 2.1 million barrels a day. Gasoline demand was up by 92,000 barrels a day last week according to the EIA. Ultra-low sulfur diesel stocks fell by 1.7 million barrels last week total distillate stocks fell by 2.5 million barrels. The EIA said that demand increase last week by 229,000 barrels a day.
So, for oil right now, we have two markets. One market that says that demand is solid, and supplies should tighten. Another one that is fearful that the banking crisis is going to create a situation where demand craters. At this point, I am more concerned that the investment in oil gas is going to suffer. That is going to lead to a bigger oil price spike down the road. Yet in the meantime you can’t fight the market turmoil. It will be interesting to see if Christine Lagarde and the ECB can create the type of confidence that the markets going to need to recover. In the meantime, it’s trade by the seat of your pants.
Not surprisingly a lawsuit has been filed against Biden’s approval of the Willow project in Alaska.
Natural gas was not immune from the global market fallout. If we see stability in the global markets, we should get a pop in natural gas as well.
Read Full Story »»»
DiscoverGold
Today's Futures Heat Map • Strongest: Treasuries, Gold, U.S. Dollar Index, Japanese Yen
By: Barchart | March 15, 2023
• Today's Futures Heat Map
Strongest: Treasuries, Gold, U.S. Dollar Index, Japanese Yen
Weakest: Crude Oil, Natural Gas, Gasoline, Heating Oil

Read Full Story »»»
DiscoverGold
Grains Report: Wheat, Rice, Corn and Oats, Soybeans
By: Jack Scoville | March 15, 2023
• WHEAT
General Comments: Wheat markets were higher yesterday as negotiations with Russia to extend the grain corridor deal with Ukraine are just now getting started and are centered on a 60 day extension of the agreement. Reports say that Russian offers continue to hit the world market and world prices. USDA made no changes to the US supply or demand but did cut world ending stocks levels. The funds maintain a huge short position in this market. The problem remains demand as world supplies are not so large and US inventories are less. Ideas that big Russian offers and cheaper Russian prices would be a feature for a while in the world market was the driving force for the weaker prices, and price weakness could continue. Ideas are that both Australia and Russia are harvesting record to near record Wheat crops this year. Russia has a large production and is undercutting most world prices in the international market. The demand for US Wheat in international markets has been a disappointment all year and has been hindered by low prices and aggressive offers from Russia.
Overnight News: The southern Great Plains should get isolated showers. Temperatures should be near to below normal. Northern areas should see mostly dry conditions. Temperatures will average below normal. The Canadian Prairies should see isolated snow showers. Temperatures should average below normal.
Chart Analysis: Trends in Chicago are mixed.. Support is at 661, 656, and 650 May, with resistance at 702, 709, and 722 May. Trends in Kansas City are mixed to up with objectives of 827, 835, and 866 May. Support is at 804, 773, and 770 May, with resistance at 815, 832, and 837 May. Trends in Minneapolis are mixed. Support is at 814, 808, and 802 March, and resistance is at 853, 860, and 869 May.
• RICE:
General Comments: Rice was sharply higher yesterday and trends have are up on the charts. Demand has been good from domestic sources. Export demand has been uneven but was a marketing year high in the most recent weekly export sales report. Demand has been an issue for the market all year. There is not much going on in the domestic market right now although mills are milling for the domestic market in Arkansas and are bidding for some Rice. Markets from Texas to Mississippi are called quiet. Demand in general has been slow to moderate for Rice for exports. Planting is active in Texas and southern Louisiana.
Overnight News: The Delta should get isolated showers. Temperatures should be below normal.
Chart Analysis: Trends are up with no objectives. Support is at 1695, 1665, and 1625 May and resistance is at 1724, 1742, and 1746.
• CORN AND OATS
General Comments: Corn closed higher yesterday after trading both sides of unchanged. News that China had bought over 600,000 tons of US Corn was positive for higher prices. Oats were higher. US prices are currently very competitive with those from South America as Brazil concentrates on Soybeans exports and not Corn and US demand could improve because of the price differentials. Prices from South America should now remain strong as countries there concentrate on Soybeans exports, so the US has a chance now to see export demand improve. The Brazil Winter crop is harvested and China has been buying the surplus. The Summer crop and the Argentine crop is developing under stressful conditions. Tt has been wet so the Soybeans harvest has been delayed and the Safrinha Corn planting is becoming delayed as well. Brazil sources say that 20% of the Winter crop could be planted outside of the ideal window so yields could be hurt in the end. NOAA is forecasting that La Nina will develop this Summer and replace El Nino. US growing conditions are usually good when this happens.
Overnight News: China bought 667,000 tons of US Corn
Chart Analysis: Trends in Corn are mixed. Support is at 607, 603, and 600 May, and resistance is at 622, 630, and 634 May. Trends in Oats are mixed. Support is at 342, 338, and 333 May, and resistance is at 353, 358, and 361 May.
• SOYBEANS
General Comments: Soybeans were higher yesterday as the Brazil harvest makes it way to the market. Soybean Meal was lower and Soybean Oil was higher. Reports from Brazil show that basis levels there are under pressure due to the large crop being harvested now. Forecasts from NOAA for very good growing conditions in the Midwest were also a factor. Argentine production was cut and could be cut eve n more in coming USDA reports but Brazil production was not and the Brazil crop is coming to export channels and that is bearish to US prices. Soybeans export demand is flowing to Brazil now. Argentina is the world’s largest exporter of Soybeans products while the US and Brazil battle for supremacy in Soybeans exports. It remains hot and dry in Argentina and crop conditions are getting worse. Production ideas there are still dropping and the Rosario exchange now estimates production near 27 million tons. Weather is becoming less important now as the harvest is already underway in central and northern Brazil and will spread south soon. Central and northern Brazil have seen harvest operations interrupted with too much rain but the weather is now improving and the harvest pace is increasing. Production potential for the Brazil is called very strong even with potential problems and losses in the south. Argentine production ideas continue to drop with the drought as planting is delayed and the crops already in the ground are stressed.
Overnight News:
Chart Analysis: Trends in Soybeans are down with objectives of 1458 and 1408 May. Support is at 1484, 1478, and 1476 May, and resistance is at 1516, 1538, and 1549 May. Trends in Soybean Meal are mixed. Support is at 476.00, 472.00, and 466.00 May, and resistance is at 490.00, 498.00, and 502.00 May. Trends in Soybean Oil are mixed to down with no objectives. Support is at 5540, 5510, and 5390 May, with resistance at 5740, 5820, and 5850 May.
Read Full Story »»»
DiscoverGold
Softs Report: Cotton, OJ, Coffee, Sugar, Cocoa
By: Jack Scoville | March 15, 2023
• COTTON
General Comments: Cotton was higher again yesterday, and trends are now mixed after breaking on Friday in a convincing way from a sideways trading pattern established last November. Futures are now at the lower end of the previous trading range and are through some resistance areas. The WASDE reports were negative to prices as USDA left US demand alone and raised world ending stocks. Demand ideas are improving. Demand was very strong in the report the previous week and has been ramping up for the last couple of months but fell off. Some ideas that demand could soon increase more as China could start to open its economy in the next couple of weeks. China has also started buying again from Australia after refusing imports from that country for political reasons.
Overnight News: The Delta will get scattered showers and above normal temperatures. The Southeast will see isolated to scattered showers and above normal temperatures. Texas will have mostly dry conditions and near to above normal temperatures. The USDA average price is now 78.98 ct/lb. ICE said that certified stocks are now 1,661 bales, from 1,661 bales yesterday. ICE NY said that 0 notices were posted for delivery against March contracts and that total deliveries for the month are now 5 contracts.
Chart Trends: Trends in Cotton are mixed to down with objectives of 77.70, 77.60, and 71.70 May. Support is at 80.50, 78.80, and 78.00 May, with resistance of 83.70, 84.40 and 86.20 May.
• FCOJ
General Comments: FCOJ was sharply higher yesterday but remains supported overall by very short Orange production estimates for Florida. The market tone is mixed as USDA slightly raised Florida Oranges production estimates to 16.1 million boxes from 16.0 million in its previous estimate and more than 60% below the production from last year. Historically low estimates of production due in part to the hurricanes and in part to the greening disease that have hurt production, but conditions are significantly better now with scattered showers and moderate temperatures. The weather remains generally good for production around the world for the next crop including production areas in Florida that have been impacted in a big way by the two storms seen previously in the state. Brazil has some rain and conditions are rated good. Brazil continues to export to the EU and is increasing its exports to the US. Mexico is also exporting to the US. The Florida Dept of Citrus reported that inventories are still 38.5% below last year. Nielsen said that Orange Juice retail prices hit a new high in the US. This is the fifth consecutive month of new highs reported and the highest price reported since at least 2001. The current price is now 8.85/gallon, up 14% from last year.
Overnight News: Florida should get scattered showers. Temperatures will average above normal. Brazil should get scattered showers and near normal temperatures. ICE NY said that 0 notices were posted for delivery against March futures and that total deliveries for the month are now 0 contracts.
Chart Trends: Trends in FCOJ are mixed. Support is at 234.00, 230.00, and 227.00 May, with resistance at 246.00, 250.00, and 253.00 May.
• COFFEE
General Comments: New York and London closed lower yesterday. Differentials are now weakening in Brazil, Honduras, and Colombia as the recent rally has increased offers. Ideas of big production for Brazil continue due primarily to rains falling in Coffee production areas now. Vietnam is estimated to have very good production this year due to a good growing season. There are ideas that production potential for both countries has been overrated. The weather in Brazil is currently very good for production potential but worse conditions seen earlier in the growing cycle hurt the overall production prospects as did bad weather last year. Vietnam is getting less rain now to aid harvest progress but volumes offered have not increased.
Overnight News: ICE certified stocks are higher today at 0.785 million bags. The ICO daily average price is now 167.97 ct/lb. Brazil will get scattered showers with near to above normal temperatures. Central America will get scattered showers. Vietnam will see scattered showers. ICE NY said that 1 contract was tendered for delivery against March futures and that total deliveries for the month are now 638 contracts.
Chart Trends: Trends in New York are mixed. Support is at 174.00, 171.00, and 170.00 May, and resistance is at 183.00, 185.00 and 190.00 May. Trends in London are down with objectives of 2080 and 1990 May. Support is at 2070, 2020, and 2000 May, and resistance is at 2120, 2160, and 2190 May.
• SUGAR
General Comments: New York and London closed lower, and the markets held once again to a sideways trend. Indian production is thought to be 33 million tons this year or less and the market has had to ration that supply via price. Thailand mills are closing earlier than expected so the crop there might be overrated and Brazil production is solid this year. Reports from private analysts suggest that Brazil can have a 13% increase in center-south production. Good production prospects are seen for crops in central and northern areas of Brazil, but the south has seen drier weather. There is concern that the rainy areas will stay too wet and delay the harvest and dilute the Sugar concentrations in the cane in central areas. European production is expected to be reduced again this year, with French planted area likely to decline to a 14 year low for Sugarbeets. Some analysts now say that Chinese production could be the lowest in six years due to bad growing conditions.
Overnight News: Brazil will get scattered showers. Temperatures should average near to above normal. India will get mostly dry conditions and near to above normal temperatures.
Chart Trends: Trends in New York are mixed. Support is at 2060, 2040, and 2010 May and resistance is at 2130, 2160, and 2190 May. Trends in London are mixed. Support is at 574.00, 566.00, and 561.00 May and resistance is at 595.00, 603.00, and 609.00 May.
• COCOA
General Comments: New York and London closed higher. Trends remain down in both New York and London. Talk is that hot and dry conditions reported in Ivory Coast could curtail mid-crop production, but main crop production ideas are strong. Those ideas changed a little over the previous weekend due to heavy rains reported in Cocoa areas of the country. Ghana has reported a disease in its Cocoa to hurt production potential there. The rest of West Africa appears to be in good condition. Good production is reported for the main crop and traders are worried about the world economy moving forward and how that could affect demand. The weather is good in Southeast Asia.
Overnight News: Isolated showers are forecast for West Africa. Temperatures will be near normal. Malaysia and Indonesia should see scattered showers. Temperatures should average near normal. Brazil will get isolated showers and near to above normal temperatures. ICE certified stocks are higher today at 5.072 million bags. ICE NY said that there were 1 notice was posted for delivery against March contracts and that total deliveries for the month are now 621 contracts.
Chart Trends: Trends in New York are down with objectives of 2620 and 2500 May. Support is at 2620, 2580, and 2550 May, with resistance at 2700, 2740, and 2790 May. Trends in London are down with objectives of 2010 and 1940 May. Support is at 2030, 2000, and 1980 May, with resistance at 2080, 2110, and 2130 May.
Read Full Story »»»
DiscoverGold
De Risk. The Energy Report
By: Phil Flynn | March 15, 2023
Another day another bank failure. The banking crisis is causing a deleveraging by big banks, pulling back their exposure to oil and causing prices to fall harder than other risk assets. Credit Suisse is causing todays turmoil after the Saudi National bank Chairman Ammar Al Khudairy ruled out more assistance from their bank. He does not think they will need any more money. The stockholders see it differently, selling shares causing a halt in the stock and shares down over 20%. The Fed swaps are now pricing in 100% chance of an interest rate cut in December.
The oil moves smack of market liquidation as opposed to anything directly related to current supply demand fundamentals. This is evidenced by substantial drawdown in oil product inventories as reported by the American Petroleum Institute (API) which reported that gasoline supply fell by 4.587 million and distillates by 2.886 million. Even the reported 1.155-million-barrel increase in crude oil supply was tempered by a reported 946,000-barrel drop in Cushing, Oklahoma supply. Yet supply and demand for oil do not matter when we have a run on the bank.
Even the International Energy Agency (IEA) is warning that oil supply that they say is currently in an oversupply situation, will turn to a supply deficit later in the year. The IEA says that oil is currently oversupplied due to Russia looking for a home for its oil. Yet It is also being reported that Russia’s oil exports dropped by 500.000 barrels a day in February to 7.5 million barrels a day and they could make good on their threat to cut production by a similar amount.
The IEA did say the global stockpiles did increase by 7.8 billion barrels, the largest level since 2021 but still believe that the market could flip to an undersupply situation. At the very least, the market should be balanced by the middle of the year.
This comes as reports from the Chinese and Saudi finance ministers that says early signs on the China reopening are promising. They also said that Saudi investments into Iran could happen very quickly following an agreement. Who said Biden couldn’t bring the world closer together? He’s doing a great job pushing Russia and China closer together and now Saudi Arabia and Iran. Arab News reports that Saudi Energy Minister Prince Abdulaziz bin Salman said on Tuesday that the Kingdom will not sell oil to any country that attempts to impose a price cap on its supplies.
Reuters is also reporting that China is on track to import 5.39 million tonnes of LNG in March, according to data compiled by commodity analysts Kpler. This would be up from February’s 4.96 million tonnes and above the 4.77 million from March last year.
Prince Abdulaziz said in an interview published by Energy Intelligence that placing a ceiling on oil prices would inevitably lead to market instability, and Saudi Arabia would reduce its oil production. The Prince added that OPEC+ group of oil-producing nations had succeeded in bringing significant stability and transparency to the oil market, especially in comparison to all other commodities markets. “The NOPEC bill does not recognize the importance of holding spare capacity, and the consequences of not holding spare capacity on market stability,” he said.
EBW on natural gas is saying that the April contract found support early this week after last week’s 19% plunge from overbought levels north of $3.00/MMBtu. A modest bullish weather shift and three consecutive colder weeks ahead for the first time this winter could enable NYMEX futures to trend moderately higher in coming weeks. Fundamentally, the storage surplus vs. the five-year average may narrow more than 100 Bcf after Thursday’s EIA report—a sharp departure from repeatedly building inventory surpluses for the past three months.
I believe that the banking crisis sell off at this point is overdone on oil and we should find some stability shortly as soon as there’s a perception that the dominoes are going to stop falling. We should have a significant rebound in the short term and see some extreme turbulence so make sure you keep your seat belt buckled.
Read Full Story »»»
DiscoverGold
Today's Futures Heat Map • Strongest: Orange Juice, Hard Red Wheat, Wheat, Mexican Peso
By: Markets & Mayhem | March 14, 2023
• Today's Futures Heat Map
Strongest: Orange Juice, Hard Red Wheat, Wheat, Mexican Peso
Weakest: Crude Oil, Lumber, Coffee, Natural Gas

Read Full Story »»»
DiscoverGold
Deliveries on Lumber/Cocoa/Crude
By: The PRICE Futures Group | March 14, 2023
• Tomorrow is Last Trading Day for March Lumber.
• Thurs, Mar 16th is Last Trading Day for ICE Cocoa and London Cocoa.
• Next Tues, March 21st is Last Trading Day for April Crude oil.
Read Full Story »»»
DiscoverGold
Agriculture Master Report
By: Bill Moore | March 14, 2023
MAY BEANS
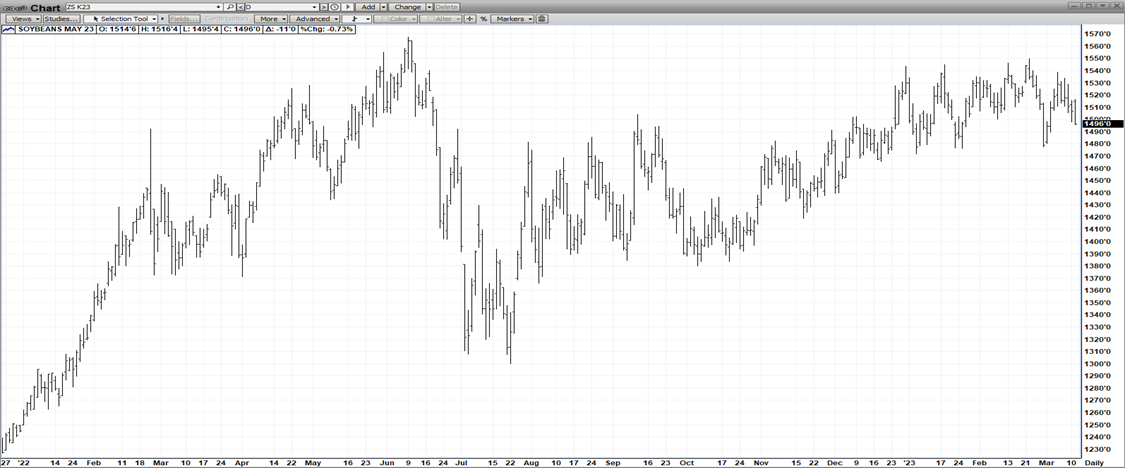
This morning, the mkt witnessed a classic confrontation between bearish Macro events & bullish fundamentals – which opened the mkt sharply lower but saw it rebound up & stabilize after President Bidens reassuring talk at 8am! After 2 California banks went under over the W/E, he assured the nation the Fed would support the depositors & that a mass financial contagion wouldn’t evolve! At the same time, Argentina’s drought worsened over the W/E – with crop estimates being ratcheted down – Beans 24-26 MMT (USDA – 33) & Corn 33-36 MMT (USDA – 40)! The combination of the big drop last week, the historic drought in Argentina, the cheapening US $ & a reopening China – bodes well for 2023 exports!
MAY CORN

May Corn’s 65 cent drop (680-665) since mid-Feb has improved Corn’s competitiveness on the World Export Market -and that coupled with a US Dollar 1000 points off it Sept highs, the severe Argentine drought – now with losses exceeding the gains from the record Brazilian crop & finally the re-emergence of China on the World Export Mkt – all point to a very improved export picture going into our planting season! The global stocks are already on 6-7 year lows & and any production hiccup in the Northern Hemisphere will send prices back over $7.00!
MAY WHEAT
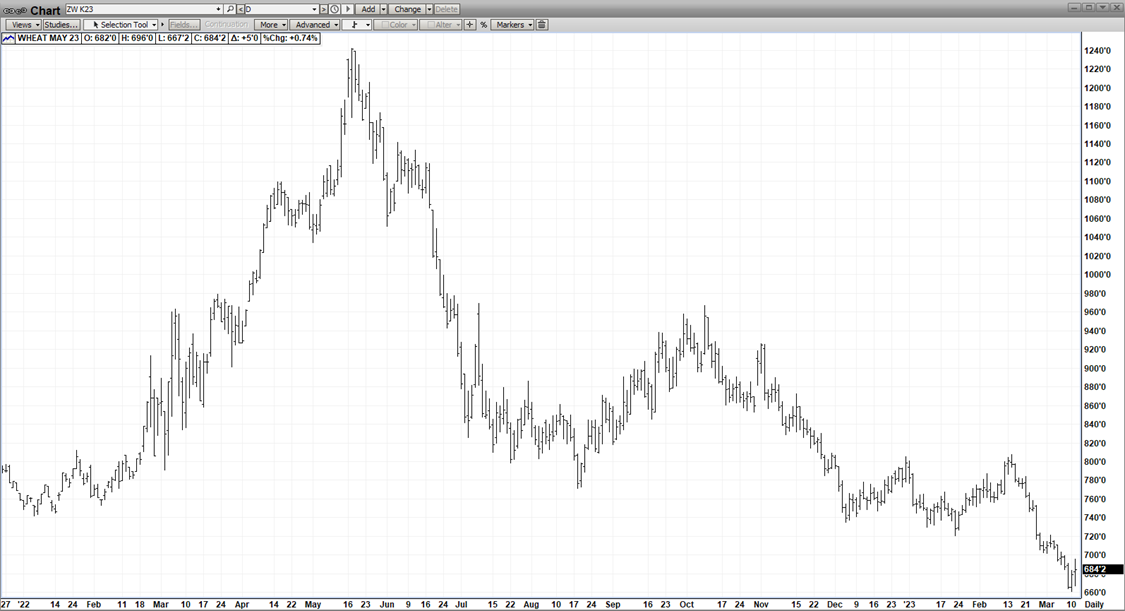
Sometimes, a mkt “looks so bad, it’s good”! That would be the case with May Wht which has been battered down to 2-yr lows by a relentless flow of Cheap Russian wht – which has effectively put a cap on recent rallies! So, from an extreme, oversold position with a large, short open interest, the mkt is susceptible – at any time – to sharp short-covering rallies – due to any production issues worldwide such as the possible heat wave in India or the failure of the Russia-Ukraine Corridor Deal to be renewed! The inability of the mkt to make new lows this morning off the bank closures demonstrates solid “bullish divergence”!
APRIL CAT
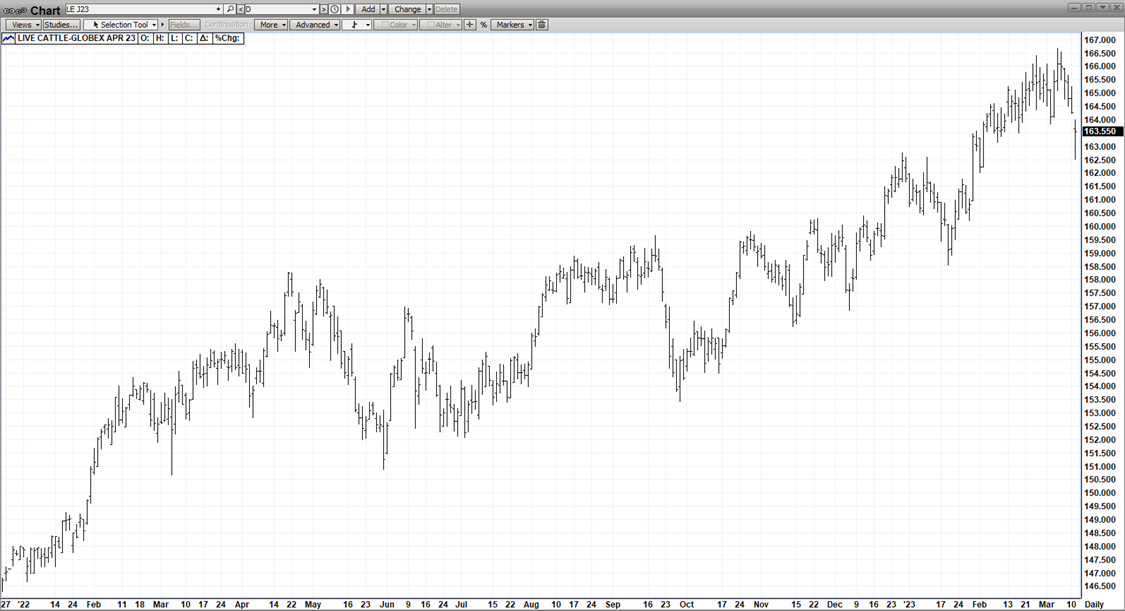
After congesting for 6 weeks in a tight range (163.50 – 166.50), Apl Cat dropped to new 6-wk lows at 162.50 – although, it closed just off its daily highs! The downside impetus was provided by the macro sector -as two California banks closed over the W/E – creating some financial chaos yesterday! The DJI has since stabilized as President Biden gave a 8am news conference Mon– reassuring depositors! The cattle mkt continues to be a supply bull as beef production last week was down 5.2% from a year ago – and weight remain low enough to keep producers current. But slow exports, a sluggish beef mkt & some technical damage have traders on alert as to a possible top in the mkt! But we feel, it’s just a correction with supplies very tight & the Spring Barbeque Demand just around the corner! The USDA will provide further info this Friday at 2pm with their March Cattle-On-Feed Report!
APL HOGS

April Hogs had a solid 4-day $4.00 rally rudely interrupted by two California bank closures over the W/E sending financial mkts into a tailspin – and creating a general risk-off environment for all commodities! So, the mkt has relinquished one-half of that rally! Still, they are promising signs the mkt scored a spike-low back in Feb as the massive supply is being priced in & the mkt’s much-higher-than-normal premium to cash of $6.29 is very encouraging! We feel the coming Spring Demand will rally this mkt out of its recent consolidation pattern!
Read Full Story »»»
DiscoverGold
The Corn & Ethanol Report
By: Daniel Flynn | March 14, 2023
We kickoff the day with NFIB Business Optimism Index at 5:00 A.M., CPI sa, CPI, Inflation Rate MoM & YoY, and Core Inflation Rate MoM & YoY ay 7:30 A.M. Redbook YoY at 7:55 A.M., API Energy Stocks at 7:30 A.M., Fed Bowman Speech and International Monetary Market (IMM) at 4:20 P.M.
On the Corn Front we have Last trading Day on all March grains. The market is waiting for this morning’s CPI after the Silicon Valley Bank failures. Where were the regulators? Regulation failed us again being asleep at the switch with and also having an SVB officers on the regulation committee. The fact was that SVB was Interest Rate sensitive and with all the startups for solar power were feeling the wrath of spending money by the government and the Fed raising rates to combat inflation. Can you see this recipe for disaster? More banks may be in trouble and analysts pointed out Credit Suisse is also Interest Rate sensitive This sounds like 2008 all over again and who is going to pick up the bill? Biden said a fund banks set aside but are there more failures on the way. Getting back to the corn market there are many reasons the market is sluggish with the bank news, state of the economy, and UN negotiations to reopen the Ukraine export corridor, sluggish exports and Brazil harvesting. The Argentine crop is in bad shape and the Ukraine is lacking of herbicides and pesticides for spring sowing. It could be the farmers were right on the money when they predicted months ago that we may see global food shortages. Will we keep our ears out to see if any more of this story develops. In the overnight electronic session the May corn is currently trading at 610 ¾ which is 2 ¾ cents lower. The trading range has been 614 ½ to 610 ¾.
On the Ethanol Front the market analysis is trying to understand the current state and current trends 2023-2028. The latest ethanol market (106 pages) report with Compound Annual Growth Rate (CAGR) of 6.51 % during the forecast period, offers a dashboard overview of specific regional developments, dynamics, industry segmentations, growth factors, and size if the Industry. It also sheds light on the Leading Players analysis – LyondellBasell Industries NV, Cargill Corporation, Mitsubishi Chemical Corporation, Greenfield, Andersons Ethanol Group, and British Petroleum. The global ethanol market size was valued at USD 52824.91 million in 2022 and is expected to expand at a CAGR of 6.51% during the forecast period, reaching USD 77138.17 million by 2028. There were no trades or open interest in ethanol futures.
Read Full Story »»»
DiscoverGold
Oil Market Recession. The Energy Report
By: Phil Flynn | March 14, 2023
The oil market is acting like a recession is inevitable or at the very least, we are seeing serious deleveraging of oil contracts. With more reports that signal more robust demand in China and with the dollar pulling back, one would think oil would be holding up against all this economic turmoil.
The SVB bank failure and fears of contagion are still raging even as stocks find some stability. Oil seems to be getting focused on because of the fall out and now the latest bank drama is Credit Suisse. They say they found some material weakness in their financial reporting! Everyone should stop driving their cars until we find out what it is! Besides, it will help the Fed deal with the inflation mess and banking mess they helped to create.
India says they have not agreed to a Russian price cap because they know that they will need Russian oil. Shweta Shaw reports that it’s like Indian refiners are using same Russian cheap oil, refining it and exporting it to Europe. Basically, Russian oil is reaching EU markets via India.
In the US, drilled but uncompleted wells are on the rise. The EIA reported that drilled but uncompleted wells rose by 21 m/m to 4,773 in February in a reversal of trend that could signal that inflation costs are slowing down completions.
The Wall Street Journal reports that, “declining energy prices go some way toward explaining this year’s unexpectedly strong economic data in the U.S. and Europe, economists say. Supply-chain managers on both sides of the Atlantic are more optimistic than they have been in many months, according to business surveys by S&P Global, a closely watched indicator of future growth. the windfall for households, businesses and governments is offsetting higher borrowing costs as central banks push up interest rates to cool historically high inflation. The price of a barrel of oil has fallen by more than a third since the middle of last year, to about $77 from $121, below its prewar level, as markets adjusted to Western embargoes of Russian supply and as oil was released from emergency reserves. Some economists warned a reopening Chinese economy would push oil prices higher, but that hasn’t happened yet according to the Journal.
Yet another report showing that Chinese product exports are falling is another sign that Chinese demand is on the rise.
Oil will be impacted today by the inflation data and the OPEC outlook. For the oil market, what we are seeing is a fear-based selloff and oil is out of whack with other markets. The oil sell-off is more than likely financially related and deleverage as opposed to supply and demand. If oil is the canary in the coal mine, then we are headed for a deep recession. If it is just a margin call, then it is a screaming buy. We still believe that this is a buying opportunity. We should start getting significant draw downs in crude and product supply.
The natural gas market is still in an impressive recovery mode. Cold weather along with LNG exports expectations rising is giving the market a boost.
Read Full Story »»»
DiscoverGold
Since Thursday of last week, bonds are running hard.
Today's Futures Heat Map • Strongest: Palladium, Silver, Natural Gas, Platinum
By: Barchart | March 13, 2023
• Today's Futures Heat Map
Strongest: Palladium, Silver, Natural Gas, Platinum
Weakest: Gasoline, Orange Juice, Mexican Peso, Crude Oil

Read Full Story »»»
DiscoverGold
Grains Report: Wheat, Rice, Corn and Oats, Soybeans
By: Jack Scoville | March 13, 2023
• WHEAT
General Comments: Wheat markets were lower last week in trading in response to the WASDE reports and on reports that Russian offers continue to hit the world market and world prices. USDA made no changes to the US supply or demand but did cut world ending stocks levels. The funds maintain a huge short position in this market. The problem remains demand as world supplies are not so large and US inventories are less as well. Ideas that big Russian offers and cheaper Russian prices would be a feature for a while in the world market was the driving force for the weaker prices, and price weakness could continue. The war in Ukraine continues, but Russia is expected to allow the grain export program to continue in one form or another. Ideas are that both Australia and Russia are harvesting record to near record Wheat crops this year. Russia has a large production and is undercutting most world prices in the international market. The demand for US Wheat in international markets has been a disappointment all year and has been hindered by low prices and aggressive offers from Russia.
Overnight News: The southern Great Plains should get isolated to scattered showers. Temperatures should be near to below normal. Northern areas should see isolated to scattered showers. Temperatures will average near to below normal. The Canadian Prairies should see isolated snow showers. Temperatures should average below normal.
Chart Analysis: Trends in Chicago are down with no objectives. Support is at 661, 656, and 650 May, with resistance at 702, 709, and 722 May. Trends in Kansas City are down with objectives of 715 May. Support is at 773, 770, and 764 May, with resistance at 805, 815, and 832 May. Trends in Minneapolis are down with no objectives. Support is at 814, 808, and 802 March, and resistance is at 853, 860, and 869 May.
• RICE:
General Comments: Rice was narrowly sharply lower again last week. Trends are down on the charts. The USDA WASDE reports showed reduced export demand but this was already factored into the price structure as the selling had come before the release of the reports. Demand has been good from domestic sources. Export demand has been uneven but was a marketing year high in the most recent weekly export sales report. Demand has been an issue for the market all year. There is not much going on in the domestic market right now although mills are milling for the domestic market in Arkansas and are bidding for some Rice. Markets from Texas to Mississippi are called quiet. Demand in general has been slow to moderate for Rice for exports. Planting is active in Texas and southern Louisiana.
Overnight News: The Delta should get mostly dry conditions. Temperatures should be above normal.
Chart Analysis: Trends are down with objectives of 1561 May. Support is at 1625, 1620, and 1608 May and resistance is at 1666, 1694, and 1714.
• CORN AND OATS
General Comments: Corn closed lower last week on selling tied to the release of the WASDE reports and on forecasts for good weather conditions for the growing season in the US. Oats were higher. USDA left the supply side unchanged in its WASDE reports for the US but cut export demand and also increased US and world ending stocks levels. US prices are currently very competitive with those from South America and US demand could improve because of the price differentials. Prices from South America should now remain strong as countries there concentrate on Soybeans exports, so the US has a chance now to see export demand improve. The Brazil Winter crop is harvested and China has been buying the surplus. The Summer crop and the Argentine crop is developing under stressful conditions. The next Winter crop is going into the ground in good conditions, but it has been wet so the Soybeans harvest has been delayed and the Corn planting is becoming delayed as well. Reports indicate that the weather is now better in central and northern Brazil and that the Corn planting pace is improved. However, Brazil sources say that 20% of the Winter crop could be planted outside of the ideal window so yields could be hurt in the end. NOAA is forecasting that La Nina will develop this Summer and replace El Nino. US growing conditions are usually good when this happens.
Overnight News:
Chart Analysis: Trends in Corn are down with objectives of 593 May. Support is at 606, 603, and 600 May, and resistance is at 622, 630, and 634 May. Trends in Oats are up with no objectives. Support is at 342, 338, and 333 May, and resistance is at 353, 358, and 361 May.
• SOYBEANS
General Comments: Soybeans were lower last week on selling tied to the response to the release of the WASDE reports that showed reduced domestic demand but much more export demand. Selling also came from ideas of increased Brazil offers into the world market and reduced US export demand. Reports from Brazil show that basis levels there are under pressure due to the large crop being harvested now. Forecasts from NOAA for very good growing conditions in the Midwest were also a factor. Argentine production was cut but Brazil production was not and the Brazil crop is coming to export channels and that is bearish to US prices. Soybeans export demand is flowing to Brazil now. Argentina is the world’s largest exporter of Soybeans products while the US and Brazil battle for supremacy in Soybeans exports. The South American harvest coming to export channels now. It remains hot and dry in Argentina and crop conditions are getting worse. Production ideas there are still dropping and the Rosario exchange now estimates production near 27 million tons. Weather is becoming less important now as the harvest is already underway in central and northern Brazil and will spread south soon. Central and northern Brazil have seen harvest operations interrupted with too much rain but the weather is now improving and the harvest pace is increasing. Production potential for the Brazil is called very strong even with potential problems and losses in the south. Argentine production ideas continue to drop with the drought as planting is delayed and the crops already in the ground are stressed.
Overnight News:
Chart Analysis: Trends in Soybeans are mixed. Support is at 1498, 1489, and 1478 May, and resistance is at 1513, 1538, and 1549 May. Trends in Soybean Meal are mixed to up with objectives of 506.00 and 529.00 May . Support is at 476.00, 472.00, and 466.00 May, and resistance is at 487.00, 498.00, and 502.00 May. Trends in Soybean Oil are down with objectives of 5570 May. Support is at 5510, 5390, and 5280 May, with resistance at 5820, 5850, and 5980 May.
Read Full Story »»»
DiscoverGold
|
Followers
|
89
|
Posters
|
|
|
Posts (Today)
|
0
|
Posts (Total)
|
8821
|
|
Created
|
05/01/07
|
Type
|
Free
|
| Moderators DiscoverGold Pro-Life | |||
- The Commodity Bull is Running... Inflation is Running... Harder Living (i.e. FOOD, CLOTHING, SHELTER) is Dead Ahead... -
- Commodity Futures Trading -
http://finviz.com/futures_performance.ashx
All Commodity Futures Charts From Finbiz.com Available Below:
Daily
Weekly
Monthly
Quarterly
6 Months
12 Months
YTD
2 Years
5 Years
Max
Beneficial Educational Resources on Futures TradingThe futures market is volatile, and it cuts both ways. Leverage that makes it profitable can also ruin reckless, undisciplined traders overnight. Most brokers have paper trading available on their platforms, so those who are new to futures should take advantage and learn with these tools before going live with real money. Mitigate risk with stop loss orders at all times, and cut losses quickly instead of adding contracts and attempting to flip your way out of a losing position. Also, use mini instruments when available, with lower margin requirements, until you have sufficient capital to buy and sell more expensive contracts. Even though the potential is there, don't try to make too many profits at once. If things aren't going well, often times quitting for the day and collecting one's thoughts is the best decision. New opportunities come along daily. Markets are open nearly 24 hours, so set a schedule and stick to it. Avoid trading while tired or distracted, and please don't listen to the advice of others. Do research on fundamentals affecting markets as well as paying attention to TA. Watch key indices, and listen to accurate, real-time news during the session to stay aware of shifting trends. Trade smart, trade safely, and have fun.
Videos on Futureshttps://www.youtube.com/playlist?list=PL9A5C5A93D243CA44 Continuous Improvement in Progress |
Commodity Futures Trading
https://www.tdameritrade.com/investment-products/futures-trading.page
| Volume | |
| Day Range: | |
| Bid Price | |
| Ask Price | |
| Last Trade Time: |


