 News
News  Market Data
  Discover
Support: 888-992-3836
Copyright © 2023 InvestorsHub Inc.


Register for free to join our community of investors and share your ideas. You will also get access to streaming quotes, interactive charts, trades, portfolio, live options flow and more tools.
Softs Report: Cotton, OJ, Coffee, Sugar, Cocoa
By: Jack Scoville | March 13, 2023
• COTTON
General Comments: Cotton was lower last week and has now broken down in a convincing way from a sideways trading pattern established last November on follow through selling tied to the WASDE reports and on disappointing weekly export sales. The reports were negative to prices as USDA left US demand alone and raised world ending stocks. Demand ideas are improving. Demand was very strong in the report the previous week and has been ramping up for the last couple of months, but fell off. Some ideas that demand could soon increase more as China could start to open its economy in the next couple of weeks. China has also started buying again from Australia after refusing imports from that country for political reasons.
Overnight News: The Delta will get scattered showers and above normal temperatures. The Southeast will see isolated to scattered showers and above normal temperatures. Texas will have mostly dry conditions and near to above normal temperatures. The USDA average price is now 75.79 ct/lb. ICE said that certified stocks are now 1,697 bales, from 8,900 bales yesterday. ICE NY said that 0 notices were posted for delivery against March contracts and that total deliveries for the month are now 0 contracts.
Chart Trends: Trends in Cotton are down with objectives of 77.70, 77.60, and 71.70 May. Support is at 77.90, 75.40, and 74.80 May, with resistance of 78.80, 80.20 and 86.90 May.
• FCOJ
General Comments: FCOJ was higher last week and remains supported by very short Orange production estimates for Florida. The market tone is mixed as USDA slightly raised Florida Oranges production estimates to 16.1 million boxes from 16.0 million in its previous estimate and more than 60% below the production from last year. The crop is still very short but the size of the crop could be factored into the price now. Historically low estimates of production due in part to the hurricanes and in part to the greening disease that have hurt production, but conditions are significantly better now with scattered showers and moderate temperatures. The weather remains generally good for production around the world for the next crop including production areas in Florida that have been impacted in a big way by the two storms seen previously in the state. Brazil has some rain and conditions are rated good. Brazil continues to export to the EU and is increasing its exports to the US. Mexico is also exporting to the US. The Florida Dept of Citrus reported that inventories are still 38.5% below last year. Nielsen said that Orange Juice retail prices hit a new high in the US. This is the fifth consecutive month of new highs reported and the highest price reported since at least 2001. The current price is now 8.85/gallon, up 14% from last year.
Overnight News: Florida should get scattered showers. Temperatures will average above normal. Brazil should get scattered showers and near normal temperatures. ICE NY said that 0 notices were posted for delivery against March futures and that total deliveries for the month are now 0 contracts.
Chart Trends: Trends in FCOJ are mixed. Support is at 240.00, 219.00, and 217.00 May, with resistance at 240.00, 244.00, and 246.00 May.
• COFFEE
General Comments: New York closed a little higher and London closed a little lower last week. Differentials are now weakening in Brazil, Honduras, and Colombia as the rally has increased offers. However, CECAFE showed that Brazil exports were just 2.4 million bags in February, down one third from a year ago. Ideas of big production for Brazil continue due primarily to rains falling in Coffee production areas now. Vietnam is estimated to have very good production this year due to a good growing season. There are ideas that production potential for both countries has been overrated. The weather in Brazil is currently very good for production potential but worse conditions seen earlier in the growing cycle hurt the overall production prospects as did bad weather last year. Vietnam is getting less rain now to aid harvest progress but volumes offered have not increased.
Overnight News: ICE certified stocks are higher today at 0.771 million bags. The ICO daily average price is now 171.96 ct/lb. Brazil will get scattered showers with near to above normal temperatures. Central America will get scattered showers. Vietnam will see scattered showers. ICE NY said that 0 contracts were tendered for delivery against March futures and that total deliveries for the month are now 624 contracts.
Chart Trends: Trends in New York are mixed. Support is at 174.00, 171.00, and 170.00 May, and resistance is at 178.00, 183.00 and 185.00 May. Trends in London are mixed to up with objectives of 3300 and 3360 May. Support is at 2160, 2130, and 2110 May, and resistance is at 2210, 2240, and 2270 May.
• SUGAR
General Comments: New York and London closed a little higher as Indian production remains a concern. Indian production is thought to be 33 million tons this year or less and the market has had to ration that supply via price. Thailand mills are closing earlier than expected so the crop there might be over rated and Brazil production is solid this year. Reports from private analysts suggest that Brazil can have a 13% increase in center-south production. Center-south mills crushed 72,000 metric tons of cane in the period, down 55% from the same time last year, Unica said Friday. The mills produced 381 tons of sugar and 154.7 million liters of ethanol. The production mix for the second half of February was 4.8% sugar to 95.2% ethanol, compared with 100% ethanol in the same period last year. In the period from April 1 through Feb. 28, mills in the region crushed 542.5 million tons of cane, up 3.8% from the same period a year earlier. Sugar production rose 4.5% to 33.5 million tons, and ethanol output climbed 3.7% to 28.2 billion liters. The production mix for the season through Feb. 28 was 45.9% sugar to 54.1% ethanol, compared with 45% sugar and 55% ethanol in the same period a year earlier. Good production prospects are seen for crops in central and northern areas of Brazil, but the south has seen drier weather. There is concern that the rainy areas will stay too wet and delay the harvest and dilute the Sugar concentrations in the cane in central areas. European production is expected to be reduced again this year, with French planted area likely to decline to a 14 year low for Sugarbeets. Some analysts now say that Chinese production could be the lowest in six years due to bad growing conditions.
Overnight News: Brazil will get scattered showers. Temperatures should average near to above normal. India will get mostly dry conditions and near to above normal temperatures.
Chart Trends: Trends in New York are mixed to up with objectives of 2160 and 2270 May. Support is at 2060, 2040, and 2010 May and resistance is at 2130, 2160, and 2190 May. Trends in London are mixed to up with objectives of 601.00 May. Support is at 582.00, 574.00, and 566.00 May and resistance is at 595.00, 603.00, and 609.00 May.
• COCOA
General Comments: New York and London closed lower last week even as West African exporters are not offering. Wire reports said that a lot of Ivory Coast Cocoa is getting smuggled to other countries for export due to higher prices being paid. Trends are down in both New York and London. Talk is that hot and dry conditions reported in Ivory Coast could curtail mid crop production, but main crop production ideas are strong. Those ideas changed a little over the previous weekend due to heavy rains reported in Cocoa areas of the country. Ghana has reported a disease in its Cocoa to hurt production potential there. The rest of West Africa appears to be in good condition. Good production is reported for the main crop and traders are worried about the world economy moving forward and how that could affect demand. The weather is good in Southeast Asia. The Ivory Coast Cocoa grind was 58,452 tons in February, 16% higher than last year.
Overnight News: Isolated showers are forecast for West Africa. Temperatures will be near normal. Malaysia and Indonesia should see scattered showers. Temperatures should average near normal. Brazil will get isolated showers and near to above normal temperatures. ICE certified stocks are lower today at 5.050 million bags. ICE NY said that there were 0 notices posted for delivery against March contracts and that total deliveries for the month are now 615 contracts.
Chart Trends: Trends in New York are down with objectives of 2620 and 2500 May. Support is at 2660, 2630, and 2620 May, with resistance at 2740, 2790, and 2810 May. Trends in London are down with objectives of 2010 and 1940 May. Support is at 2030, 2000, and 1980 May, with resistance at 2080, 2110, and 2130 May.
Read Full Story »»»
 DiscoverGold
Deliveries on Grains/Canola/Can$/Lumber/Cocoa
By: The PRICE Futures Group | March 13, 2023
• Tomorrow Tues Mar 14th is Last Trading Day for March CBOT Grains, MGEX Wheat, ICE Canola and Canadian Dollars.
• Wed Mar 15th is Last Trading Day for March Lumber.
• Thurs Mar 16th is Last Trading Day for ICE Cocoa and London Cocoa.
Read Full Story »»»
DiscoverGold
What I'm Watching This Week In The Grain Markets
By: Barchart | March 12, 2023
Silicon Valley Bank was founded in 1983, was rated a top 20 commercial bank and until late last week, I can guarantee was a group most folks not involved in a startup or venture capital had ever heard of. SVB as it is known became the first bank failure since 2020 and the 2nd largest failure in the US on record late last week, completing a tumultuous 48 hours, where it went from billions in value to being placed under the control of the FDIC.
To many in agriculture what happens to a bank in California feels like it means very little, and depending on what officials do in this particular situation over the next couple of days, that could be true. But I worry this could be the catalyst responsible for many changes in agriculture and the markets in the weeks, months and years ahead.
First things first, a run through of what took place at a 1000 foot level. As mentioned, SVB was a large commercial bank, most known for working with venture capitalists and start-ups. The group boasted on its website that it worked with half of the venture capital projects in the US, with 44% of tech and health startups doing their banking business there.
This large exposure to the tech and startup space started to create some cracks in the façade of the bank throughout 2022, as the flow of venture capital funds into startups started to dry up. Increases in interest rates and changes in monetary policy had prompted many to start thinking about their investments in a different way, pushing many of the start ups banking with SVB to start tapping into their funds at the bank as opposed to simply depositing money.
In addition to an uptick in cash outflow, the bank had much of its holdings sitting in long-term bonds. This is something many banks do, but SVB not only had a larger than normal amount of funds locked into these types of trades, it did nothing to hedge interest rate risks through swaps that would help offset a pinch if rates were to increase. $21 billion dollars of SVBs assets were tied up in a bond portfolio yielding 1.9%, the jump in interest rates sent the value of these bonds sharply underwater and without the offsetting hedge the cut was deep.
As a result the bank made moves, announcing it had sold some of its holdings to increase liquidity and was planning on making additional sales. Word of the need for liquidity started to spread, prompting some major account holders and investors to pull funds and triggering a selloff in the bank's stock. The bank went from a viable organization with plenty of liquidity according to its CEO on Thursday morning to under FDIC control by Friday afternoon.
According to analysts the make up of SVBs holdings and glaring lack of risk management was largely responsible for the cash pinch the bank found itself in. The subsequent run on deposits triggered by some leaders in industry telling others to pull funds proved catastrophic.
The fall of SVB caught most of the headlines, but the fact it coincided with the folding of another small bank midweek sent fears reverberating through the markets that this may be just the tip of the iceberg.
While what is happening in banking may feel far removed from the farmgate, it truly isn’t, as many folks are going to find what worked for them when it comes to managing risk may begin to change quickly, as the risks we are now managing are very different from the ones we’ve grown accustomed to managing these last few years.
The value of money is changing, and in that I don’t mean the dollar index or what it is able to buy, but instead what having cash means. At 41 years old I can tell you my generation barely knows what it’s like to borrow with significant interest, or to have cash that actually grows by just sitting in an account.
In addition, the days of investors seeking ways to eek out a percent or two of gain on their investments are behind us, with many now expecting these investments to compete with other avenues offering 5% or more with limited risk. The dry up in easy cash has already been seen in the tech industry, with significant job cuts and sharp changes in budgets happening for much of the last 6 months or more.
This will begin to be seen in other industries as well, as sharp increases in borrowing costs will likely begin to slow expenditures and force many to look at the cost of doing business with greater gusto.
The same can be said about investments, which gives me pause when I think about the managed money participation we’ve grown accustomed to in the ag markets these last few years. Speculators have loved buying grain, oilseeds and other commodity contracts on the inflation narrative, helped out greatly of course by the perfect storm of other bullish factors in the market.
The participation of managed money enhances the direction of any move as seen when funds moved incredibly short in the corn market in 2020 and again when they moved to the opposite position just 2 years later.
Of course, the supply and demand situation in grains has not been solved, with several factors that could swing bullish still at play. This doesn’t stop me from worrying we could see these funds in a position where they work to generate cash by liquidating their holdings of grain positions. While the recent price action in corn could be an indication this has already taken place, historically speaking funds do not just move from long to a neutral position.
If the production outlook remains free of any further major losses, a major catalyst for recent grain market strength and reasoning for holding positions not actively generating return could be removed for the foreseeable future.
In addition, unfortunately this will likely slow development and growth of the startups in agriculture we have grown so accustomed to. It costs millions if not billions to try and compete with the big dogs in this industry, a loss in outside cash will likely result in a tunnel vision of sorts when it comes to innovation.
Of course, much of this is simply just a hypothesis. It is possible SVB was an anomaly. The FDIC is working to find an acquisition partner for the group to help guarantee funds for depositors and other banks are reportedly in much better condition. This could be nothing more than a speedbump.
However, with US regulators saying banks in February had unrealized losses on securities of over $620 billion due to the sharp increase in rates and assets locked into low yielding positions, SVB is probably not the only group feeling the pinch.
If nothing else, the SVB debacle has brought counter party risk to light in a way we’re not accustomed to. If nothing else, as Nick Horob tweeted this week, it is likely to start a conversation about asset-liability mismatches and what that means across the board.
There are other things I will be watching this week as well. Representatives from Russia and Ukraine will meet to discuss the continuation of the grain corridor. Ukraine is still pushing for a full year extension with the addition of Mykolaiv, while Russia is still saying their exports are being limited by sanctions that need to be removed. The most likely solution is the corridor gets extended as is, but there is risk of volatility this week if Russia decides to double down on their recent threats.
With 2 weeks until the March quarterly stocks and acreage report, we will start to hear more about what traders are anticipating out of those numbers. At this point corn seems to be the clear winner in the acreage battle, though the recent shift in prices could have something to say about that, weather in the Northern Hemisphere will start to come into focus.
Read Full Story »»»
DiscoverGold
The Corn & Ethanol Report
By: Daniel Flynn | March 13, 2023
We kickoff the week with Consumer Inflation Expectations at 9:00 A.M., Closed Door FED Emergency Meeting and 4-Week & *-Week Bill Auction at 9:30 A.M., and Export Inspections at 10:00 A.M.
On the Corn Front a lot of if’s have been put into the market. We gained some ground in Friday’s session after making new lows in the weeks selloff. Uncertainty also remains whether the Black Sea Grain Initiative will be extended as the UN and Russia officials meet this week in Geneva. The FED has an emergency meeting and we expect more answers on The Silicon Valley Bank and how many other bank failures that the US taxpayer is allegedly off the hook. There were rumors on Friday that Chinese interest in US corn helped the rally. And traders eyes are on the March 31st Prospective Plantings. After reaction to the USDA crop production report, along with concerning signs from the Fed about rate hikes, but now with the Silicon Valley Bank problem it may keep the Fed’s hands tied. After closing 7 cents higher on Friday the May corn is currently trading at 601 ½ which is 5 cents lower. The trading range has been 609 to 601 ½.
On the Ethanol Front the US Grains Council (USGC) 20th International Marketing Conference and 63rd Annual Membership Meeting in Savannah, Ga, the Council’s Advisory Team (A-Team) solidified key priorities for 2023. US ethanol exports for marketing year (MY) 2021/2022 total 1.45 billion gallons (Bgal), the third largest market year on record, worth $4 billion. As the 2022/23 MY takes off, the council continues to work worldwide to promote US ethanol’s quality, reliability and value worldwide, with a renewed focus on Canada, Japan, The European Union and United Kingdom, India and the Southeast Asia (SEA) region. There were no trades or open interest in ethanol futures.
Read Full Story »»»
DiscoverGold
The Great Spending Reckoning. The Energy Report
By: Phil Flynn | March 13, 2023
Joe Biden is going to give a speech and he is expected to say that he is going to hold those responsible for the failure of Silicon Valley Bank (SVB), the second largest bank failure in terms of assets, accountable. Well he should not have far to go because a lot of the blame falls on his administration and the out of control spending in Washington.
Just last week when the Federal Reserve Chairman was pressed on his aggressive patch of interest rate increases, he suggested that the blunt instrument was all he had to work with. He had no comments on US fiscal policy were record breaking debt and policies by this administration that are the most inflationary in US history. The most inflationary policy has been the war on U.S. oil and gas and the poorly thought and planned energy transition. Biden’s decisions based on politics and not energy security, with any real thought to the fallout for the health of the planet, has hurt the U.S.. This administration feels compelled to pay for a war in Ukraine that, because of their failed diplomacy, was allowed to start. They want to solve every problem by spending mountains of money like paying off college loans as opposed to getting the U.S. fiscal house in order.
Biden’s policy which includes a poorly planned energy transition, economic decisions based on environmental, social governance, as opposed to economic soundness, is one of the major causes for runaway inflation and the blow of confidence in the US economic path.
You can in part blame Silicon Valley Bank’s failure on putting too much faith into the US treasury market. The Wall Street Journal pointed out that, “SVB was flooded with cash during the pandemic tech boom—startups and their investors were taking in huge sums, which swelled SVB’s coffers. SVB in turn used a lot of that money to buy Treasury bonds and mortgage-backed bonds. But as interest rates rose, those securities declined in value.” The Journal points out that, “That wasn’t a problem at first—SVB said it would never sell the lion’s share of those bonds—a designation that meant it could ignore any losses from the declining value. But in early March, it had to face up to the losses—the flood of withdrawal requests was more than it could satisfy by selling the bonds.”
The tech startups that SVB lent money to were told to do business with SVB. When depositors need cash, the bank, with major losses on treasuries, when they tried to raise capital to make up for the losses on bond sales that were caused by the Feds historically quick interest rate hikes, like dominoes, began to fall. There are also questions about regional California bank regulators and New York regulators. Did they turn a blind eye to the bank’s problems because they were big players in their states?
Contagions fears rose after New York bank regulators on Sunday evening announced it closed Signature Bank, shocking the bank management. They said it was to avoid a banking crisis spurred by the failure of Silicon Valley Bank. It was reported that New York’s Department of Financial Services took possession of Signature, a major multifamily lender in New York, to protect depositors. The Federal Deposit Insurance Corporation was appointed receiver of the bank.
So, the Fed had to step in saying they would make all depositors whole but has created earth shaking moves in the global treasury markets and making the Fed’s rate path and the credibility of their policies uncertain. A joint release by the Treasury Department, the Federal Reserve board of governors and the FDIC shortly after 6 p.m. said the FDIC would protect all depositors at California-based Silicon Valley Bank. “We are also announcing a similar systemic risk exception for Signature Bank … which was closed today by its state chartering authority.”
Oil prices are fluctuating dramatically as the market starts to realize that the Fed will have to alter its blunt instrument course or risk more bank issues. Yet at the same time oil is trying to assess if this economic shock will slow investment in the US and cause a crisis of confidence that could kill oil demand. Gold futures are soaring as the US dollar loses ground as the two year were down 35 basis points which is the biggest two day slide since the 1987 stock market crash.
The reason is the markets, because of the bank failure, must do a faster reassessment of the Feds rate path because it’s clear that based on the Fed Chairs congressional testimony last week that he did not see this bank issue coming. The Fed must adjust their rate hikes and to not do so until they understand the damage it could be doing would be a big mistake.
Overall, when the smoke clears, this should be very bullish for oil. With the Fed reopening lending facilities and the market pricing in a less aggressive Fed, oil should be a big winner. The Fed need to pause and allow the markets to work before they continue to break things. In Washington they should learn from this, but somehow, they never do.
Read Full Story »»»
DiscoverGold
Wheat prices hit a 20-month low this week, down 49% from their peak last year
By: Charlie Bilello | March 11, 2023
• Wheat prices hit a 20-month low this week, down 49% from their peak last year. Great to see, hopefully will continue.

Read Full Story »»»
DiscoverGold
2023 has been the year of loving OJ and hating natty
By: Charlie Bilello | March 10, 2023
• 2023 has been the year of loving OJ and hating natty

Read Full Story »»»
DiscoverGold
Commodity price changes over the last year...
By: Charlie Bilello | March 10, 2023
• Commodity price changes over the last year...
Sugar: +11%
US CPI: +6.4%
Gold: -8%
Soybeans: -10%
Copper: -13%
Gasoline: -17%
Corn: -19%
Heating Oil: -19%
Coffee: -22%
Silver: -23%
Brent Crude: -25%
Zinc: -26%
WTI Crude: -29%
Cotton: -30%
Wheat: -36%
Natural Gas: -45%
Read Full Story »»»
DiscoverGold
Today's Futures Heat Map • Weakest: Cotton, Natural Gas, Russell 2000 E-Mini, Lumber
By: Barchart | March 10, 2023
• Today's Futures Heat Map
Strongest: Heating Oil, T-Bonds, Lean Hogs, Hard Red Wheat
Weakest: Cotton, Natural Gas, Russell 2000 E-Mini, Lumber

Read Full Story »»»
DiscoverGold
Sold Out. The Energy Report
By: Phil Flynn | March 10, 2023
Oil prices are fluctuating wildly on renewed fears of Fed interest rate increases. Yet when it comes to oil in Saudi Arabia, they are all sold out. Despite raising their official selling price of oil to Asia, for the second month in a row it appears that according to Reuters they will supply full volumes of oil to four refineries in Asia. This is another clear sign that China’s oil demand will have a big impact on global oil supplies. Yet in the meanwhile, oil prices are being thwarted by a Federal Reserve that is messaging that recent jobs data is too strong for their liking.
Fears are rising that if today’s monthly non-farm payrolls are too strong, the Fed will act and that means in traders’ minds it will all but guarantee a 75-basis point rate increase at the March Fed meeting.
There is also talk about the possibility that the Federal Open Markets Committee (FOMC) federal funds rate could exceed 6% in the future. Yet can the Fed be so aggressive when it’s possible that their blunt instrument to deal with government spending-led inflation could already be causing risk in the banking sector?
The US stock market tried to ignore concerns of the crashing shares of SVB Financial Group or Silicon Valley Bank, which has heavily funded start-ups in the tech space until late in the session as the shares of that bank dropped by over 60%. Silicon Valley Bank (SVB) caused panic after it announced plans to shore up its finances. Bloomberg wrote that, “By Thursday morning, the bank’s chief executive officer, Greg Becker, was urging clients to “stay calm.” Many investors and banking clients failed to take his message to heart. The company’s stock plunged 60% during the day Thursday, shedding almost $10 billion, and then fell as much as 30% in after-hours trading.
That had impacts on other banks as the four largest US banks lost more than $50bn in market value. That caused bank shares in Asia and Europe to fall sharply on Friday. This raises the complexities of today’s jobs report. On the one hand, Fed Chair Jerome Powell said he will do whatever it takes to fight inflation but does that include causing a banking global banking crisis?
If you think that is crazy, it is no crazier that the green energy movement madness that makes you wonder what the heck these politicians are thinking. Green question of the day. How does the climate get better if you close nuclear power plants and replace them with coal?
Dan Molinski at Dow Jones wrote, “Coal remained the top energy source in Germany for electricity generation last year, and in fact, its piece of the pie is growing. The Federal Statistical Office of Germany says in a statement that coal-generated 33% of all electricity in 2022, up from 30% in 2021. “This means that coal-generated electricity increased by 8.4% compared with the previous year,” the government agency says. “Wind power was the second most important energy source. After the previous year had been relatively windless, its share increased by 9.4% to just under one quarter (24.1%) of electricity production (2021: 21.6%).” Natural gas generated 11% of electricity in Germany last year, and nuclear generated 6%.
The details of the final Strategic Petroleum Reserve release were announced. The US SPR Offered: 26mb, sold 26mb, to be delivered from April to June Buyers in million barrels Marathon Petroleum 8.4 Equinor 7.3 Shell 3.6 Aramco Trading 3.5. Macquarie 1.6 Phillips 66 1.6. Now there should be no more new oil coming out unless Biden starts to panic about gas prices again.
Biden’s crazy tax proposals in his budget, if passed, will cause a recession and severely reduce US energy production and give Russia and OPEC energy dominance over the next decade. Not only this madness of taxing unrealized gains in the stock market that will shake global money out of our markets, but taxes on oil and gas that will make it impossible for the US energy sector to thrive. Fox Business reported, “The administration views eliminating fossil fuel tax benefits as part of the administration’s stated effort to reduce the budget deficit. Office of Management and Budget Director Shalanda Young said on a press call, “This year’s budget cuts the deficit by nearly $3 trillion over the next decade by asking the wealthy and big corporations to begin to pay their fair share and by cutting wasteful spending on Big Pharma, Big Oil and other special interests.”
Fox Business says that Biden’s budget blueprint calls for the elimination or modification of more than a dozen fossil fuel tax policies, which the administration says would reduce the budget deficit by about $3 billion per year and nearly $30.8 billion over the next decade. Some of the more significant proposed changes include ending the use of percentage depletion related to oil and gas wells, which would reduce the deficit by more than $13.8 billion over the decade, and repealing the expensing of intangible drilling costs, which would reduce the deficit by nearly $8.5 billion over the same time frame.
I can tell you that those tax changes will have a devasting impact on US oil and gas production. Small producers will be forced out of business and investment in US oil and gas will flee. This will cause a major price spike in oil and gas prices. This will kill the middle class. It will also take away a key advantage for the US manufacturing sector that has benefited from cheap oil and gas. That will lead to job losses.
You can’t continue to make policies that hurt Americans. You can’t keep spreading the false notion that the oil companies are making record profits without acknowledging they had record losses. You can’t base policies because you covet someone else’s goods. Or worse, to push an agenda that makes the green energy elite rich on the backs of the poor.
Biden’s foreign policy is backfiring and hurting Americans in a big way. His inept handling of Saudi Arabia when he vowed to make our long-time ally a ‘pariah state’, has backfired. Not only has it driven Saudi Arabia closer to Russia and China, it now appears that Saudi Arabia is even restoring ties with its arch-enemy Iran. Bloomberg is reporting that Saudi Arabia confirmed the deal to restore its ties with Iran and within two months they’re going to reopen their embassies in both countries. Can anybody explain to me how the world’s a safer place under Joe Biden’s foreign policy? Well, at least he can bring Saudi Arabia and Russia closer together and can bring Saudi Arabia and Iran closer together. And he can make China and Saudi Arabia chummy. How is this in our country’s Interest? We have been sold out.
Read Full Story »»»
DiscoverGold
Checking in on futures... equities and many commodities down with the exception of OJ, which is running.
By: Markets & Mayhem | March 10, 2023
• Checking in on futures... equities and many commodities down with the exception of OJ, which is running.

Read Full Story »»»
DiscoverGold
Cocoa: Prices Resume Ascent After Short Pause Due to Uncertainties
By: Investing.com | March 10, 2023
The global industrial chocolate market may reach US$ 57 billion by 2023, recording a 4.4% CAGR. By 2033, the market is expected to reach US$ 87.68 billion.
Meanwhile, May New York cocoa CCc2 fell 0.04% to $2,755 a ton. On March 1, the May futures price hit $2,856, the highest since December 2020, as cocoa became the final soft commodity to post a multi-year peak. May London Cocoa Futures rose 0.4% to 2,141 pounds a tonne, propped up by the weakness of sterling.
Remarkably, about 70% of the world’s annual cocoa supplies come from West Africa. While the Ivory Coast and Ghana are the leaders, Nigeria and Cameroon are top-five producers. Supply tightness in the Ivory Coast caused the most recent rally in the cocoa futures arena.
Dealers said the market was undergoing a modest pullback after rising last week to a 3Yr high of $2,856 but fundamentals remained supportive with a second successive global deficit seen this season. Cocoa prices have seen support from concern about the quality of some West African cocoa crops.
Cocoa farmers continue to struggle with the lack of fertilizer and pesticides as the war in Ukraine has limited Russian exports of potash and other fertilizers worldwide. But eventually, uncharacteristically heavy rainfall in most of Ivory Coast's cocoa growing regions last week created preconditions to improve the size and quality of the April-to-September mid-crop, the smaller of two annual cocoa harvests.
March appeared a still-challenging month for cocoa futures after a memorable rally in February instigated by reports that some Ivory Coast cocoa exporters are close to defaulting on their contracts due to a lack of cocoa beans, with some shortage estimates as high as 150,000 tons.
Important supportive factor for cocoa prices is reduced cocoa supplies from the Ivory Coast. Monday's government data showed that Ivory Coast farmers sent a total 1.72 million metric tons (MMT) MT of cocoa to Ivory Coast ports for the 2022/23 marketing year from October 1 through March 5, down -1.7% YoY.Summary
According to ICCO, the 2022/23 season is anticipated to result in a limited supply deficit while demand is envisaged to be subdued. The expectation of a supply deficit has also been compounded with weather variations, especially in West Africa. Cocoa butter is expected to dominate the total industrial chocolate market in 2023 with a CAGR of 3.5%. The U.S., a leading industrial chocolate market, is expected to reach US$ 15.2 billion.
Read Full Story »»»
DiscoverGold
Sugar Struggles to Find Sweet Spot Between Crude Oil and Food
By: Investing.com | March 10, 2023
• Higher output threatening to unravel one of the best commodity rallies of 2022/23
• Raw sugar is down almost 5% for March; slide could reverse just like in Feb.
• Traders point to weaker output, rising focus on ethanol in No. 2 producer India
• Benchmark raw sugar has to only hold above 20.70/lb for bull wave to resume
After a sweet five-month ride, those bullish on raw sugar are again facing red signals from higher production threatening to unravel one of the best commodity rallies of 2022/23.
Good or active cane harvests in Brazil to Thailand are driving some investors to dump their long positions in sugar, triggering profit-taking just like in February. Last month’s red blip in sugar prices did not last due to concerns about weaker output in No. 2 producer India, which offset supply overruns elsewhere. This slide could soon reverse as well.
With a third of March trading done, benchmark raw sugar on New York’s ICE, or InterContinental Exchange, is down almost 5% for the current month, as it hovers at just under 21.15 cents a lb at the time of writing, compared with February’s close of 22.08.
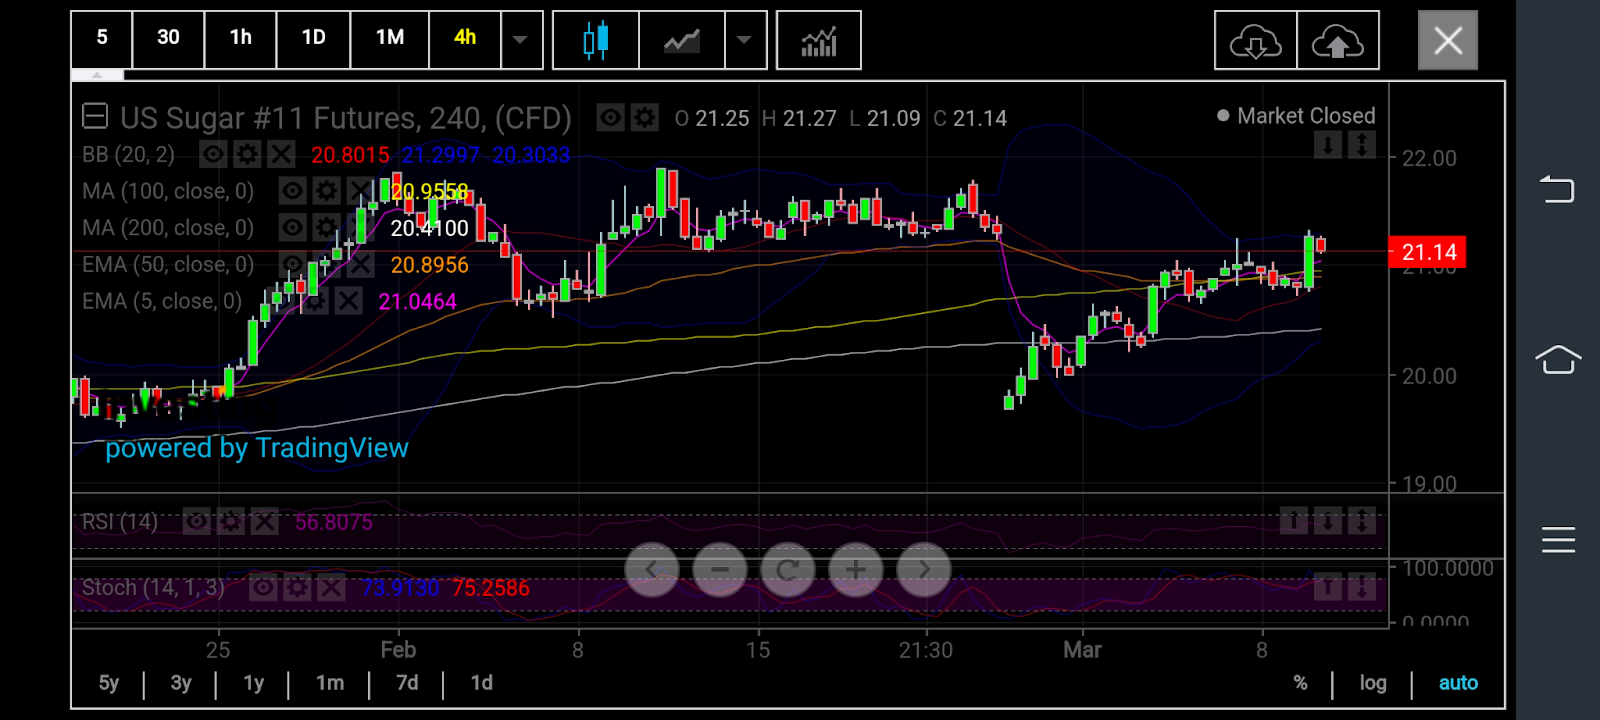
Raw Sugar 4-Hour Chart
Chart by SKCharting.com, with data powered by Investing.com.
And despite the month-on-month drop, the price remains significantly higher than the 17.68 cent closing for September, which marked the directional shift in raw sugar resulting in the rally of the past five months.
Global production of sugar remains a mixed picture, and that could lessen the impact of the current price slide. Panelists at the International Sweetener Colloquium in La Quinta, California, on Feb. 27 gave varying accounts of the world sugar outlook in a report carried by the trade journal Food Business News.
The crop in India, the world’s second highest sugar-producing country behind Brazil, is expected to fall short of earlier 2022-23 production forecasts. Several other major producers, except for Thailand, also were projected to have lower year-over-year production levels, the panelists said.
Thus, regardless of a perceived global surplus in supply, sugar prices are expected to remain elevated, although not necessarily at current six- or seven-year highs, the panelists said.
One of them, Vincent O’Rourke, trader and market analyst at C. Czarnikow Sugar Inc., said any perceived glut in sugar seemed manageable versus global consumption at almost five million tonnes, notwithstanding weather risks.
The other offset to any oversupply is ethanol.
Weakness in crude prices limited gains in sugar after this week’s 6% slump — at the time of writing — in U.S. West Texas Intermediate undercut ethanol prices, triggering worries that the world’s sugar mills may divert more cane crushing toward sugar production than ethanol. The United States has a 10% mandate for ethanol blending in its automotive fuels, while Brazil’s requirement is more than double that, at 22%. India has a 20% target set for 2025/26.
India produced a record amount of sugar in 2021-22, but through its country’s incentivization program, mills began diverting more of its cane crop to ethanol production, said Sergey Chetvertakov, senior associate at S&P Global Commodity Insights. And after an extended monsoon season, its 2022-23 crop is expected to produce disappointing yields. O’Rourke of Czarnikow Sugar adds:
“The big dog at the table has been India. The rumors are the crop will be disappointing, and its conversion commitment to ethanol is interfering, so it’s possible India won’t meet its export forecast.
The world has become accustomed to India’s sugar exports, but that won’t be the case in five years with increasing ethanol production likely to continue.”
Traders, meanwhile, looked to the potential 2023-24 large crop in Brazil to fill in the anticipated gap left by India. Though the country uses about 55% of its sugar cane to produce ethanol, prices are not competitive for ethanol production, and ideas were the crop would prioritize sugar production unless another situation similar to the invasion of Ukraine occurred, which would swing the spotlight to generating fuel supplies.
Despite being more competitive than ethanol, sugar production in Brazil offered weaker price margins when compared to other crops, which provided a bullish element.
“Unless we see prices come up, then no one will look at cane as a smart Investment,” O’Rourke said. “We really need higher prices, especially for Brazilian mills, so they can increase their cane acres and sugar production.”
Thailand, another leading global sugar producer, and exporter, was forecast to increase sugar production from a year earlier. But after the previous year’s devastating crop, the current production outlook was viewed more as a bounce back than an upward trend.
Adding to the strain of current global supplies was the nearly one-million-tonne shortage in sugar production from the European Union, the world’s largest supplier of beet sugar.
A mild winter followed by extremely hot and dry summer conditions created a stressful environment for its crop. But the situation was further exacerbated by a scourge of beet yellow virus, likely linked to the EU’s recent ban on neonicotinoid insecticides, which have been blamed for killing bees. More tolerant and pest-resistant plant breeds were being developed but were not yet available, so analysts expected challenging seasons were still ahead for European beet sugar producers.
So, what are sugar’s technical charts saying?
They look positive, too, according to Sunil Kumar Dixit, Chief Technical Strategist at SKCharting.com. Notwithstanding the March slide, Thursday’s run-up in New York’s front-month sugar futures contract toward 20.70 cents puts the market on track to the important positive target of 21.25 on the four-hour chart, said Dixit. He adds:
“This puts us on track to a return of the intraday bullish channel, reinforcing chances of a higher trajectory in coming sessions towards the next target of 21.70.”
Dixit also noted that the 50-EMA, or Exponential Moving Average, on the four-hour chart continues to form a back wall of support for raw sugar.
“For the continuation of the bullish wave, all that’s required is a hold of above 20.70. That’s already being achieved as we speak.”
Read Full Story »»»
DiscoverGold
Today's Futures Heat Map • Strongest: Orange Juice, Palladium, Sugar, Gold
By: Barchart | March 9, 2023
• Today's Futures Heat Map
Strongest: Orange Juice, Palladium, Sugar, Gold
Weakest: Wheat, Hard Red Wheat, Gasoline, Heating Oil

Read Full Story »»»
DiscoverGold
Cotton Red Through Thursday Midday
By: Barchart | March 9, 2023
The nearby cotton market is trading with midday losses of 30 to 41 points. May is near the low for the day as this is written.
Weekly FAS data had cotton bookings at 114,525 RBs for the week that ended 3/2. That was a 3-wk low and was 68% lower than the same week last year. USDA reported 287k RBs were shipped during the week for a season total of 5.674m RBs.
Census data showed 980,645 bales of US cotton was exported in January. That was up 45% from December but was 31% lower yr/yr. The season’s export total reached 4.897m bales through Jan, compared to 4.721m last year and the 12m bale WASDE forecast.
USDA did increase expected world cotton ending stocks yesterday by 2.1 million bales from last month, with Chinese stocks boosted 2 million bales to 39.4 of the 91.1 million world total.
The Cotlook A Index was 50 points firmer to 99.40 for 3/7. USDA’s weekly Cotton Market Review showed 31,860 bales were sold at spot this week for an average price of 82.41 cents. The AWP for cotton is now 72.73 cents/lb from 70.78 cents.
Read Full Story »»»
DiscoverGold
Hogs Down At Midday
By: Barchart | March 9, 2023
Hog futures are trading with 20 cent losses to a $1.05 loss in the April contract. April had been the leader upwards so far through the week and is still 10 cents in the black for the week to date. USDA’s National Average Base Hog price was 22c lower to $78.27. The CME Lean Hog Index was $79.09, up by 18 cents for 3/6.
USDA’s weekly Export Sales report showed 22k MT of pork was sold for export during the week that ended 3/2. That was down 29% from last week and by 13% from the same week last year. Adding the week’s 30k MT shipment brought the full year total to 263,828 MT – a 0.4% lag from last year’s pace.
Nearby pork cutout futures are mixed so far across the front months with April and May in the black and June down by 60 cents. USDA’s National Pork Carcass Cutout value was 34 cents weaker to $87.32 in the AM report. USDA’s estimate for federally inspected hog slaughter was 1.427m head through Wednesday. That is 8,000 behind last week’s pace, but is 3k head more than the same week last year.
Read Full Story »»»
DiscoverGold
Front Month Cattle In Red At Midday
By: Barchart | March 9, 2023
Live cattle futures are trading 50 to 65 cents lower so far, with 50 to 90 cent losses in the feeders. USDA has found limited cash trade for the week. The weekly FCE auction saw no cash trade between $163-$164 and asks from $165. The 3/7 CME Feeder Cattle Index was $188.33, up by another 29 cents.
Beef export sales were 5,570 MT for the week that ended 3/2. South Korea had a 1,100 MT cancelation. Beef shipments were 13k MT for the week, bringing the season’s total to 137,667 MT.
Wholesale Boxed Beef prices were weaker in the AM report with Choice 11 cents lower and Select $1.99 weaker. USDA estimated the week’s FI cattle slaughter at 378,000 head through Wednesday. That is 2,000 more than last week’s pace and is up 7,000 from the same week last year.
Read Full Story »»»
DiscoverGold
Wheat Futures Hammered Again
By: Barchart | March 9, 2023
Nearby wheat futures are trading with double digit losses through Thursday’s midday. CBT SRW is down by 14 1/4 to 16 3/4 cents so far. KC HRW is down by 17 to 18 cents at midday. The spring wheat market is 5 to 12 cents in the red across the front months. Oats Futures Prices are fractionally to 1 1/2 cents higher so far.
Weekly wheat export bookings were 266,685 MT for the week that ended 3/2 (trade estimates 150-500,000 MT). That was down 7% from the week prior and was 13% lower than the same week last season. USDA had 377k MT shipped for a full year total of 14.288 MMT as of 3/2. The monthly Census data had already confirmed 14.227 MMT were shipped officially through January, so the Export Sales number is light. January monthly wheat exports were confirmed at 1.777 MMT. That was a 3% increase from January 2022, but the YTD 14.227 MMT (522.7 mbu) trails last year’s 14.697 MMT pace.
USDA made no changes to wheat’s domestic balance sheet. Globally, they raised production by 5.14 MMT with 1 for Australia (to 39 MMT), 1 to India (to 104), and 2.4 MMT to Kazakhstan (16.4). Wheat stocks fell by 2 MMT to 267.2 MMT as USDA back adjusted carry-in and global domestic use was higher.
Russia’s IFX reported 40 MMT of grain exports for the 22/23 MYTD. Their full year forecast remains 55 - 60 MMT for all grain.
Read Full Story »»»
DiscoverGold
Beans Fading Through Midday
By: Barchart | March 9, 2023
Soy prices are trading 3 1/4 to 8 1/4 cents lower so far. The new crop prices are the weaker with November contracts as the lead month down. Soymeal prices are trading off their lows on $0.50 to $2.40 losses so far. Front month soybean oil futures are working 70 points in the red for midday.
USDA reported a private export sale for 184k MT of old crop soybeans this morning. The weekly FAS report had 23,234 MT of soybean net cancelations for the week that ended 3/2. New crop bookings were reported as 172,300 MT for the week. That left new crop bookings at 1.48 MMT compared to last year’s 3.099 MMT forward sales as of 3/2.
For the products, USDA reported 319k MT of soymeal sold for 22/23 delivery and 110k for 23/24. Soybean oil bookings were 7,312 MT for the week, a 3-wk high. Accumulated soy oil shipments were just 32,046 MT as of 3/2 – a 92% lag from last year’s pace.
USDA’s monthly balance sheet had soy crush 10 mbu lighter to 2.2 bbu, but exports 25 mbu higher to 2.015 bbu. That shrank carryout 15 mbu to a smaller than expected 210 mbu.
The WAOB saw a 7.86 MMT lighter world soy crop, mainly due to a 7 MMT cut from Argentina. The trade average guess was to see a 36.7 MMT Argentina output; USDA reported 33 MMT. They only trimmed Argentina’s exports by 800k MT from last month. Argentina’s soymeal exports were also cut 1.3 MMT. Global soybean stocks dropped 2 MMT compared to Feb, now figured at 100 MMT and matching pre-report trade ideas.
Brazil’s CONAB reduced their soybean production outlook by 1.4 MMT to 151.42 MMT in their monthly update.
Rosario Grains Exchange reduced their forecast for Argentina’s soy output again, from 34.5 MMT down to 27 million metric tonnes.
Read Full Story »»»
DiscoverGold
Corn Market Down Double Digits
By: Barchart | March 9, 2023
Despite the bull friendly weekly export sales report, the corn market is down another 5 to 10 1/4 cents with double digit losses in the old crop contracts.
Weekly Export Sales data showed 1.412 MMT of corn was sold during the week that ended 3/2. That was a 5-wk high and above the range of estimates, purchasers led by Japan and South Korea. The report showed 1.052 MMT of corn was exported, bringing the old crop shipment to 16.081 MMT (633 mbu) through 3/2. Census data released yesterday confirmed 551 mbu were shipped through January.
USDA lowered the full year U.S. corn export forecast by 75 mbu to 1.850 bbu. That went straight to carryout. The trade was looking for 1.308 bbu on average; USDA showed 1.342 bbu.
Global WASDE data reduced corn production by 3.84 MMT, though Argentina was cut by 7 MMT to 40 MMT. USDA also reduced their export forecast for Argentina by 7 MMT. Global ending stocks were bumped higher by 1.2 MMT to 296.5 despite the smaller Argentine numbers.
CONAB raised their outlook for Brazilian corn production back up by 933k MT to 124.677 MMT, mostly to the 1st crop, as 2nd crop shrank from 96.3 to 95.6 MMT in their recent update.
Rosario Grains Exchange reduced their estimate for Argentina corn output from 42.5 MMT to 35 MMT.
Read Full Story »»»
DiscoverGold
Arabica Under Pressure On Strength In Central American Coffee Exports
By: Barchart | March 9, 2023
May arabica coffee (KCK23) this morning is down -3.05 (-1.72%), and May ICE robusta coffee (RMK23) is up +11 (+0.51%).
Coffee prices this morning are mixed, with arabica sliding to a 3-week low. Signs of robust coffee exports from Honduras, Central America's biggest exporter of arabica beans, are pressuring coffee prices. Last Thursday, the Honduran Coffee Institute reported that Honduran Feb coffee exports rose +32% y/y to 863,901 bags.
Smaller robusta coffee supplies are bullish for robusta prices after the General Department of Vietnam Customs reported today that Vietnam's Feb coffee exports were down -34.2% y/y at 122,833 MT and Jan-Feb coffee exports were down -14.7% y/y at 283,339 MT. Vietnam is the world's largest producer of robusta beans.
An easing of flooding concerns in Brazil is also bearish for coffee prices. The drier conditions should allow farmers in Minas Gerais, Brazil's largest arabica growing region, back into coffee fields to apply fertilizers and pesticides. Somar Meteorologia reported Monday that Brazil's Minas Gerais region received 27.8 mm of rain in the week ended March 5, or 47% of the historical average. Minas Gerais accounts for about 30% of Brazil's arabica crop.
A bearish factor for robusta coffee is a rebound in ICE inventories as robusta inventories Wednesday rose to a 2-3/4 month high at 7,426 lots.
Tighter arabica coffee inventories are bullish for prices after ICE arabica coffee inventories Tuesday fell to a 2-1/2 month low of 763,700 bags. Also, smaller coffee supplies from Colombia, the world's second-largest producer of arabica coffee beans, are bullish for prices after the Colombia Coffee Growers Federation on Monday reported Colombia Feb coffee exports fell -6% y/y to 928,000 bags.
Global coffee supplies have tightened. The Green Coffee Association on February 15 reported U.S. Jan green coffee inventories fell -1.8% m/m to 6.265 mln bags. Also, robusta coffee inventories have shrunk as ICE-monitored robusta coffee inventories on February 15 declined to 5,933 lots, the lowest since contract rules changed in 2016. However, robusta inventories have recently recovered and rose to a 2-1/2 month high today at 7,374 lots.
Smaller global coffee exports support coffee prices after the International Coffee Organization (ICO) reported on February 2 that Oct-Dec global coffee exports fell -2.8% y/y to 30.27 mln bags. Cecafe reported on February 9 that Brazil Jan green coffee exports fell -18.5% y/y to 2.52 mln bags. Coffee exports from Guatemala, the second-largest coffee producer in Central America, fell -8% y/y in January to 172,439 bags. Coffee exports from Colombia, Vietnam Jan coffee exports sank -27.7% y/y to 142,544 MT.
Robusta has support after coffee trader Volcafe forecasted the global 2023/24 robusta coffee market would see a record deficit of 5.6 mln bags. Volcafe predicts Indonesia, the world's third-largest robusta producer, will see its 2023/24 robusta coffee production fall to 9.1 mln bags, the smallest robusta crop in 10 years due to damage from excessive rainfall across its growing regions.
The USDA, in its bi-annual report released on December 23, cut its global 2022/23 coffee production estimate by -1.3% to 172.8 mln bags from a June estimate of 175.0 mln bags. In addition, the USDA cut its 2022/23 global coffee ending stocks estimate by -1.7% to 34.1 mln bags from a June estimate of 34.7 mln bags. Meanwhile, the USDA's Foreign Agriculture Service (FAS) on November 22 cut its Brazil 2022/23 coffee production forecast by -2.6% to 62.6 mln bags from a prior estimate of 64.3 mln bags. This year was supposed to be the higher-yielding year of Brazil's biennial coffee crop, but coffee output this year was slashed by drought.
Read Full Story »»»
DiscoverGold
The Corn & Ethanol Report
By: Daniel Flynn | March 9, 2023
We kickoff the day with Challenger Job Cuts at 6:00 A.M., Export Sales, Initial Jobless Claims, Jobless Claims 4-Week Average and Continuing Jobless Claims at 7:30 A.M., Fed Barr Speech at 9:00 A.M., EIA Natural Gas Storage at 9:30 A.M. (analysts forecast an 80 bcf decline), 4-Week & 8-Week Bill Auction at 10:30 A.M., and 30-Year Bond Auction at 12:00 P.M.
On Corn Front the USDA showed a build on corn ending stocks which is showing a lack of purchase orders to export. World ending stocks were higher by 1.118 mmt vs. February while Brazil came in unchanged vs. February and Argentina 7 mmt less than February, and could even margin out larger as thins look bleak Argentina faces their worst drought in 60 years, and raises another questionable wildcard is Ukraine exports. E will be also monitoring Brazil’s 2nd corn crop as we inch ever so closer to planting season in the U.S. I do anticipate some acreage surprises in the Prospective Plantings data due to Renewable Fuels demand with biodiesel and ethanol. The soybeans traded higher off the data but fizzled out after Fed Chair Jerome Powell cast doubts in trader’s minds. With these factors in mind the export market could and should pick up and the buyers will be dancing to our tune. In the overnight electronic session the May corn is currently trading at 629 which is 3 ½ cents higher. The trading range has been 629 ¾ to 624.
On the Ethanol Front the EIA reported US ethanol production edges up while blending demand eases. The information regarding domestic ethanol through March 3 showed production climbed 0.7% while ethanol blender inputs edged slightly, maintaining a recent up/down pattern. Total ethanol production gained 7,000 barrels per day (bpd) to 1.010bpd last week, 1.6% below the same week in 2022. Data show ethanol blending activity in the U.S. a measure of demand slipped 3,000 bpd through March 3 to 870,000 bpd 2.9% below the same week in 2022. Four-week average blender inputs were 868,000 bpd, 1,000 bpd below last year. The EIA data also showed overall domestic ethanol inventory rose 545,000 barrels (BBL) to 25.320 million bbl 0.4% below this time last year. There were no trades or open interest in ethanol futures.
Read Full Story »»»
DiscoverGold
Break in Case of Emergency. The Energy Report
By: Phil Flynn | March 9, 2023
U.S. Energy Secretary Jennifer Granholm seemed to have an incredible idea. She said that any further releases from the U.S. Strategic Petroleum Reserve would be due to oil supply disruptions. Granholm said, “There has to be a situation like that that would generate interest in doing it. It’s not just about increases in prices, it really is about an emergency disruption.” While I applaud the Energy Secretary for her comments, perhaps she should have a talk with her boss. The reality is the Biden administration has used the Strategic Petroleum Reserve for political purposes more than any other president. While the administration says that the releases from the reserve were justified because of the war in Ukraine, the reality is this administration was releasing oil long before the war began.
The Biden administration had to cool prices as it was clear that their policies of drilling moratoriums and ESG and pipeline cancelations caused a contraction in oil and gas investment and they were getting the blame for the increase in prices. Then releasing oil from the reserve only further discouraged investment and damaged the market.
The Fed for their part has helped keep oil in its recent trading range even as the market is suggesting that demand will exceed supply in the coming months despite the Feds warning that higher interest rates are coming. It seems that when oil gets above $80.00 a barrel, Fed Chair Jerome Powell sounds more hawkish and when it’s in the low $70’s he sounds more dovish. Powell did address the fact that the Fed can’t keep oil prices down forever but pointed out that the US is also an oil producer so if oil prices go up, as they are most likely to do, it will not be all bad for the US economy.
The Fed’s Beige Book said that while inflation pressures remained widespread, businesses reported a moderation in price increases that they expect to continue this year. So, if we see reduced inflation expectations, is it possible that the Fed Chair’s bark will be worse than its bite? The odds of a 50 basis point increase for the march have gone up over 75%.
The funny thing is that oil is selling off because demand is too strong. Yes, strong job data, even with wages not keeping pace, means that energy demand is strong. As Bloomberg pointed out, oil demand in the US exceeded the 20 million barrel a day level last year which was almost completely back from the US covid lockdowns. Annual average consumption reached 20.28 million barrels a day compared to 20.54 million barrels a day in 2019 before covid-19. The EIA said that in shoulder season last week we averaged 19.7 million barrels a day. And despite some seasonal demand weakness in yesterday’s Energy Information Administration (EIA) supply report, there are signs that demand is getting ready to take off, not only here in the US, but also in China.
Let’s touch on China’s demand. Despite some China demand skepticism, we are seeing more evidence that Chinese demand is going to come back strong. Not only are we seeing Saudi Arabia raise their selling price to China, but we are also seeing a drop in China’s oil product exports, a clear sign that domestic demand is rising. The EIA reported a 100,000-barrel drop in US oil production this week and while a weekly drop is not a big deal, the drop does not fit with the EIA narrative that US oil would increase by 590,000 barrels per day, to 12.49 million barrels per day (bpd) in 2023, and by another 160,000 barrels to 12.65 million bpd next year. US production fell to 12.20 million barrels a day and some wonder if this could be a trend because of falling rig counts and challenges in the shale patch that have been made worse by the Biden administration.
The Wall Street Journal raised concerns about shale oil in a piece that previously was considered by some to be a fringe piece. The Journal wrote that, “The boom in oil production that over the last decade made the U.S. the world’s largest producer is waning, suggesting the era of shale growth is nearing its peak. Frackers are hitting fewer big gushers in the Permian Basin, America’s busiest oil patch, the latest sign they have drained their catalog of good wells. Shale companies’ biggest and best wells are producing less oil, according to data reviewed by The Wall Street Journal. The Journal reported last year companies would exhaust their best U.S. inventory in a handful of years if they resumed the breakneck drilling pace of pre-pandemic times. Now, recent results out of the Permian spread across West Texas and New Mexico, are mimicking the onset of a production plateau that has taken place at other, more mature U.S. shale plays.
At a major industry conference here this week, executives cited the stagnation in shale, saying it signaled a return to more dependence on foreign energy sources and more challenging times ahead for major U.S. companies after most of them posted record earnings last year. “The world is going back to a world that we had in the ’70s and the ’80s,” said ConocoPhillips Chief Executive Ryan Lance, during a panel at the conference called CERAWeek by S&P Global. He warned that OPEC would soon supply more of the world’s oil according to the Wall Street Journal.
Now I always warn about peak oil stories because time and time again when prices go high enough, we always find a way. That is how the shale revolution started in the first place. I think the real problem is the Biden administration and the ESG movement and the demonization of oil companies by this administration that is stifling investment and innovation. Biden’s historic and unprecedented war against US oil and gas has hurt our long-term energy security. Americans will be feeling the impact of these short-sighted policies for decades to come.
Overall, the weekly data was supportive. The EIA said, “U.S. commercial crude oil inventories (excluding those in the Strategic Petroleum Reserve) decreased by 1.7 million barrels from the previous week. At 478.5 million barrels, U.S. crude oil inventories are about 7% above the five-year average for this time of year. Including the SPR draws, we are well below average. Total motor gasoline inventories decreased by 1.1 million barrels from last week and are about 3% below the five-year average for this time of year. Distillate fuel inventories increased by 0.1 million barrels last week and are about 7% below the five-year average for this time of year.
Winter blasts may not be enough to save natural gas but progress on Freeport LNG should provide a floor. Freeport LNG Development, L.P. (Freeport LNG) yesterday announced that it has received regulatory approvals from the Federal Energy Regulatory Commission (FERC) and the Pipeline and Hazardous Materials Safety Administration (PHMSA) to restart Train 1, the final train of Freeport LNG’s three train liquefaction facility to receive restart authorization. Freeport LNG’s Trains 2 & 3 returned to full commercial operation in recent weeks, reaching production levels in excess of 1.5 billion cubic feet per day. As the recommissioning of Freeport’s liquefaction facility continues and trains are restarted, changes in feed gas flows and production rates are to be anticipated, given the duration of the plant’s outage. As previously stated, a conservative ramp-up profile to establish full three-train production is anticipated to occur over the next few weeks.
Read Full Story »»»
DiscoverGold
Today's Futures Heat Map • Strongest: Copper, Lean Hogs, Pork Cutout, Mexican Peso
By: Barchart | March 8, 2023
• Today's Futures Heat Map
Weakest: Natural Gas, Orange Juice, Coffee, Heating Oil

Read Full Story »»»
DiscoverGold
Deliveries on Gasoil/Grains/JGBs, Currencies/OJ/Canola/Can$
By: The PRICE Futures Group | March 8, 2023
• Fri, Mar 10th is Last Trading Day for Mar Gasoil and Milling Wheat.
• Mon Mar 13th is Last Trading Day for March JGB, Currencies and OJ.
• Tues Mar 14th is Last Trading Day for March CBOT Grains, MGEX Wheat, ICE Canola and Canadian Dollars.
Read Full Story »»»
DiscoverGold
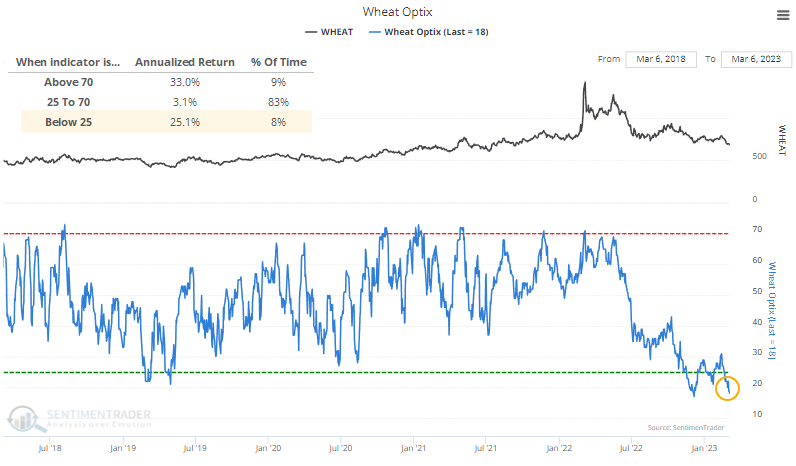
Wheat has wilted, and investors have given up
By: Jason Goepfert | March 8, 2023
• Wheat prices have declined more than 40% from their 2022 peak. The losses have been significant enough to trigger a large degree of pessimism from traders, to the point where it has moved to a historical extreme.
Read Full Story »»»
DiscoverGold
Powell Show Overshadowed Commodities. The Corn & Ethanol Report
By: Daniel Flynn | March 8, 2023
We kickoff the day with MBA 30-Year Mortgage Rate, MBA Mortgage Market Index, MBA Mortgage Refinance Index, MBA Purchase Index and MBA Mortgage Applications at 6:00 A.M., ADP Employment Change at 7:15 A.M., Balance of Trade, Exports and Important 7:30 A.M., Fed Chair Powell Testimony, JOLTS Job Openings and Job Quits at 9:00 A.M., EIA Energy Stocks at 9:30 A.M., 17-Week Bill Auction at 10:30 A.M., Crop Production USDA Supply/Demand and WASDE at 11:00 A.M., 10-Year Note Auction at 12:00 P.m., Beige Book at 1:00 P.M., and Dairy Products Sales at 2:00 P.M.
On the Corn Front we did not hold onto any gains like other commodities markets shocked by Jerome Powell’s Hawkish comments. Talk of higher interest rates really put some legs in the US dollar and weighed in on commodity valuations. This was bad news for consumers and traders alike. With Powell Senate Testimony, EIA Energy Stocks and WASDE in that order traders may wait and see if they have any comfort level and keep their hands in their pockets. We will see a different Prospective Plantings number on March 31stIn the overnight electronic session the May corn is currently trading at 634 ½ which is a ¼ of a cent higher. The trading range has been 637 ¼ to 633 ¼.
On the Ethanol Front Michelle Rook with AG WEB reports, Soybean Processing Welcome in Northwestern Corn Belt: Will Support Soybean Prices and Improve Basis. A domestic market for soybean and soybean oil continues to develop. As more crush plants come online, USDA is forecasting new records. At the AG Outlook Forum, USDA’s NASS projecting soybean crush to top 2.3 billion bushels as Renewable diesel production continues to expand. In North Dakota three plants are planned with a total 138 million of crush capacity. Those include a 42.5-million-bushel plant near Casselton, a 53-million-bushel facility at Spiritwood and a 42-mb plant north of Grand Forks. That will mean a fight for more soybean acres or a shift in the marketplace. There were no trades or open interest in ethanol futures.
Read Full Story »»»
DiscoverGold
Blunt Instrument. The Energy Report
By: Phil Flynn | March 8, 2023
The oil market was hit with a blunt instrument as Federal Reserve Chairman said he was none too pleased with the strength of the economy and the jobs market. He said if the government keeps spending money like a drunken sailor, the only tool he has is a very effective blunt instrument that he can hammer down and crush inflation and oil prices along with the economy and take your job at the same time. Ok, he did not quite put it that way, but the reality is, that is what he meant and could not quite say.
Louisiana Senator John Kennedy did a masterful job laying out the Fed’s case by asking Mr. Powell, “When you’re slowing the economy, you’re trying to put people out of work. That’s your job, is it not?” Sen. Kennedy also suggested that based on history for the Fed to lower inflation by 2 % historically the unemployment rate would have to rise by 3.5 %. Mr. Powell responded, “We’re not trying to [raise unemployment], we’re trying to realign supply and demand, which could happen through a bunch of channels, for example, job openings.” It could also happen if the government stopped printing and giving away money but then how would we pay for the war in Ukraine and for all of those student loans?
The market took Powell’s comments seriously as he said that the ultimate level of interest rates is likely to be higher than previously predicted. He said the totality of the incoming data indicates that faster tightening is required, and we are prepared to raise rates. His comments sent the dollar soaring and adjusted the market’s interest rate expectations this year close to 5.55% up from 5.38% at the beginning of the week.
Some of that stronger-than-expected economic data coming in may include oil demand that based on recent trends, is going to rise faster than previously thought. Yesterday the Energy Information Administration raised its oil demand forecast yet again. In the EIA Short-term Energy Outlook, the EIA raised its world demand forecast by 370,000 barrels daily for a 1.79-million-barrel increase. They also raised the US gasoline consumption in 2023 and 2024 by about 2% compared with last month’s report. U.S. gasoline consumption (current forecast) (million barrels per day) will be 8.9 versus 8.7.
Oil is trying to recover after being hit over the head with Powell’s blunt instrument because if you look at things other than the interest rate and the dollar, they are supportive. OPEC suggested that despite expectations of a tightening global market they have no plans to raise production. OPEC is saying that they are concerned about a demand slowdown in the US and Europe probably because of the blunt instrument that Powell has but is saying that Asia is experiencing ‘phenomenal’ growth. OPEC’s chief Al-Ghais said OPEC is not going to raise output this year.
Russia for its part says it will continue to reduce production and will not recognize any oil price caps. Reuters reported that Russia plans to cut oil exports and transit from its western ports in March by 10% on daily basis from February, according to market sources and Reuters calculations.
The API also reported a crude draw, finally saying that US crude supply fell last week by 3.835 million barrels. This should be the start of a trend of falling crude supply.
The EIA releases its version of the report today after its admission that its oil barrel counting methods and models have been broken and need to be fixed. The EIA should report a substantial crude draw unless they must make another adjustment to reflect uncounted crude variants that could be classified as crude oil. The API did report much-needed product increases with gasoline increasing by 1.840 million barrels and distillates by 1.927 million barrels.
Regardless of the Fed adjustment, even the Fed realizes that their blunt instrument can only have a minimal effect on oil unless they cause a major recession. While the oil and product prices have to adjust for a stronger dollar and economic policy, it does not change our forecast for oil getting back to $100 a barrel later in the year. We do not believe that the tough talk from the Federal Reserve is going to slow oil demand enough this year and even next to overcome a market that will be undersupplied by at least one to two million barrels a day later this year.
As far as natural gas in concerned, the EIA now sees natural gas prices averaging $3.02 per MMBtu this year, down 11.2 percent from its previous forecast of $3.40 per MMBtu. For comparison, natural gas prices averaged $6.42 per MMBtu in 2022, the EIA estimates. The EIA has also lowered its forecast for natural gas prices for next year, to $3.89 per MMBtu, down from its estimate of $4.04 per MMBtu made in its previous report.
Corpus Christi is going to expand its export capability and that’s going to help both oil exports and natural gas exports hit record highs. Stay tuned.
Read Full Story »»»
DiscoverGold
Today's Futures Heat Map • Weakest: Silver, Platinum, Palladium, Crude Oil
By: Barchart | March 7, 2023
• Today's Futures Heat Map
Strongest: Natural Gas, Coffee, Lean Hogs, U.S. Dollar Index
Weakest: Silver, Platinum, Palladium, Crude Oil
Ouch for Metals!

Read Full Story »»»
DiscoverGold
Agriculture Master Report
By: Markets & Mayhem | March 7, 2023
MAY BEANS

May Beans continue to be the beneficiary of the intensifying Argentine drought with the latest estimates of 30-32 MMT (1st est – 48)! The USDA will update their #’s on Wednesday 3-8-23 & the anticipation of some low-ball estimates – possibly under 30 MMT- has rallied the mkt – even with weakness in its sister mkts – May Wht & Corn! As well, the renewal of the Russian-Ukraine Grain Corridor Deal– due to expire on 3/18/23 -seems to be hanging in the balance – with Turkey very interested in renewing but Russia dragging their feet! So, despite a record crop in Brazil, May Beans are hovering just under their 6-month highs of $15.50 – quite remarkable & due in large part to carry-out on 6 year lows globally!
MAY CORN

May Corn seems to be caught in the middle – with the very bearish May Wht pulling it down & the bullish May Beans pulling it up! Today, was a good example with beans up double digits & Wht down double digits & Corn in the middle down 3 cents! This morning 2 flash sales of 182,000mt to Unknown & 110,000mt to Japan helped underpin the mkt! Technically, the mkt broke thru 6-month support at 640 but has not really followed thru on the downside – congesting around the 640 mark! The mkt is anxiously awaiting the Wed USDA Monthly S & D Report at 11am – particularly focusing on the Argentine corn & beans as drought continues to ravage their crops! Since early Feb the US Dollar has rallied 500 points but this has been offset by a $7.00 rally in the crude oil! Also, all eyes on the Fed as they continue to battle inflation by ratcheting up interest rates – albeit by only ¼ % last month! and the trade will be closely monitoring the 3/31/23 Planting Intentions & Qtly Stks – 3/31/23!
MAY WHEAT

Since Mid-Feb, May Wht has plummeted $1.00 (8.00-7.00) – mostly off the inundation of cheap Russian Wht onto the world mkt – enabled by their record crop & their need to help finance the Russian-Ukraine War! But as we enter a new growing season for the US wht & with the uncertainty surrounding the renewal of the Corridor Grain Pact, many mkt observers are saying “enough is enough”! Especially with two major USDA reports upcoming – the MARCH WADSE on Wed & the planting intentions on Friday Mar 31! The mkt is extremely oversold & caution should be used entering new short positions in front of the reports & possible Corridor Renewal Deal!
APL CAT

Apl cattle scored contract highs yesterday – as the mkt continues to be bolstered by tightening supply (beef production down 6.3% from 2022) & average weights well below normal – which implies producers are very current! As well, boxed beef cut-out was up $.88 Tues – the highest in over a year! Seasonal Demand will start kicking in soon – the Stalwart supply/demand fundamentals suggest a possible run to all-time highs!
APL HOGS

The technicals are quite obviously bearish with a spike low registered in early Feb but no new lows since! The unexpected 4th-1st Qtr surge in production (the first since 1985) has burdened the pork complex with heavy supplies that lackluster demand has been unable to eat thru! However, there are indications the mkt is trying to forge a bottom! First, the futures continue to hold a higher-than-normal premium to cash & second, the USDA pork cut-out reached its highest level since Dec 30. So maybe, the big supply is slowly being discounted by the current price – and the improving Spring Seasonal Demand could help whittle down the burdensome stocks! Plus, for the cost-conscious consumer, the cheap pork chops look very attractive next to expensive steaks in the grocery store!
Read Full Story »»»
DiscoverGold
Grains Report: Wheat, Rice, Corn and Oats, Soybeans
By: Jack Scoville | March 7, 2023
• WHEAT
General Comments: Wheat markets were lower yesterday on more reports that Russian offers continue to hit the world market and world prices. The funds maintain a huge short position in this market. The problem remains demand as world supplies are not so large and US inventories are less as well. Ideas that big Russian offers and cheaper Russian prices would be a feature for a while in the world market was the driving force for the weaker prices, and price weakness could continue. The war in Ukraine continues, but Russia is expected to allow the grain export program to continue in one form or another. Ideas are that both Australia and Russia are harvesting record to near record Wheat crops this year. Russia has a large production and is undercutting most world prices in the international market. The demand for US Wheat in international markets has been a disappointment all year and has been hindered by low prices and aggressive offers from Russia.
Overnight News: The southern Great Plains should get isolated to scattered showers. Temperatures should be near to below normal. Northern areas should see isolated to scattered showers. Temperatures will average near to below normal. The Canadian Prairies should see isolated snow showers. Temperatures should average below normal.
Chart Analysis: Trends in Chicago are mixed to down with no objectives, Support is at 692, 685, and 668 May, with resistance at 709, 722, and 738 May. Trends in Kansas City are down with no objectives. Support is at 794, 788, and 782 May, with resistance at 815, 832, and 837 May. Trends in Minneapolis are mixed. Support is at 860, 857, and 850 March, and resistance is at 880, 887, and 892 May.
• RICE:
General Comments: Rice was sharply lower and closed near the bottom of the recent trading range on weak export sales. Demand has been good from domestic sources. Export demand has been uneven. Demand has been an issue for the market all year. There is not much going on in the domestic market right now although mills are milling for the domestic market in Arkansas and are bidding for some Rice. Markets from Texas to Mississippi are called quiet. Demand in general has been slow to moderate for Rice for exports.
Overnight News: The Delta should get mostly dry conditions. Temperatures should be above normal.
Chart Analysis: Trends are mixed to down with no objectives. Support is at 1689, 1683, and 1670 May and resistance is at 1714, 1724, and 1742
• CORN AND OATS
General Comments: Corn closed a little lower yesterday and continued to test low levels not seen since late last year on ideas of weak demand. Oats closed lower and at new lows for the move. The export inspections report released Monday afternoon showed solid exports but the US remains far behind the pace to meet USDA targets. The lack of demand has been a reason for all the selling in the last week. US prices are currently very competitive with those from South America and US demand could improve because of the price differentials. Japan and unknown destinations were buyers in the daily system yesterday. Prices from South America should now remain strong as countries there concentrate on Soybeans exports, so the US has a chance now to see export demand improve. . The Brazil Winter crop is harvested and China has been buying the surplus. The Summer crop and the Argentine crop is developing under stressful conditions. The next Winter crop is going into the ground in good conditions, but it has been wet so the Soybeans harvest has been delayed and the Corn planting is becoming delayed as well. Reports indicate that the weather is now better in central and northern Brazil and that the Corn planting pace is much improved. However, Brazil sources say that 20% of the Winter crop could be planted outside of the ideal window so yields could be hurt in the end.
Overnight News:
Chart Analysis: Trends in Corn are mixed. Support is at 630, 622, and 615 May, and resistance is at 645, 648, and 652 May. Trends in Oats are down with objectives of 312 May. Support is at 322, 316, and 320 May, and resistance is at 328, 334, and 338 May.
• SOYBEANS
General Comments: Soybeans and the Soybean Meal were higher last week on speculative buying tied to the South American weather outlook and despite a weak export sales report that showed Soybeans sales at a marketing year low. Soybean Oil closed lower. Soybeans export demand is flowing to Brazil now. Argentina is the world’s largest exporter of Soybeans products while the US and Brazil battle for supremacy in Soybeans exports. The South American harvest coming to export channels in the near future. It remains hot and dry in Argentina and crop conditions are getting worse. Weather is becoming less important now as the harvest is already underway in central and northern Brazil and will spread south soon. Central and northern Brazil have seen harvest operations interrupted with too much rain but the weather is now improving and the harvest pace is increasing. Production potential for the Brazil is called very strong even with potential problems and losses in the south. Argentine production ideas continue to drop with the drought as planting is delayed and the crops already in the ground are stressed.
Overnight News:
Chart Analysis: Trends in Soybeans are mixed . Support is at 1525, 1508, and 1498 May, and resistance is at 1538, 1549, and 1560 May. Trends in Soybean Meal are up with objectives of 506.00 and 529.00 May . Support is at 488.00, 483.00, and 476.00 May, and resistance is at 496.00, 499.00, and 502.00 May. Trends in Soybean Oil are mixed. Support is at 5970, 5900, and 5870 May, with resistance at 6220, 6240, and 6380 May.
Read Full Story »»»
DiscoverGold
Softs Report: Cotton, OJ, Coffee, Sugar, Cocoa
By: Jack Scoville | March 7, 2023
• COTTON
General Comments: Cotton was higher yesterday on trading seen in front of the next round of WASDE reports. Demand ideas are improving. Demand was very strong in the report the previous week and has been ramping up for the last couple of months, but fell off. Some ideas that demand could soon increase more as China could start to open its economy in the next couple of months as Covid outbreaks should start to weaken as people get vaccinated or immune. Covid is now widespread in China so the beneficial economic effects of the opening have been delayed but these effects are being felt as the people there achieve immunity. China has also started buying again from Australia after refusing imports from that country for political reasons. The charts show that futures held at a test of the lows formed since November and that prices could start to move higher to the top end of the range at about 90 cents in the next few weeks.
Overnight News: The Delta will get mostly dry conditions and above normal temperatures. The Southeast will see mostly dry conditions and above normal temperatures. Texas will have isolated showers and above normal temperatures. The USDA average price is now 812.25 ct/lb. ICE said that certified stocks are now 1,147 bales, from 8,900 bales yesterday. ICE NY said that 0 notices were posted for delivery against March contracts and that total deliveries for the month are now 0 contracts.
Chart Trends: Trends in Cotton are mixed. Support is at 83.10, 82.90, and 82.40 May, with resistance of 85.00, 85.70 and 86.20 May.
• FCOJ
General Comments: FCOJ was sharply higher yesterday and production remains the overriding force. Historically low estimates of production due in part to the hurricanes and in part to the greening disease that have hurt production, but conditions are significantly better now with scattered showers and moderate temperatures. The weather remains generally good for production around the world for the next crop including production areas in Florida that have been impacted in a big way by the two storms seen previously in the state. Brazil has some rain and conditions are rated good. Brazil continues to export to the EU and is increasing its exports to the US. Mexico is also exporting to the US. The Florida Dept of Citrus reported that inventories are still 40.0% below last year.
Overnight News: Florida should get mostly dry conditions. Temperatures will average above normal. Brazil should get scattered showers and near normal temperatures. ICE NY said that 0 notices were posted for delivery against March futures and that total deliveries for the month are now 0 contracts.
Chart Trends: Trends in FCOJ are mixed to down with no objectives. Support is at 227.00, 219.00, and 217.00 May, with resistance at 234.00, 236.00, and 240.00 May.
• COFFEE
General Comments: New York closed higher and London closed a little lower in correction trading. Higher differentials in Brazil and Vietnam caused by a lack of offers from producers in both countries remain a feature of the market. Demand has been increasing for Colombian coffees due to reduced differentials there, but the rest of Latin America remains high. Central America differentials remain firm with not much demand showing. Ideas of big production for Brazil continue due primarily to rains falling in Coffee production areas now. Vietnam is estimated to have very good production this year due to a good growing season. There are ideas that production potential for both countries has been overrated. The weather in Brazil is currently very good for production potential but worse conditions seen earlier in the growing cycle hurt the overall production prospects as did bad weather last year. Vietnam is getting less rain now to aid harvest progress but volumes offered have not increased.
Overnight News: ICE certified stocks are lower today at 0.765 million bags. The ICO daily average price is now 173.04 ct/lb. Brazil will get scattered showers with near to above normal temperatures. Central America will get scattered showers. Vietnam will see scattered showers. ICE NY said that 0 contracts were tendered for delivery against March futures and that total deliveries for the month are now 620 contracts.
Chart Trends: Trends in New York are mixed to down with objectives of 175.00 May. Support is at 177.00, 176.00, and 174.00 May, and resistance is at 181.00, 185.00 and 190.00 May. Trends in London are mixed to up with objectives of 3300 and 3360 May. Support is at 2140, 2110, and 2090 May, and resistance is at 2190, 2210, and 2240 May.
• SUGAR
General Comments: New York closed mixed and London closed lower yesterday and both markets. Brazil production is set to recover this year with production estimated by Datagro at 38 million tons in Center-South areas. Indian production is thought to be 33 million tons this year or less and the market has had to ration that supply via price. Thailand expects to export 7% more than last year. Good production prospects are seen for crops in central and northern areas of Brazil, but the south has seen drier weather. There is concern that the rainy areas will stay too wet and delay the harvest and dilute the Sugar concentrations in the cane in central areas. The harvest is active in Thailand. Australia and Central America harvests are also active. European production is expected to be reduced again this year, with French planted area likely to decline to a 14 year low for Sugarbeets.
Overnight News: Brazil will get scattered showers. Temperatures should average near to above normal. India will get mostly dry conditions and near to above normal temperatures.
Chart Trends: Trends in New York are up with objectives of 2160 and 2270 May. Support is at 2060, 3040, and 3010 May and resistance is at 2110, 2140, and 2170 May. Trends in London are up with objectives of 601.00 May. Support is at 574.00, 566.00, and 561.00 May and resistance is at 591.00, 597.00, and 603.00 May.
• COCOA
General Comments: New York and London closed higher as West African exporters are not offering. Wire reports said that a lot of Ivory Coast Cocoa is getting smuggled to other countries for export due to higher prices being paid. Trends are up in both New York and London. Talk is that hot and dry conditions reported in Ivory Coast could curtail mid crop production, but main crop production ideas are strong. Those ideas changed a little over the weekend due to heavy rains reported in Cocoa areas of the country. Ghana has reported a disease in its Cocoa to hurt production potential there. The rest of West Africa appears to be in good condition. Good production is reported for the main crop and traders are worried about the world economy moving forward and how that could affect demand. The weather is good in Southeast Asia.
Overnight News: Isolated showers are forecast for West Africa. Temperatures will be near normal. Malaysia and Indonesia should see scattered showers. Temperatures should average near normal. Brazil will get isolated showers and near to above normal temperatures. ICE certified stocks are lower today at 5.062 million bags. ICE NY said that there were 0 notices posted for delivery against March contracts and that total deliveries for the month are now 615 contracts.
Chart Trends: Trends in New York are mixed. Support is at 2730, 2700, and 2660 May, with resistance at 2810, 2840, and 2900 May. Trends in London are mixed. Support is at 2100, 2060, and 2020 May, with resistance at 2150, 2170, and 2200 May.
Read Full Story »»»
DiscoverGold
Deliveries on Euro Financials/Gasoil/Milling Wheat
By: The PRICE Futures Group | March 7, 2023
• Tomorrow is Last Trading Day for Mar Euro Bunds, Buxl, Bono, BTP, Bobl, Foat and Schatz.
• Fri, Mar 10th is Last Trading Day for Mar Gasoil and Milling Wheat.
Read Full Story »»»
DiscoverGold
Grain Farmers & Traders Ready For March Reports. The Corn & Ethanol Report
By: Daniel Flynn | March 7, 2023
We kickoff the day with Redbook YoY at 7:55 A.M., Fed Powell Testimony, IBD/TIPP Economic Optimism and Wholesale Inventories MoM at 9:00 A.M.,NY Fed Treasury Purchases 4.5 to 7 yrs. at 9:30 A.M., 3-Year Note Auction at 12:00 P.M., Consumer Credit Charge at 2:00 P.M., API Energy Stocks, LMI Logistics Managers Index Current, Manheim Used Vehicle Index MoM & YoY at 3:30 P.M.
On the Corn Front the market remains in a chop, there is optimism that progress is being made on extending the Black Sea Initiative, Turkey’s Foreign Minister Merlut Cavusoglin said this weekend they are working to extend the UN backed Black Sea Grain Deal. Meanwhile China set its economic growth tp5% in 2023, in 2022 the estimate was at 5.5% but with Covid restrictions the number came in at 3%. Argentina remains hot & dry with better prospects for rain this weekend. Tomorrow’s Crop Production USDA Supply/Demand and WASDE data could keep the bulls at home until the March 31st Grain Stocks and Prospective Plantings. Better export numbers will also be in the mix as speculative longs monitor the fundamental news. Meanwhile, the US seeks consultation with Mexico over GMO corn restrictions. The US government has escalated its trade dispute and has called for consultations on GM corn for human consumption, and could eventually ban GM corn for animal feed. The US Trade Representative’s Office said the ban could, “threaten to disrupt billions of dollars in agricultural trade.” In the overnight electronic session the May corn is currently trading at 637 ¼ which is a ¼ of a cent higher. The trading range has been 638 ¾ to 636 ½.
On the Ethanol Front the Mexico news could cut US exports for ethanol and biofuels as other countries are expanding use for US ethanol and biofuels. The EPA will hold a virtual public hearing on March 21 to gather comments on its proposed rule that aims to allow year-round sales of E15 in Illinois, Iowa, Minnesota, Missouri, Nebraska, Ohio, South Dakota and Wisconsin starting in 2024. The agency released the proposed rule on March 1st in response to a petition filed by several Midwestern governors in April 2022. Typical response from the EPA a bureaucratic agency that appoints people not votes them in. So they can deny blame on the trainwreck in Palestine, Ohio just like they did with toxic waste spill with the Gold King Mine that brought an environmental disaster in the Animas River in Colorado. There were no trades or open interest in ethanol futures.
Read Full Story »»»
DiscoverGold
Capacity Tapped Out. The Energy Report
By: Phil Flynn | March 7, 2023
Oil prices can fret about what Fed Chair Jerome might say today or they may fret that in the UK they are asking people to conserve power. They might fret that the Kremlin said that they do not recognize the price cap but underlying the noise is the fact that global spare oil production capacity is at historic lows.
Short sighted green energy pipedreams and the ESG movement are largely to blame for the historic underinvestment in fossil fuels. The situation is so obvious that as Reuters reports, “U.S. energy executives and top OPEC officials on Monday discussed concerns about a lack of spare oil production capacity at a private dinner on the sidelines of a Houston conference, an executive who attended said. The dinner with shale producers and OPEC officials continued a tradition that began around five years ago when they were fierce competitors. It has been held in most recent years during the CERA Week energy conference in the U.S. oil industry capital. The main takeaway from their discussion was concern among those present that there was little spare capacity in the market, Devon Energy (DVN.N) Chief Executive Officer Rick Muncrief told reporters as he left the restaurant. Do You Think?
For years I have been warning of the coming energy crunch. The reality is that with China reopening and continuing demand improvements with recent economic growth, we will see the global crude market sink into a deficit in the coming months. There will not be US Strategic Petroleum Reserves this time to cool off the market. And sadly, the Biden administration failed in its attempt to buy oil back leaving us with a void in emergency supply. On top of that the Energy Information Administration is vowing to fix its oil data that may have been giving the oil market a false sense of supply security.
The historically warm winter has also given the market a false sense of security that the oil crisis is over. Yet in the UK they are still having issues. Tomorrow, the UK grid may request that some households cut their power consumption. I guess that is what happens when the wind does not blow and the sun does not shine.
The world has also has a sense that the price caps on Russia are working. Nothing could be farther from the truth. The reality is that prices have not tested the price cap level and when they do we will see shortages. The US Energy Envoy Amos Hochstein said, “The price caps imposed by the G7 and allies to force Russia to sell its crude and fuel at a discount are working well” but that ignores reports that Russia is selling their oil well above the Urals price.
Reuters reported, “The Kremlin said on Tuesday that it did not recognize the price cap introduced by Western countries on its oil exports, after the United States said that the cap was “working well”. Washington was one of the key architects of the Western price cap on Russian oil, which aims to drive down Moscow’s revenues used to fund its invasion of Ukraine. “We do not and will not recognize any cap. We are working so that this system does not harm our own interests,” Kremlin spokesman Dmitry Peskov told reporters.
Oil should see a draw in tonight’s API report. The market for oil may move on Fed Chair Powell’s comments but his comments should only have a short-term impact. The revenge of the refiners is coming as they start to come out of maintenance leading to projected larger and sizable crude draws in the weeks ahead. Product draws are also expected and we should see the crack spreads head back up perhaps to record highs.
Read Full Story »»»
DiscoverGold
Low Expectations. The Energy Report
By: Phil Flynn | March 6, 2023
China’s oil demand expectations come and then they go. On Friday, oil soared on signs of strong demand but today expectations are being tempered. Oil prices are dipping as China sets an easy-to-reach growth target of just 5%. Oil traders and grain traders took this as a sign that the China covid reopening might not be as gangbuster as some had hoped. But if you look at the surrounding evidence for the Chinese reopening, it’s clear that China most likely is going to aim low so they can exceed expectations.
A clear sign pointing to that fact was the move by Saudi Arabia over the weekend to raise their selling price for oil. Saudi Aramco raised the official selling price (OSP) for Arab light crude for Asia by USD 0.50/bbl m/m to USD 2.50/bbl for April. If Saudi Arabia feels confident enough to raise prices to China, they must feel pretty good about the demand growth expectations. They may also want to drain US and Russia supply but the main reason is they are convinced they can raise prices and maintain market share.
Bloomberg News reported that, “The Paris-based agency raised its estimate of global oil demand growth for this year by 100,000 b/d to 2 million b/d on the back of a “resurgent” China and an aviation recovery, it said in its latest monthly oil market report published Feb. 15. OPEC has also forecast China’s oil consumption to rise 400,000 b/d year on year in the first quarter of 2023 and 800,000 b/d on the year in the second quarter, with ground and air travel seeing strong rebounds after years of strict lockdown measures, it said in its latest monthly market report published Feb. 14. China also may cut its clean oil product exports to as low as 1.5 million mt (385,000 b/d) in March from above 3 million mt in the previous months due to the maintenance season while domestic demand recovers amid reopening coupled with negative export margins, market sources previously told S&P Global Commodity Insights.
China is still a demand driver key. The Biden administration seems to be all over the place when it comes to its China policy. It seems that China has become more of a threat under Biden’s weak leadership. The AP reports that, “The Biden administration is close to tightening rules on some overseas investments by U.S. companies in an effort to limit China’s ability to acquire technologies that could improve its military prowess, according to a U.S. official familiar with the deliberations. The soon-to-be-issued executive order from President Joe Biden will limit American investment in advanced technologies that have national security applications — such as next-generation military capabilities that could help China improve the speed and accuracy of military decision-making, according to the official, who was not authorized to comment and spoke on the condition of anonymity.” Still, according to Bloomberg, the National People’s Congress on Sunday, suggests strong monetary or fiscal help may be off the table for now.
There is good news from the Energy Information Administration as they fix the all-important “Petroleum Status Report”. The growing complexions of the US and global crude market have led to record-breaking and misleading crude oil adjustments giving a false perception of crude oil supply. Reuters reported that, “The U.S. Energy Information Administration said on Friday that crude oil blending and under-reported oil output were key reasons for recently high adjustment figures in the weekly oil inventory data. The EIA will change its surveys to get more accurate crude output data, and also change its accounting methods for crude oil blending, Joe DeCarolis, an official with the EIA, said on Twitter.
The EIA has posted three consecutive weeks of relatively high adjustments to crude inventory data. In the most recent data, the EIA reported an adjustment factor of about 2.27 million barrels per day (bpd), on par with the largest adjustment ever since records began in 2001. The EIA recently completed a 90-day assessment of the high adjustment figures, DeCarolis said. Some reported U.S. crude oil exports include other products, likely natural gasoline and naphthas, which can be blended into crude or reported as crude exports, he added. “That would mean that the amount of actual U.S. crude exports is slightly less than what is reported,” he said.
On top of that, record breaking crude oil exports from the US has changed the dynamic of how they count barrels that are getting ready to be exported. I applaud the EIA for making these changes and despite the recent criticism of their data, they are still the best oil reporting agency in the world.
Reuters reported that last week the EIA said, “The United States exported about 5.63 million bpd of crude, the highest on record, EIA data showed. In comparison, the strongest week for U.S. crude exports from data and analytics firm Kpler was 4.48 million bpd in the week ended Sept. 23. So that difference is playing havoc with the data and could lead to another adjustment. Also, the EIA may have to make a separate category for some blends of crudes. The EIA said that crude oil blending is also contributing to the higher adjustment figures, largely due to field condensate, which is often collected in gas gathering lines or at the inlet to gas processing plants and introduced into the crude oil system as light hydrocarbons, DeCarolis said. Production data on these liquids is not collected in the EIA’s current natural gas or crude oil surveys, and they largely go unaccounted for as they enter the crude oil system, DeCarolis said.
Natural gas took a big step back last night as weather models seemed to warm up.
Time to get hedged on gasoline and diesel. Crack spreads should head back toward records.
Read Full Story »»»
DiscoverGold
What I'm Watching This Week In The Grain Markets
By: Barchart | March 5, 2023
Yet again, rumors of the soybean market’s death appear to have been exaggerated. The market bounced back respectively this week after testing what has been solid support around the $14.85 level in the May contract.
While friends tell me to stop trying to figure out the soybean market, I can’t help but be drawn to it, wondering just what the heck is going on in the complex. Many—me included—had anticipated a significant sell off to take place around the first of the year once we were able to confirm the Brazilian crop was at least 150 mmt.
A crop of 150 mmt out of Brazil would be 918.5 million bushels larger than last year’s crop and provide Brazil 90 mmt at minimum, of supply available for export, with some feeling Brazilian exports could be as high as 97 mmt this year. To put that type of exportable surplus in context, the United States will export just over 54 mmt of beans this year.
It felt as though the move lower would be a slam dunk. The early start to planting in some parts of the country would make for an early start to the Brazilian export season, while continued Covid lockdowns in China would limit bean needs in the first part of the year. Analysts were all but convinced we would see cancellations of purchases by unknown and China from the US and that the USDA would be forced to adjust export projections lower.
However, no one was anticipating a historical drought to take place across much of Argentina for the entirety of their growing season. This and the Chinese government abruptly dropping Covid restrictions prompting a sharp increase in demand expectations, have changed the dynamic of the global bean market, creating sharp inversions and interesting cash market developments.
Much of what happens in the futures market is influenced by developments in the cash markets, which is why I watch what is happening in the cash markets around the world most when it comes to helping determine what I think might happen next in a market.
Basis and spreads are heavily influenced by what’s taking place in the physical space as they work to encourage or discourage movement of product. Basis tends to be more of a trickle-down factor in the market structure with the strongest value in the region setting the market and logistics having a say in much of the rest.
Spreads function similarly to basis, but on a much larger scale as an elevator or commercial manages their selling decisions based on their exposure to spreads, or the trades they made in anticipation of market moves. When an elevator buys physical grain they sell corresponding futures on the board, maintaining a short position until the physical grain is sold, and a long futures position is exchanged to offset the sale.
If the physical grain is not sold and the elevator is maintaining a short position in a futures month ahead of an inversion they have two options, sell the grain against the futures month their position is in risking weaker basis or roll their position and take a loss on the spread with the idea basis improvements will offset that loss when the grain is eventually sold.
Inversions are an indication of a bullish market setup as the structure is working to encourage grain movement in the front half by making it costly to hold those physical supplies into the inverse, while also trying to elevate nearby prices enough to make end users go more hand to mouth in the short-term.
What’s been most interesting the last couple of years though is the sharp inversions that we’re seeing in the soybean meal market structure combined with growing demand for vegetable oils due to renewable fuel expansion has kept crush margins elevated. Elevated margins are keeping the world crusher doing everything they can to capture as much nearby margin as possible.
This has been evident not only in cash market bids across the US, but has been seen in Chinese buying that seems to only be aggressive for owning beans no more than 6 weeks out.
This dynamic has had an interesting influence on the market especially recently, as the slow start to Brazil’s harvest and the drought in Argentina decimating much of what would be the earliest soybeans to arrive to the market has kept the US export program functioning far longer than what we would normally see.
As it stands currently, the Chinese crusher is thought to be mostly covered for March movement, with 60% of their April needs covered. This week rumors hit my inbox of China buying US beans for April/May shipment, something that would make zero sense when looking at market value alone as Brazil is 90 cents cheaper than US values, but with Brazil’s port capacity all but maxed out recently and margins remaining positive, it is not entirely impossible.
To meet USDA export projections, we need to ship the soybean bushels currently on the books as well as sell an additional 9 million bushels or so of beans a week to finish the year, something that looks increasingly likely to happen—and just one more piece to the bullish puzzle buyers say is being put together in the bean market.
Here’s the deal though, that additional supply out of Brazil is still there, though it may currently be pent up. They will have an additional 478 million bushels of projected exports above a year ago, 13 million metric tons of additional exports according to the USDA, two extra months’ worth taking recent pace into consideration.
If the wheat market has taught us anything this year, it should be that eventually a significant growth in exportable supply out of a supplier means the rest of the world has to get on their level when it comes to values or lose out.
Interior basis levels in Brazil right now are historically low, with just over a third of the overall crop harvested. Storage shortages are already being reported, with basis values as low as $2.50 under reportedly being offered to farmers in parts of Mato Grosso. While freight and limited space is behind the cheap values currently being paid, the levels will have a long tail when it comes to values able to be offered into the world market later in the year, something that could have a huge impact on domestic values offered if we get to where arbitrage works into the US this summer.
The crop loss in Argentina is substantial and probably the greatest we’ve seen since the 2008/2009 crop year, however the production growth in Brazil and neighboring countries cannot be ignored. Argentina will be able to import beans, strong crush margins will make for all kinds of interesting moves, but the tax implications and market needs will get beans flowing to where they are needed, keeping Argentina’s overall supply of meal into the world reasonably stable for the most part.
In times of shortages in a physical market, the bushels never get to where they are needed quickly enough but the market’s job is to incentivize it happen as fast as possible—hence the continued strength in futures and the inversions we’re seeing across the board.
In other news, but on the topic of basis, spreads and futures. Rumors this week quickly circulated that China is back buying US corn. Traders initially said around 1.5 mmt of corn was sold to China out of the PNW midweek, though a lack of a USDA flash sale announcement started to bring that into question. An unnamed Bloomberg trader was quoted saying the actual amount was closer to 300,000 metric tons, less than anticipated but Chinese demand is Chinese demand.
Moves in freight, basis and spreads confirmed the business was done, though it may be weeks before we learn just how much was actually sold. Continued updates to the Brazilian corn production outlook will likely dictate how much additional business we are able to get. China needs to buy an additional 4 mmt of corn give or take to get us close to the estimated demand projection from the USDA, so this space will have to be watched closely.
Read Full Story »»»
DiscoverGold
Commodity price changes over the last year...
By: Charlie Bilello | March 5, 2023
• Commodity price changes over the last year...
Sugar: +11%
US CPI: +6.4%
Gold: -4%
Soybeans: -9%
Corn: -14%
Copper: -15%
Silver: -16%
Gasoline: -16%
Heating Oil: -17%
Coffee: -20%
Brent Crude: -22%
Zinc: -22%
WTI Crude: -26%
Cotton: -30%
Natural Gas: -36%
Wheat: -37%
Lumber: -65%
Read Full Story »»»
DiscoverGold
Today's Futures Heat Map • Weakest: Lumber, Coffee, Pork Cutout, Orange Juice
By: Barchart | March 3, 2023
• Today's Futures Heat Map
Strongest: Natural Gas, Sugar, Crude Oil, Platinum
Weakest: Lumber, Coffee, Pork Cutout, Orange Juice

Read Full Story »»»
DiscoverGold
A massive surge in the Macro Index Model
By: Dean Christians | March 3, 2023
• The Macro Index Model surged by one of the most significant amounts in history on a month-over-month basis. After similar increases, stocks and a commodity index benefited from a jump in economic activity, while gold faltered.
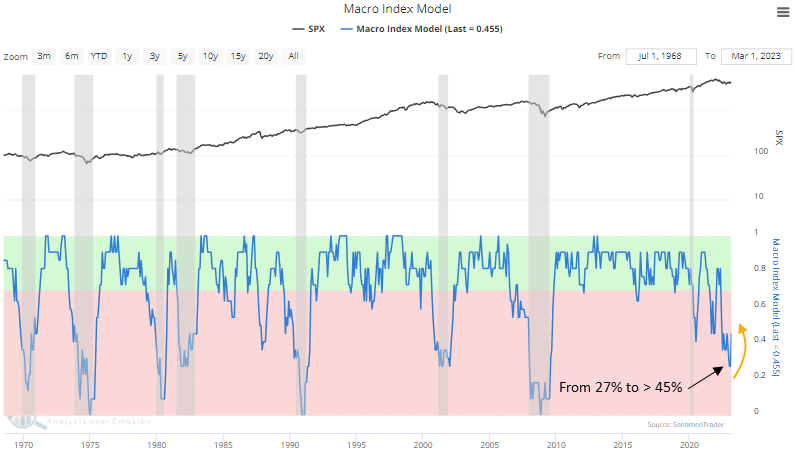
Read Full Story »»»
DiscoverGold
Deliveries on Euro Financials/Gasoil/Milling Wheat
By: The PRICE Futures Group | March 3, 2023
• Wed, Mar 8th is Last Trading Day for Mar Euro Bunds, Buxl, Bono, BTP, Bobl, Foat and Schatz.
• Fri, Mar 10th is Last Trading Day for Mar Gasoil and Milling Wheat.
Read Full Story »»»
DiscoverGold
Peak Oil Blinders. The Energy Report
By: Phil Flynn | March 3, 2023
In the oil world, we sometimes build a wall of false narratives. That leads to the oil market’s tendency to see huge price spikes and epic market crashes.
For example, who can forget the “peak oil” craze? There were predictions that the world was going into twilight out in the desert with no oil to be found. Some said Saudi Arabia’s oil production had peaked and that crude oil was going into an oil production decline. The world was running out of oil. Some believed the world only had the capability of producing 80 million barrels of oil per day.
Or how about the more recent prediction of peak demand that said oil demand had already peaked? Now we face a world where reporting agencies grudgingly predict that demand for oil will defy expectations and set new record highs that could exceed an incredible 104 million barrels a day. I won’t even get into the predictions that shale oil would keep oil below $30 a barrel forever. These narratives can put blinders on the market that sometimes can ignore coming risks in the marketplace until it is too late.
The reality is that if oil production in the world peaks, it is because of shortsighted energy policies. Policies like a politically motivated intrusion into the oil markets with government SPR releases, the rise of the ESG movement, and woke investments that are not based on market needs but to satisfy a political agenda. The hyping of climate change risks really puts trillions of dollars into the global green energy elite while the poor are their pawns and want them to stop eating meat and conform to their radical green orthodoxy. The only upside is you don’t need a gas stove to cook insects. Climate Cazar John Kerry says that we have to change the way we do everything in our life and conform to his agenda while he racks up miles in his private jet.
Yet these policies are causing massive underinvestment in the energy sector that will hit markets faster than many expect as we should see supplies tighten significantly in the coming weeks and months. Saudi Arabia continues toward massive underinvestment in supply. Saudi Aramco CEO Amin Nasser said flatly that, “The current transition plan is flawed honestly. It is not really delivering. What we need is an optimal, realistic transition plan.” Shell Chief Executive Officer Wael Sawan said today that, “I am of a firm view that the world will need oil and gas for a long time to come. As such, cutting oil and gas production is not healthy.”
The supply squeeze concerns are real. US refiners are going to come out of maintenance soon and data coming out of China suggest that we are going to see a massive spike in global demand. US total oil demand rebounded above the 20 million barrel-a-day level last year, getting back most of the covid-19 losses of the 2020-21 period. It is going to be harder to meet that demand as US oil production seems to be plateauing and SPR releases are coming to an end. The other void in supply that the market needs to prepare for is the dwindling supply of oil coming out of floating storage as pointed out so brilliantly by Bloomberg’s Javier Blass.
Blass writes, “Releases of millions of barrels from the US Strategic Petroleum Reserve and similar emergency stockpiles in Europe, Japan, and South Korea have grabbed the attention of the oil market. But there was another release that few paid attention to — and it matters. The amount of crude held in floating storage has declined significantly, contributing to the surplus that plagued the oil market during the past six months. According to the International Energy Agency, tankers used as temporary storage facilities held 79.5 million barrels by the end of 2022, down nearly 40% from the year before. The flow equates, when averaged over the year, to about 100,000 barrels a day. Although that’s a fraction of the release from emergency stockpiles, which measured about 850,000 barrels a day on average during 2022, every barrel does count.
Blass points out that traders that bought oil to store during covid are selling as their storage contracts run out. Also, Iran under sanctions has also dumped stored oil. Blass in his must-read ends it with, “at its peak, Iran had more than 100 million barrels in tankers at anchor around the world. Since June, Tehran has sold a significant chunk, according to traders. The IEA estimates that Iranian oil accounts for about 50% of all the crude and condensate that’s left in floating storage. As with the SPR releases that largely ended this year, the distributions from floating storage are dwindling, removing another supply source and, over time, tightening the market.”
Now as the oil market tightens, the Biden administration thinks it’s time to tighten sanctions on Iran. Iran is thumbing its nose at the world community and it’s advancing its nuclear program. There are reports that Israel may be getting ready to attack and Biden is going to act tough with sanctions. Word is the Biden administration is going to enforce sanctions on Iran’s petrochemical sales and also crack down on companies and vessels that have helped with Iran’s energy exports. There is no doubt the Biden administration turned a blind eye to Iran’s ignoring of sanctions in the hope that they could get back into the ill-fated 2005 nuclear accord.
Biden’s sanctions on Russian oil seem to be failing. Russia has successfully diverted its will to other customers and now will have a big hand in raising prices as they decide to cut production in response to the EU price cap. The Wall Street Journal does a wonderful piece about the players that are making the decisions surrounding the Russian and energy moves. In a must-read, The Journals says Russia’s secret weapon is a man named Pavel Sorokin, “Russia urgently needs to develop new markets for its oil and gas companies, with Western sanctions cutting into the backbone of its economy. It’s relying on a 37-year-old former Morgan Stanley banker to keep profits flowing. Pavel Sorokin, Russia’s deputy energy minister, is part of a cadre of young technocrats with deep knowledge of the West, fast-tracked by Vladimir Putin to the upper echelons of power. Mr. Sorokin, who studied finance in London, has negotiated deals in Africa and the Middle East. He played an early role in the development of OPEC+, the partnership between Russia’s oil industry and the Saudi-led Organization of the Petroleum Exporting Countries. Last year, he was influential in exaggerating the impact of damage to the Russian-controlled pipeline to the Black Sea, a move that spooked the West and pushed oil prices higher, according to his former press secretary and a former journalist at Russia’s state-run news agency. Check it out.
Natural gas got a bullish report yesterday and continues its recovery from its crash. The rebound seems to coincide with the reopening of the Freeport LNG export terminal as well as the possibility that we could get some weather.
Read Full Story »»»
DiscoverGold
Grains Report: Wheat, Rice, Corn and Oats, Soybeans
By: Jack Scoville | March 2, 2023
• WHEAT
General Comments: Wheat markets were lower again yesterday but Winter Wheat prides recovered to close a little higher as Spring Wheat prices held lower. It was a relatively narrow range day, but it is possible that Wheat is trying to find a bottom at this time. The Chicago SRW contract has been the weakest and that indicates fund selling. The funds now have a huge short position in this market. The problem remains demand as world supplies are not so large and US inventories are less as well. Ideas that big Russian offers and cheaper Russian prices would be a feature for a while in the world market was the driving force for the weaker prices, and price weakness could continue. The war in Ukraine continues, but Russia is expected to allow the grain export program to continue in one form or another. Ideas are that both Australia and Russia are harvesting record to near record Wheat crops this year. Russia has a large production and is undercutting most world prices in the international market. The demand for US Wheat in international markets has been a disappointment all year and has been hindered by low prices and aggressive offers from Russia.
Overnight News: The southern Great Plains should get mostly dry conditions. Temperatures should be near to below normal. Northern areas should see mostly dry conditions. Temperatures will average near to below normal. The Canadian Prairies should see mostly dry condition. Temperatures should average above normal.
Chart Analysis: Trends in Chicago are mixed to down with no obj3ectives, Support is at 702, 692, and 680 May, with resistance at 721, 738, and 742 May. Trends in Kansas City are mixed to down with no objectives. Support is at 807, 800, and 794 May, with resistance at 837, 853, and 862 May. Trends in Minneapolis are down with no objectives. Support is at 857, 852, and 844 March, and resistance is at 871, 880, and 887 May.
• RICE:
General Comments: Rice was lower early yesterday, but then found new buying to push higher and close at the highs of the day. It was a dramatic day. Demand has been good from domestic sources. Export demand has been uneven. Demand has been an issue for the market all year. There is not much going on in the domestic market right now although mills are milling for the domestic market in Arkansas and are bidding for some Rice. Markets from Texas to Mississippi are called quiet. Demand in general has been slow to moderate for Rice for exports.
Overnight News: The Delta should get mostly dry conditions. Temperatures should be below normal.
Chart Analysis: Trends are up with no objectives. Support is at 1742, 1724, and 1714 May and resistance is at 1762, 1773, and 1779 May.
• CORN AND OATS
General Comments: Corn closed higher yesterday after making new lows for the move. It was a great recovery for a market that really needed one and could be a sign that the selling is over and a correction higher has begun. Oats closed a little lower. The export inspections report released Monday afternoon showed bad exports once again and the US is falling far behind the pace to meet USDA targets. The lack of demand has been a reason for all the selling in the last seven days. US prices are currently very competitive with those from South America and US demand could improve because of the price differentials. Prices from South America should now remain strong as countries there concentrate on Soybeans exports, so the US has a chance now to see export demand improve. Brazil has been hanging on for its Summer crop although losses are now being reported. The situation is now more stable in southern Brazil and northern Argentina after recent rains, but the situation in central and southern Argentina remains stressed. Argentina has suffered through some extreme drought and losses could be large. The Brazil Winter crop is harvested and China has been buying the surplus. The Summer crop and the Argentine crop is developing under stressful conditions. The next Winter crop is going into the ground in good conditions, but it has been wet so the Soybeans harvest has been delayed and the Corn planting is becoming delayed as well. Reports indicate that the weather is now better in central and northern Brazil and that the Corn planting pace is much improved. However, Brazil sources say that 20% of the Winter crop could be planted outside of the ideal window so yields could be hurt in the end. China released its PMI data yesterday and the PMI weas above expectations. It was considered positive for new demand potential from China.
Overnight News:
Chart Analysis: Trends in Corn are mixed to down with no objectives. Support is at 628, 615, and 612 May, and resistance is at 637, 645, and 648 May. Trends in Oats are down with objectives of 327 and 312 May. Support is at 328, 325, and 322 May, and resistance is at 342, 345, and 348 May.
• SOYBEANS
General Comments: Soybeans and the products were lower on what appeared to be fund selling to start the day, then recovered to close higher. It could be a sign that the selling seen over the last seven sessions has run its course and a correction higher has begun. Argentina is the world’s largest exporter of Soybeans products while the US and Brazil battle for supremacy in Soybeans exports. The South American harvest coming to export channels in the near future and the lack of exports for the US has hurt the price action and created down trends for Soybeans and sideways to down trends for the products. It remains hot and dry in Argentina and crop conditions are getting worse. Weather is becoming less important now as the harvest is already underway in central and northern Brazil and will spread south soon. Sothern Brazil and northern Argentina are getting enough rain to stabilize conditions and production losses but central and southern Argentina remain very dry. Central and northern Brazil have seen harvest operations interrupted with too much rain but the weather is now improving and the harvest pace is increasing. Production potential for the Brazil is called very strong even with potential problems and losses in the south. Argentine production ideas continue to drop with the drought as planting is delayed and the crops already in the ground are stressed. Chinese demand is expected to improve in the world market and especially in Brazil with the country now open and many starting to move beyond Covid and create life and opportunity again.
Overnight News:
Chart Analysis: Trends in Soybeans are down with objectives of 1458 and 1408 May. Support is at 1476, 1472, and 1466 May, and resistance is at 1500, 1510, and 1522 May. Trends in Soybean Meal are down with objectives of 462.00 and 446.00 March. Support is at 465.00, 462.00, and 457.00 May, and resistance is at 472.00, 474.00, and 478.00 May. Trends in Soybean Oil are mixed. Support is at 5970, 5900, and 5870 May, with resistance at 6120, 63240, and 6380 May.
Read Full Story »»»
DiscoverGold
Today's Futures Heat Map • Strongest: Hard Red Wheat, Soybean Oil, Palladium, Soybean
By: Barchart | March 2, 2023
• Today's Futures Heat Map
Strongest: Hard Red Wheat, Soybean Oil, Palladium, Soybean
Weakest: Orange Juice, Natural Gas, Cotton, Lumber

Read Full Story »»»
DiscoverGold
Softs Report: Cotton, OJ, Coffee, Sugar, Cocoa
By: Jack Scoville | March 2, 2023
• COTTON
General Comments: Cotton was higher yesterday on a weaker US Dollar and news of stronger economic data from China. The Chinese PMI rose more than expected and this was considered a positive sign for increased demand. Demand was very strong in the report last week and has been ramping up for the last couple of months. Some ideas that demand could soon increase more as China could start to open its economy in the next couple of months as Covid outbreaks should start to weaken as people get vaccinated or immune. Covid is now widespread in China so the beneficial economic effects of the opening are being delayed but these effects should start to be felt as the people there achieve immunity over the next week or two. China has also started buying again from Australia after refusing imports from that country for political reasons. The charts show that futures held at a test of the lows formed since November and that prices could start to move higher to the top end of the range at about 90 cents in the next few weeks.
Overnight News: The Delta will get mostly dry conditions and above normal temperatures. The Southeast will see mostly dry conditions and near to above normal temperatures. Texas will have mostly dry conditions and above normal temperatures. The USDA average price is now 83.45 ct/lb. ICE said that certified stocks are now 1,147 bales, from 8,900 bales yesterday. ICE NY said that 0 notices were posted for delivery against March contracts and that total deliveries for the month are now 0 contracts. USDA said that week;y net Upland Cotton export sales were 170,600 bales this year and 97,200 bales net year. Net Pima sales were 1,200 bales this year and 0 bales next year.
Chart Trends: Trends in Cotton are mixed to up with objectives of 8770 and 9140 May. Support is at 82.90, 82.40, and 80.90 May, with resistance of 85.00, 85.70 and 86.90 May.
• FCOJ
General Comments: FCOJ was limit down yesterday on speculative long liquidation, but production remains the overriding force. The charts show that May is now moving lower from contract highs, and new all time highs. Historically low estimates of production due in part to the hurricanes and in part to the greening disease that have hurt production, but conditions are significantly better now with scattered showers and moderate temperatures. The weather remains generally good for production around the world for the next crop including production areas in Florida that have been impacted in a big way by the two storms seen previously in the state. Brazil has some rain and conditions are rated good. Brazil continues to export to the EU and is increasing its exports to the US. Mexico is also exporting to the US. The Florida Dept of Citrus reported that inventories are still 40.6% below last year at 102.39 million pounds.
Overnight News: Florida should get mostly dry conditions. Temperatures will average above normal. Brazil should get scattered showers and near normal temperatures. ICE NY said that 0 notices were posted for delivery against March futures and that total deliveries for the month are now 0 contracts.
Chart Trends: Trends in FCOJ are up with no objectives. Support is at 249.00, 239.00, and 235.00 May, with resistance at 261.00, 267.00, and 273.00 May.
• COFFEE
General Comments: New York closed lower and London closed higher yesterday on price action tied to higher differentials in Brazil and Vietnam caused by a lack of offers from producers in both countries. There is also a lack of offer from Colombia. Vietnam exported 323,000 tons of Coffee in the first two months of the calendar year this year, down 13.1% from last year. It seems that the market has decided that prices have captured the lack of offer in the cash market for now. Ideas of big production for Brazil continue due primarily to rains falling in Coffee production areas now. Vietnam is estimated to have very good production this year due to a good growing season. There are ideas that production potential for both countries has been overrated. The weather in Brazil is currently very good for production potential but worse conditions seen earlier in the growing cycle hurt the overall production prospects as did bad weather last year. Vietnam is getting less rain now to aid harvest progress but volumes offered have not increased.
Overnight News: ICE certified stocks are slightly lower today at 0.787 million bags. The ICO daily average price is now 175.93 ct/lb. Brazil will get scattered showers with near to above normal temperatures. Central America will get scattered showers. Vietnam will see scattered showers. ICE NY said that 2 contracts were tendered for delivery against March futures and that total deliveries for the month are now 620 contracts.
Chart Trends: Trends in New York are mixed to down with objectives of 180.00 and 175.00 May. Support is at 177.00, 175.00, and 174.00 May, and resistance is at 185.00, 190.00 and 194.00 May. Trends in London are mixed to up with objectives of 3300 and 3360 May. Support is at 2110, 2090, and 2070 May, and resistance is at 2210, 2240, and 22670 May.
• SUGAR
General Comments: New York and London closed higher yesterday and New York ran to new highs for the move. Brazil production is set to recover this year with production estimated by Datagro at 38 million tons in Center-South areas. Raizen SA, an energy producer, said that millers will produce 48% Sugar and the rest Ethanol this year. The trade had estimated the Sugar share at 46%. Indian production is thought to be 33 million tons this year or less and the market has had to ration that supply via price. A local source told the wire services yesterday that India could still export 1.0 million tons more of Sugar if production rises to the upper end of trade expectations, otherwise India is about out of Sugar available for export. Thailand expects to export 7% more than last year. Good production prospects are seen for crops in central and northern areas of Brazil, but the south has seen drier weather. There is concern that the rainy areas will stay too wet and delay the harvest and dilute the Sugar concentrations in the cane in central areas. The harvest is active in Thailand. Australia and Central America harvests are also active. European production is expected to be reduced again this year, with French planted area likely to decline to a 14 year low for Sugarbeets.
Overnight News: Brazil will get scattered showers. Temperatures should average near to above normal. India will get mostly dry conditions and near to above normal temperatures.
Chart Trends: Trends in New York are mixed to up with objectives of 2080, 2160, and 2270 May. Support is at 2010, 1990, and 1960 May and resistance is at 2080, 2110, and 2140 May. Trends in London are mixed. Support is at 561.00, 557.00, and 549.00 May and resistance is at 578.00, 582.00, and 588.00 May.
• COCOA
General Comments: New York and London closed higher yesterday, as West African exporters are not offering. Wire reports suggest that exporters are currently looking for Cocoa to make good on current contracts and are not entering into new contracts right now. However, the Ivory Coast Cocoa and Coffee Council said that there will be more than enough Cocoa for export and that exporters can fix contracts. The Council has also restricted some of the big buyers like Cargill and Callebrut from buying more as they have reached volume limits on purchases. Wire reports said that a lot of Ivory Coast Cocoa is getting smuggled to other countries for export due to higher prices being paid. Trends are up in both New York and London. Talk is that hot and dry conditions reported in Ivory Coast could curtail mid crop production, but main crop production ideas are strong. Ghana has reported a disease in its Cocoa to hurt production potential there. The rest of West Africa appears to be in good condition. Good production is reported for the main crop and traders are worried about the world economy moving forward and how that could affect demand. The weather is good in Southeast Asia. The ICCO said yesterday that it expects a production deficit of 60,000 tons this marketing year.
Overnight News: Mostly dry conditions are forecast for West Africa. Temperatures will be near normal. Malaysia and Indonesia should see scattered showers. Temperatures should average near normal. Brazil will get scattered showers and near to above normal temperatures. ICE certified stocks are lower today at 5.082 million bags. ICE NY said that there were 0 notices posted for delivery against March contracts and that total deliveries for the month are now 615 contracts.
Chart Trends: Trends in New York are up with objectives of 2860, 2880, and 2960 May. Support is at 2810, 2780, and 2730 May, with resistance at 2870, 2900, and 2930 May. Trends in London are mixed to up with no objectives. Support is at 2130, 2100, and 2060 May, with resistance at 2200, 2230, and 2260 May.
Read Full Story »»»
DiscoverGold
For What Its Wirth. The Energy Report
By: Phil Flynn | March 2, 2023
China manufacturing surges. The US is exporting a record amount of crude while imports have come to a screeching halt. Gasoline demand in the US is surging and diesel supplies are way below average. Just some of the nuggets from yesterday’s EIA report. What does that tell us? Well, if you listen to the CEO of Chevron Mike Wirth, it’s clear that there is an upside price risk in the oil market in the second half of the year.
In an exclusive interview on the Claman Countdown with Liz Claman on the Fox Business Network, Mr. Wirth not only talked about a bullish outlook for oil but the fact that the US oil reserves will have to be refilled to “serve their purpose”. In other words, don’t get too caught up with the reports from the Energy Information Administration (EIA) that tell you the oil supply is at its highest level in three years and 9% above the five-year average because you must remember that Strategic Petroleum Reserve barrels are down 208.4 million barrels from a year ago. If you take that into account, then the oil supply is at record low levels for this time of year. Plus, if the Biden administration stays true to its vow to buy oil under $70.00 a barrel, then it’s likely that will be a floor and might not ever give Biden and his team the chance to buy it.
CEO Mike Wirth also defended share buybacks with Liz Claman pointing out that Chevron produced a record amount of shale oil. They are a major producer in the Permian basin and according to the EIA, production in that basin hit an all-time high.
Mr. Wirth seemed to dodge Liz Clayman’s question about dealing with the Biden administration and the permitting process. He said that Chevron got most of the permits they needed but a lot of their drilling was done in Texas on private land where the permitting process is much easier. Yet he also seemed concerned about the Biden administration’s restriction on drilling in New Mexico and even larger concerns about longer-term projects in the Gulf of Mexico.
Industry insiders understand that if the US is going to avoid an energy shortage, clean Gulf of Mexico production is vital to secure America’s energy security. The good news is that the Gulf of Mexico Lease auction blocked by Biden will resume at the end of the month after Biden lost in court. As vindictive as this President is, it is likely that they will throw more hurdles at the permitting process. Industry insiders are now awaiting the Biden administrations’ Willow decision as a guide to Biden’s next move on his war against US oil and gas companies and oil and gas workers and small independent producers and gas station owners.
The Wall Street Journal reported in its opinion piece that, “The Willow Oil Test for Biden the biggest pending U.S. project awaits Administration approval. They wrote, “President Biden says the only barrier to more U.S. oil production is recalcitrant drillers. Ok, Mr. President, then are you going to approve Alaska’s Willow project? The Journal goes on to say, “ConocoPhillips acquired its first Willow leases in 1999 in Alaska’s National Petroleum Reserve (NPR-A), an area the size of Indiana that Congress specifically set aside for oil development. It’s the largest pending oil and gas project in the U.S., with expected production of 180,000 barrels of oil a day, and 600 million over 30 years. The Willow plan has passed every environmental analysis, would employ union labor and yield a revenue gusher. The final regulatory review was completed in early February, and it’s customary for the feds to give a final go-ahead within 30 days.
But the green left opposes Willow as a climate “bomb,” no matter that career scientists in federal agencies say. Willow completed its first federal environmental review in August 2020, only to watch a judge require another one. The Biden Bureau of Land Management (BLM) narrowed the scope from five drilling pads to three, and Willow recently passed another environmental review. The project, which will occupy 0.002% of NPR-A, would use the current Alaska pipeline and uses only temporary roads (built on ice in winter). It’s been signed off by every agency, including Fish & Wildlife and the Army Corps of Engineers. Willow is also a low-carbon project. BLM’s analysis estimates its average annual total domestic emissions will total 0.15% of 2019 U.S. emissions levels, and 0.3% of anticipated 2030 levels. BLM also notes, “in the absence of production from [Willow], the energy produced from the Project’s oil would be replaced by other [sources]” around the globe. That includes such green meccas as Venezuela.
Willow is an $8 billion investment that will create 2,500 mostly union construction jobs, and hundreds more long-term positions. It’s estimated to generate as much as $17 billion in new revenue for the feds, the state of Alaska, and North Slope and Native communities.
The project has overwhelming support in Alaska, where the state House and Senate passed unanimous resolutions in support. Both GOP Senators and the state’s Democratic Representative are lobbying the White House for approval. Yet approval remains uncertain, in part because of doubts about anti-fossil-fuel Interior Secretary Deb Haaland. Within minutes of her own BLM scientists issuing their favorable environment review last month, the Interior issued a statement citing “substantial concerns” with Willow, with references to climate and subsistence hunting. Ms. Haaland has also stiff-armed a delegation of pro-Willow Alaskan Natives seeking a meeting. They finish in this must-read with, “Willow should be easy to approve, especially given the world’s growing energy security. If Mr. Biden kills this project, either outright or on the sly, no one should believe another word he says about energy or oil prices.”
Low refinery runs and another near-record crude adjustment led to an increase in oil supply. Yet gasoline demand surged to over 9 million barrels a day suggesting that US gas demand is exceeding pre-covid levels by some measures.
EIA reported that U.S. crude oil refinery inputs averaged 15.0 million barrels per day and was 31 thousand barrels per day less than the previous week’s average. Refineries operated at 85.8% of their operable capacity last week. The commercial crude oil inventories (excluding those in the Strategic Petroleum Reserve) increased by 1.2 million barrels from the previous week. At 480.2 million barrels, U.S. crude oil inventories are about 9% above the five-year average for this time of year minus SPR supply is near record lows.
Total motor gasoline inventories decreased by 0.9 million barrels from last week and are about 5% below the five-year average for this time of year. Finished gasoline inventories were virtually unchanged while blending components inventories decreased last week.
Distillate fuel inventories increased by 0.2 million barrels last week and are about 10% below the five-year average for this time of year. Total products supplied over the last four-week period is at 20.1 million barrels a day.
The natural gas price is coming back as cash prices are strengthening across the nation. Reports that winter may return with a vengeance are giving the market some support as well as the fact that some concerns that production from natural gas will start to peak in the coming months.
The EIA reported that U.S. simple-cycle natural gas turbines operated at record highs in summer 2022. The average monthly capacity factor for simple-cycle, natural gas turbine (SCGT) power plants in the United States has grown annually since 2020. Average capacity factors surpassed 20% for two consecutive summer months in 2022—the first time on record—to meet peak electricity demand, based on data from our Electric Power Monthly. SCGT power plants typically operate year-round but are most active during the summer when electricity demand reaches its peak and varies the most. For the past five summers, SCGT power plants operated at a 17% average capacity factor from June through August. The average monthly capacity factor during the rest of the year fell to around 10% as a result of less electricity demand and more consistent wind-powered electricity generation.
Read Full Story »»»
DiscoverGold
Morning Cotton Quotes Continue Higher
By: Barchart | March 2, 2023
Cotton prices are working 6 to 24 points higher so far. Cotton futures settled the midweek session up by 1.5% to 1.9% with a triple digit bounce. May saw futures back in the 86c area, before fading back to close at 85.66 cents. The full day’s range was 3 cents. For the week, May cotton is now up by 76 points. Dec is up by 95 points for the week, and closed as a 39 point discount to May, but a 70 point premium to March.
There have been no deliveries issued against the March contract, with preliminary OI at just 10 contracts.
The Dollar Index is down by 0.5% so far today, after bouncing 4.32 through the month of Feb.
USDA reported 794 bales of cotton was consumed domestically in January. That was up from 463 RBs in December, but was down from 1,180 in Jan ’22. Cotton stocks tightened by 116 RBs to 3,396 in January. Stocks were 1,160 RBs tighter than last year.
The 2/28 Cotlook A index was firm at 99.35 cents per pound. The Seam reported 5,190 bales sold during 2/27 for an average gross price of 82.41 cents. The AWP for cotton is 70.78 cents/lb.
Read Full Story »»»
DiscoverGold
This article is outstanding… inflation is here to stay.
Cocoa futures are now trading at a 3-year high
By: Barchart | March 1, 2023
• Cocoa futures are now trading at a 3-year high.

Read Full Story »»»
DiscoverGold
$Natgas trade looks really good so far.
|
Followers
|
89
|
Posters
|
|
|
Posts (Today)
|
0
|
Posts (Total)
|
8944
|
|
Created
|
05/01/07
|
Type
|
Free
|
| Moderators DiscoverGold Pro-Life | |||
- The Commodity Bull is Running... Inflation is Running... Harder Living (i.e. FOOD, CLOTHING, SHELTER) is Dead Ahead... -
- Commodity Futures Trading -
http://finviz.com/futures_performance.ashx
All Commodity Futures Charts From Finbiz.com Available Below:
Daily
Weekly
Monthly
Quarterly
6 Months
12 Months
YTD
2 Years
5 Years
Max
Beneficial Educational Resources on Futures TradingThe futures market is volatile, and it cuts both ways. Leverage that makes it profitable can also ruin reckless, undisciplined traders overnight. Most brokers have paper trading available on their platforms, so those who are new to futures should take advantage and learn with these tools before going live with real money. Mitigate risk with stop loss orders at all times, and cut losses quickly instead of adding contracts and attempting to flip your way out of a losing position. Also, use mini instruments when available, with lower margin requirements, until you have sufficient capital to buy and sell more expensive contracts. Even though the potential is there, don't try to make too many profits at once. If things aren't going well, often times quitting for the day and collecting one's thoughts is the best decision. New opportunities come along daily. Markets are open nearly 24 hours, so set a schedule and stick to it. Avoid trading while tired or distracted, and please don't listen to the advice of others. Do research on fundamentals affecting markets as well as paying attention to TA. Watch key indices, and listen to accurate, real-time news during the session to stay aware of shifting trends. Trade smart, trade safely, and have fun.
Videos on Futureshttps://www.youtube.com/playlist?list=PL9A5C5A93D243CA44 Continuous Improvement in Progress |
Commodity Futures Trading
https://www.tdameritrade.com/investment-products/futures-trading.page
| Volume | |
| Day Range: | |
| Bid Price | |
| Ask Price | |
| Last Trade Time: |


